Average Sales Price History Map

About this chart

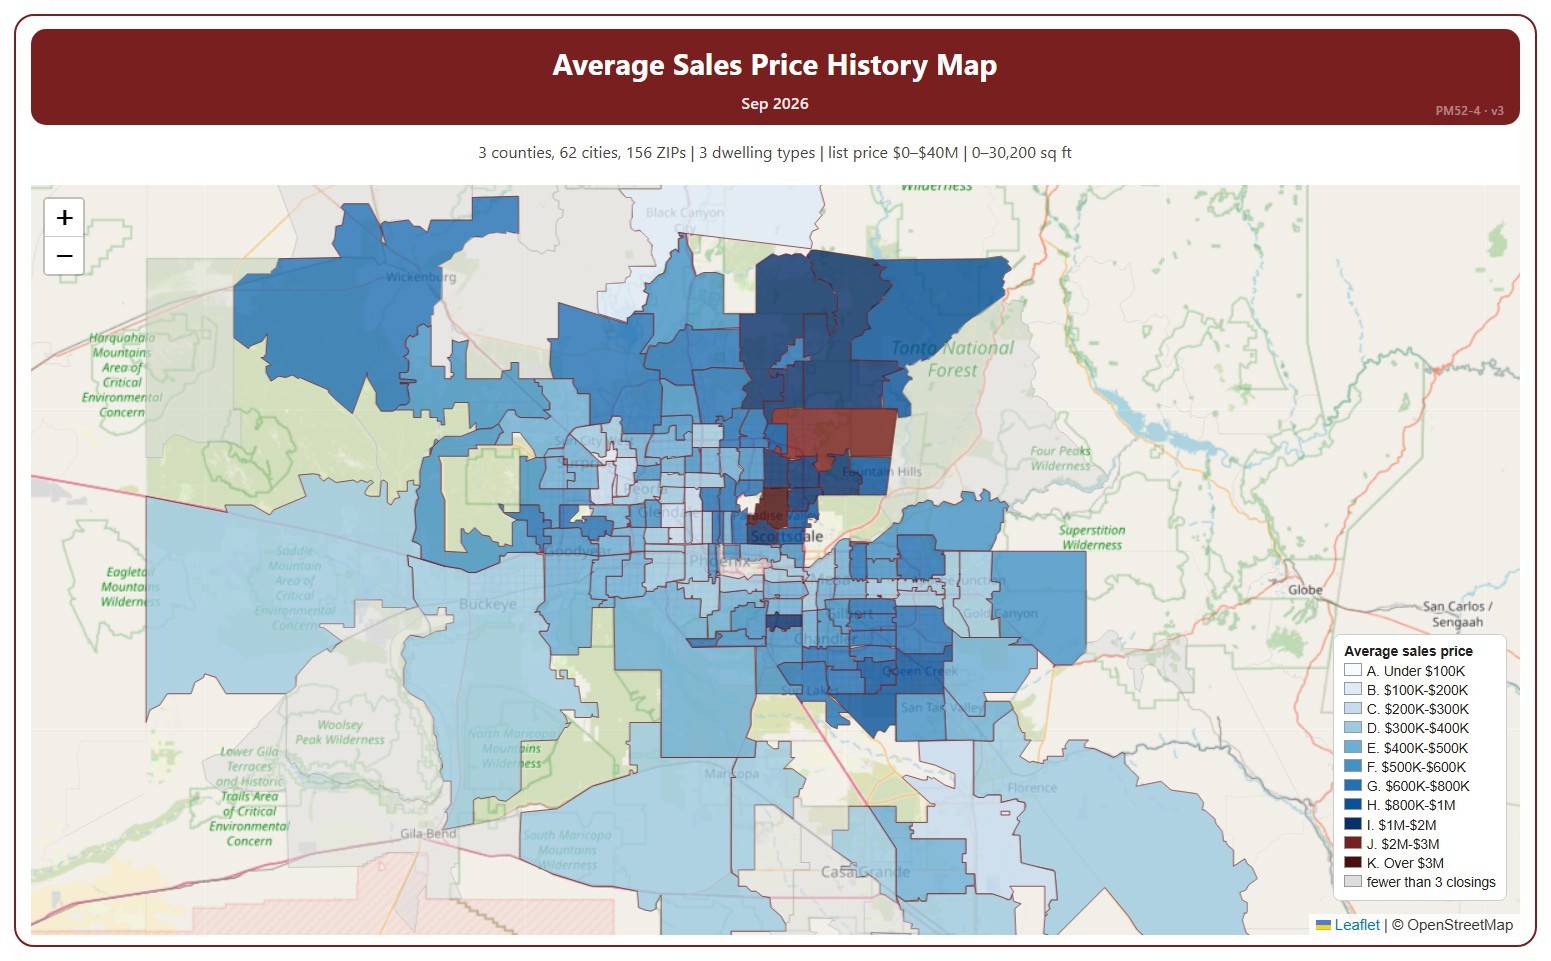
This map shades each ZIP code by the average sale price of the homes that closed in one month, in price ranges from under $100K to over $3M.

It opens on the latest complete month. Use the Month panel, or its arrows, to step back through earlier months as far as 2008. ZIP codes with fewer than 3 closings in the month are shown in grey.

It opens on the Greater Phoenix area: the counties, cities, and ZIP codes that make it up are ticked to start with. Tick or untick any of them to change the area, including counties beyond Greater Phoenix. Narrow it further with the Dwelling Type, Transaction Type, and New / Resale boxes and the list price, home size, and year built sliders.

Hover over a ZIP code to see its average price and number of closings.
Sales Month to Date by Transaction Type

About this chart

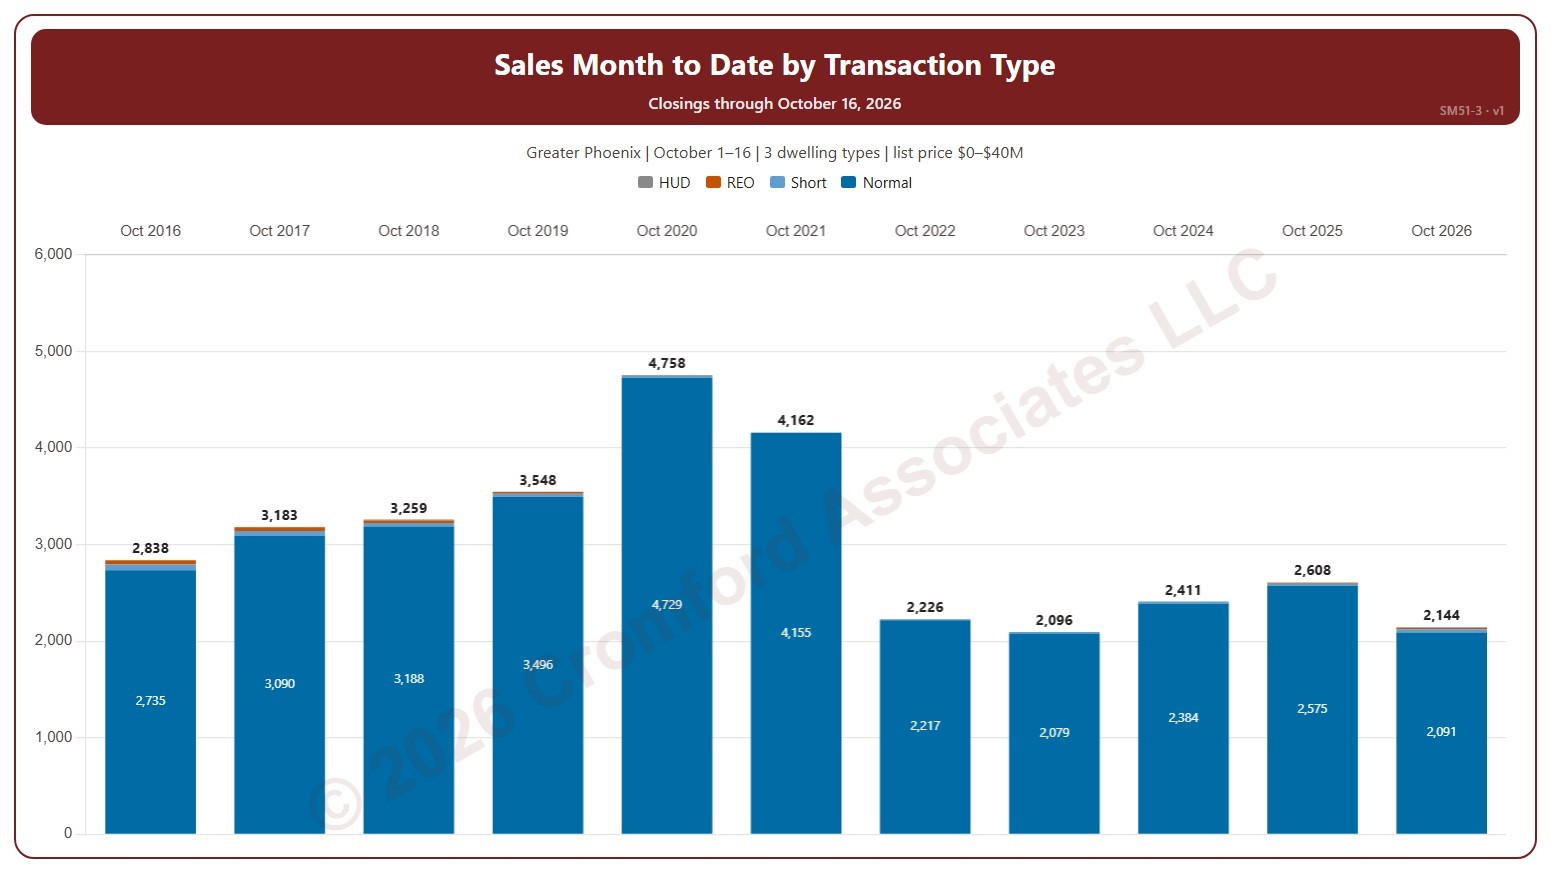
This chart shows sales month to date, each bar split by transaction type (normal, short sale, lender-owned, HUD). Each bar counts the homes that closed on ARMLS in the same month, from the same first day to the same last day, in each year, so this month so far can be read against the same days of earlier years.

It opens on the current month, from the 1st to the day of the latest closing, in every year. Use the Month list and the Days boxes above the chart to compare any month and any run of days, and Month to date to return; if the days run past the latest closing, this year’s bar is drawn lighter. Tick years in the Year box (it opens on the latest 11). The chart is updated every day.

It opens on the Greater Phoenix area: the counties, cities, and ZIP codes that make it up are ticked to start with. Tick or untick any of them to change the area, including counties beyond Greater Phoenix. Narrow it further with the Dwelling Type, Transaction Type, and New / Resale boxes and the list price, home size, and year built sliders.

Hover over a bar to see each transaction type and the total for the days chosen.

Sales Month to Date

About this chart

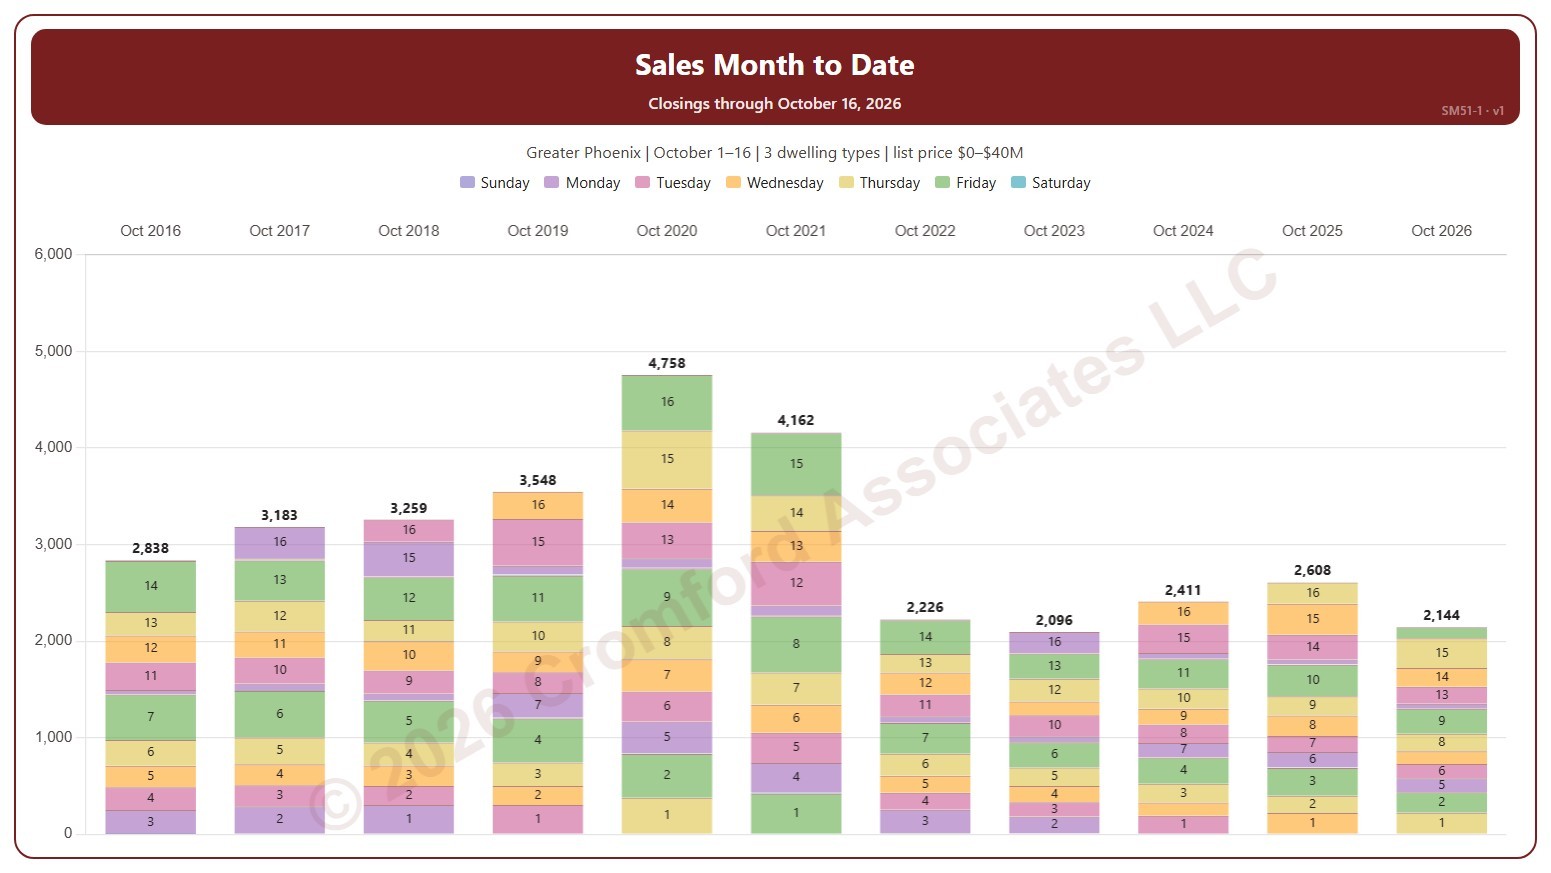
This chart shows sales month to date, each bar split into its days, colored by the day of the week and labeled with the day of the month. Each bar counts the homes that closed on ARMLS in the same month, from the same first day to the same last day, in each year, so this month so far can be read against the same days of earlier years.

It opens on the current month, from the 1st to the day of the latest closing, in every year. Use the Month list and the Days boxes above the chart to compare any month and any run of days, and Month to date to return; if the days run past the latest closing, this year’s bar is drawn lighter. Tick years in the Year box (it opens on the latest 11). The chart is updated every day.

It opens on the Greater Phoenix area: the counties, cities, and ZIP codes that make it up are ticked to start with. Tick or untick any of them to change the area, including counties beyond Greater Phoenix. Narrow it further with the Dwelling Type, Transaction Type, and New / Resale boxes and the list price, home size, and year built sliders.

Hover over a day to see its closings and the total for the days chosen.

Sales per Month by Price Range

About this chart

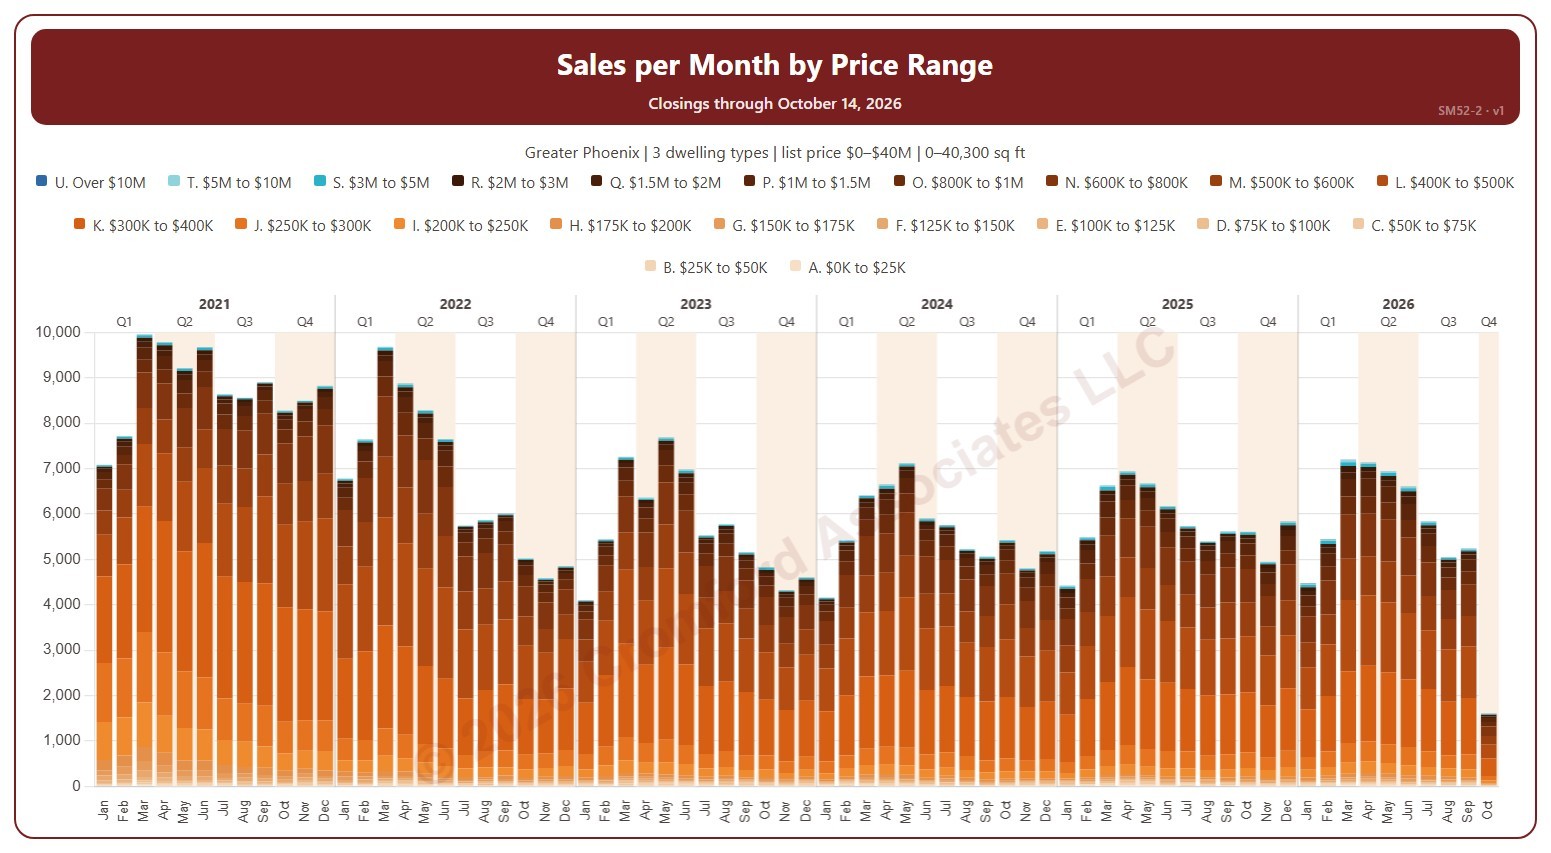
This chart shows the number of homes that closed each month on ARMLS, each bar split into 21 list price ranges, from $25K and under to over $10M.

It opens on January 2021 to date. Drag the handles of the date slider under the chart to choose the months shown, as far back as January 2000. Click a price range in the legend to hide or show it, and use the Month panel to keep only certain months of the year. The newest month is the month so far. The chart is updated every day.

It opens on the Greater Phoenix area: the counties, cities, and ZIP codes that make it up are ticked to start with. Tick or untick any of them to change the area, including counties beyond Greater Phoenix. Narrow it further with the Dwelling Type, Transaction Type, and New / Resale boxes and the list price, home size, and year built sliders.

Hover over a bar to see each price range and the total for that month.