About this chart
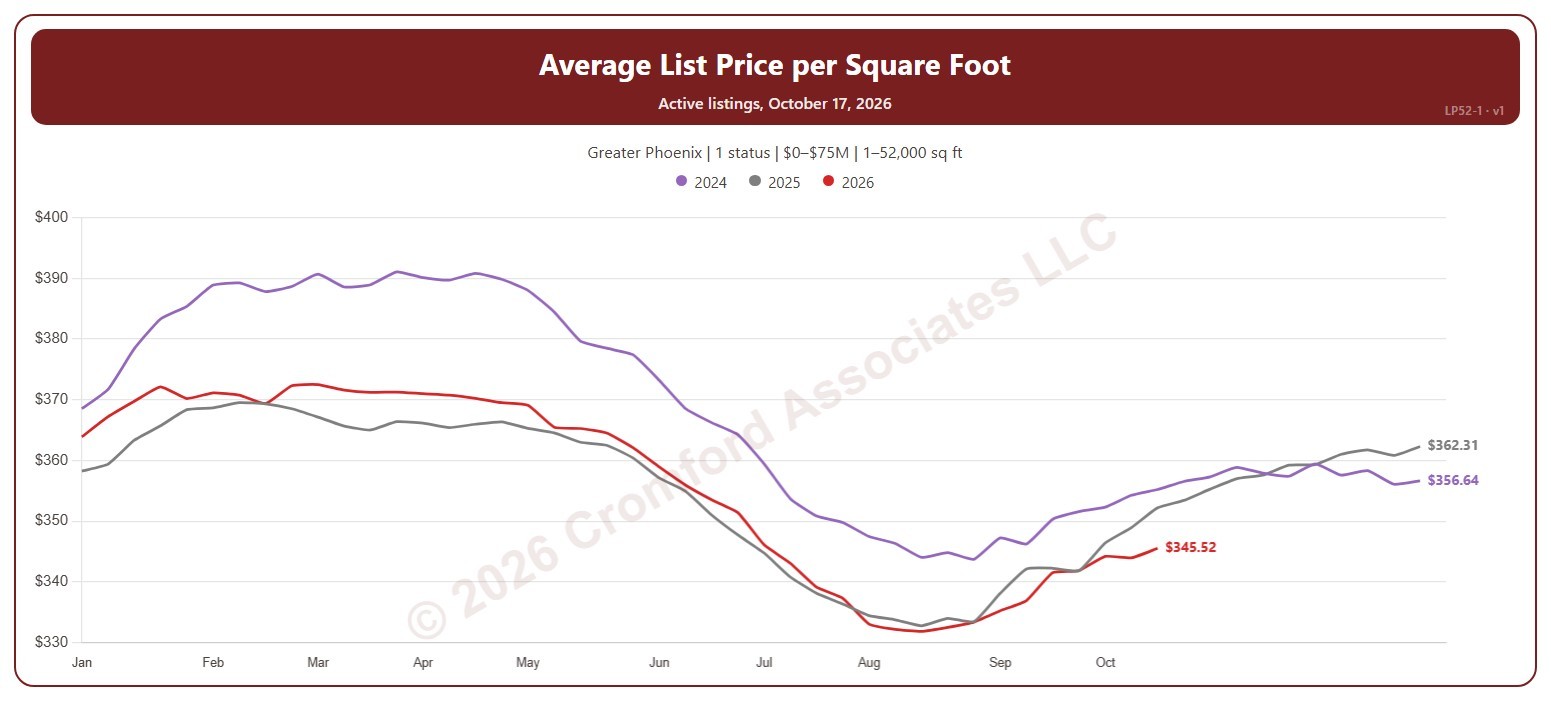
This chart shows the average asking price per square foot of the homes for sale, a line per year through the weeks of the year, so this year can be read against earlier years. The average is the total asking price of the active listings divided by their total square feet, taken every Saturday, so larger homes count for more.
It opens on the latest 3 years; tick other years in the Year box to go back as far as 2011. Click a ticked year again to fade it, and once more to remove it. The chart is updated every day.
It opens on the Greater Phoenix area and on Active listings; tick UCB / CCBS or Coming Soon in the Status box to add them. Tick or untick counties, cities, and ZIP codes to change the area, including counties beyond Greater Phoenix. Narrow it further with the Dwelling Type, Transaction Type, and New / Resale boxes and the list price, home size, year built, and days on market sliders.
Hover over the chart to see each year’s figure for that week and its Saturday.