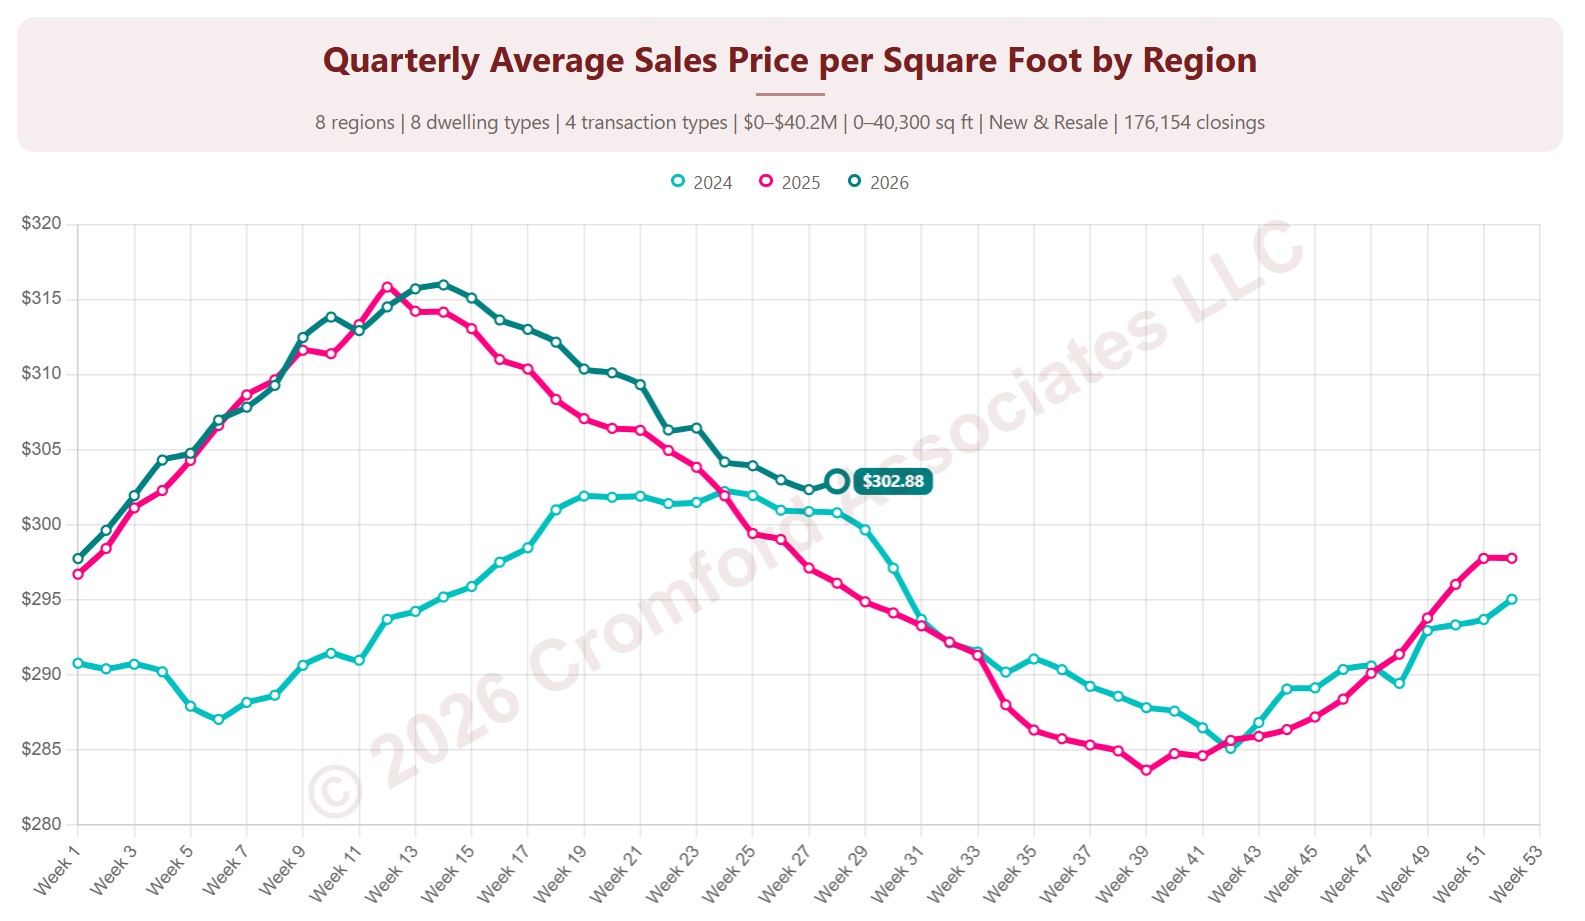
Quarterly Average Sales Price per Square Foot by City & ZIP Code

About this chart

This chart shows the average sales price per square foot of homes that closed through ARMLS, measured every week. Each point covers the homes that closed in the three months up to that week. Price per square foot lets you compare homes of different sizes; this is the true average across all the square feet sold.

Each year has its own line, laid out by week of the year, so you can compare this year with earlier years at the same point in the season. It opens on the last three years; tick any year back to 2001 in the Year panel.

It opens on Maricopa and Pinal Counties with every city and ZIP code included. Use the County, City, and ZIP panels to focus on any area, from a whole county down to a single ZIP code. Narrow it with the Dwelling Type, Transaction Type, and New / Resale boxes and the sales price, home size, and year built sliders. The Inflation (CPI) option restates prices in today’s dollars using national or Phoenix inflation.

Hover over a line to see the exact figure for that week.
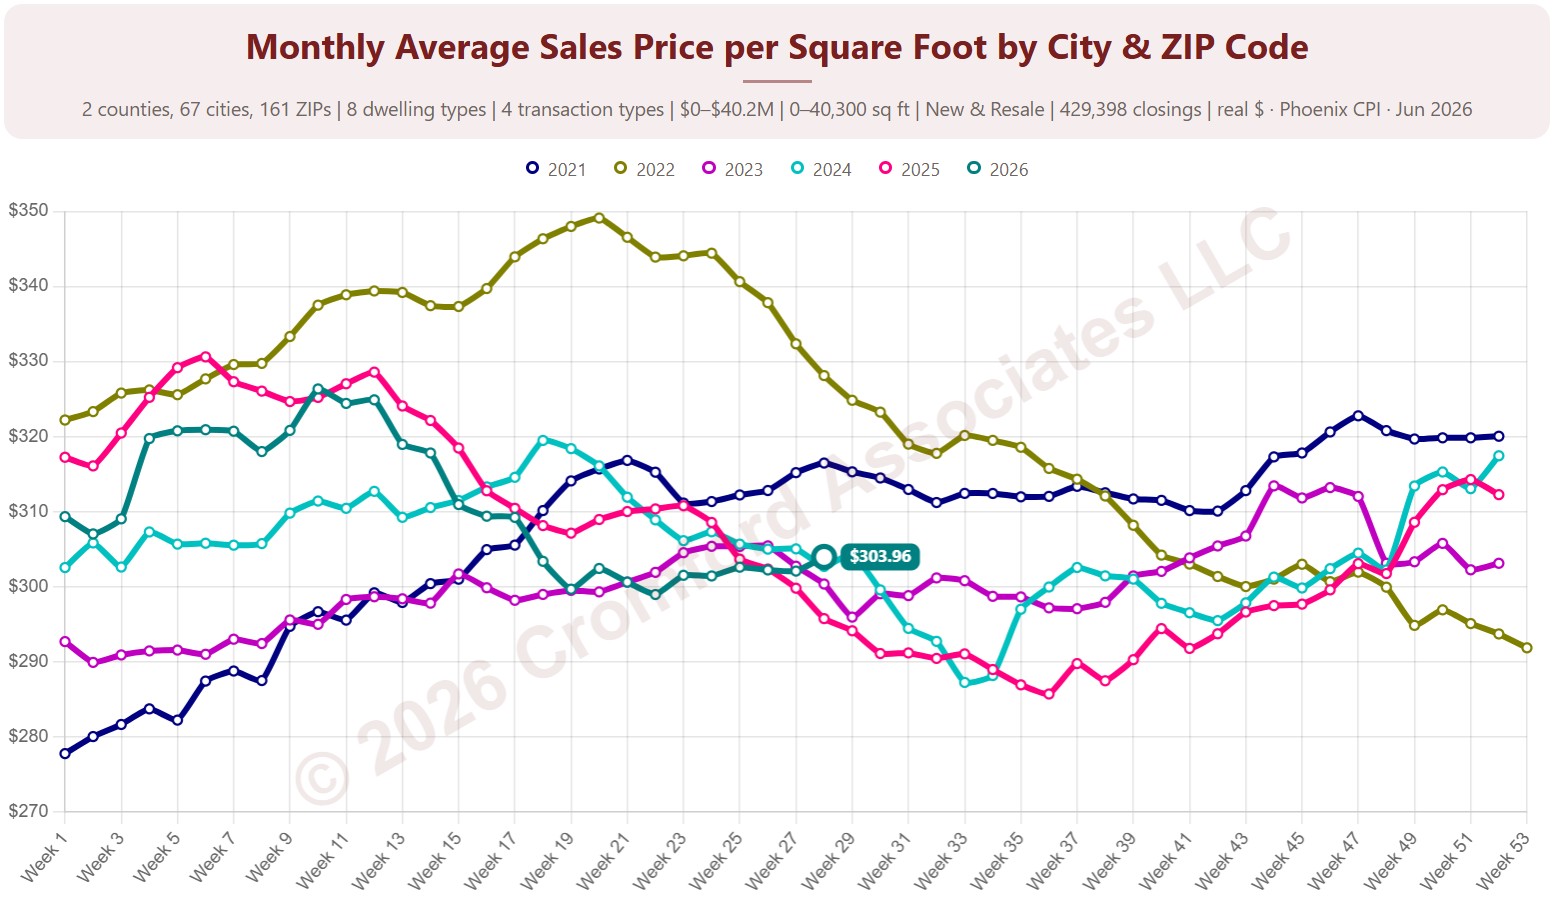
Monthly Average Sales Price per Square Foot by City & ZIP Code

About this chart

This chart shows the average sales price per square foot of homes that closed through ARMLS, measured every week. Each point covers the homes that closed in the month up to that week. Price per square foot lets you compare homes of different sizes; this is the true average across all the square feet sold.

Each year has its own line, laid out by week of the year, so you can compare this year with earlier years at the same point in the season. It opens on the last three years; tick any year back to 2001 in the Year panel.

It opens on Maricopa and Pinal Counties with every city and ZIP code included. Use the County, City, and ZIP panels to focus on any area, from a whole county down to a single ZIP code. Narrow it with the Dwelling Type, Transaction Type, and New / Resale boxes and the sales price, home size, and year built sliders. The Inflation (CPI) option restates prices in today’s dollars using national or Phoenix inflation.

Hover over a line to see the exact figure for that week.
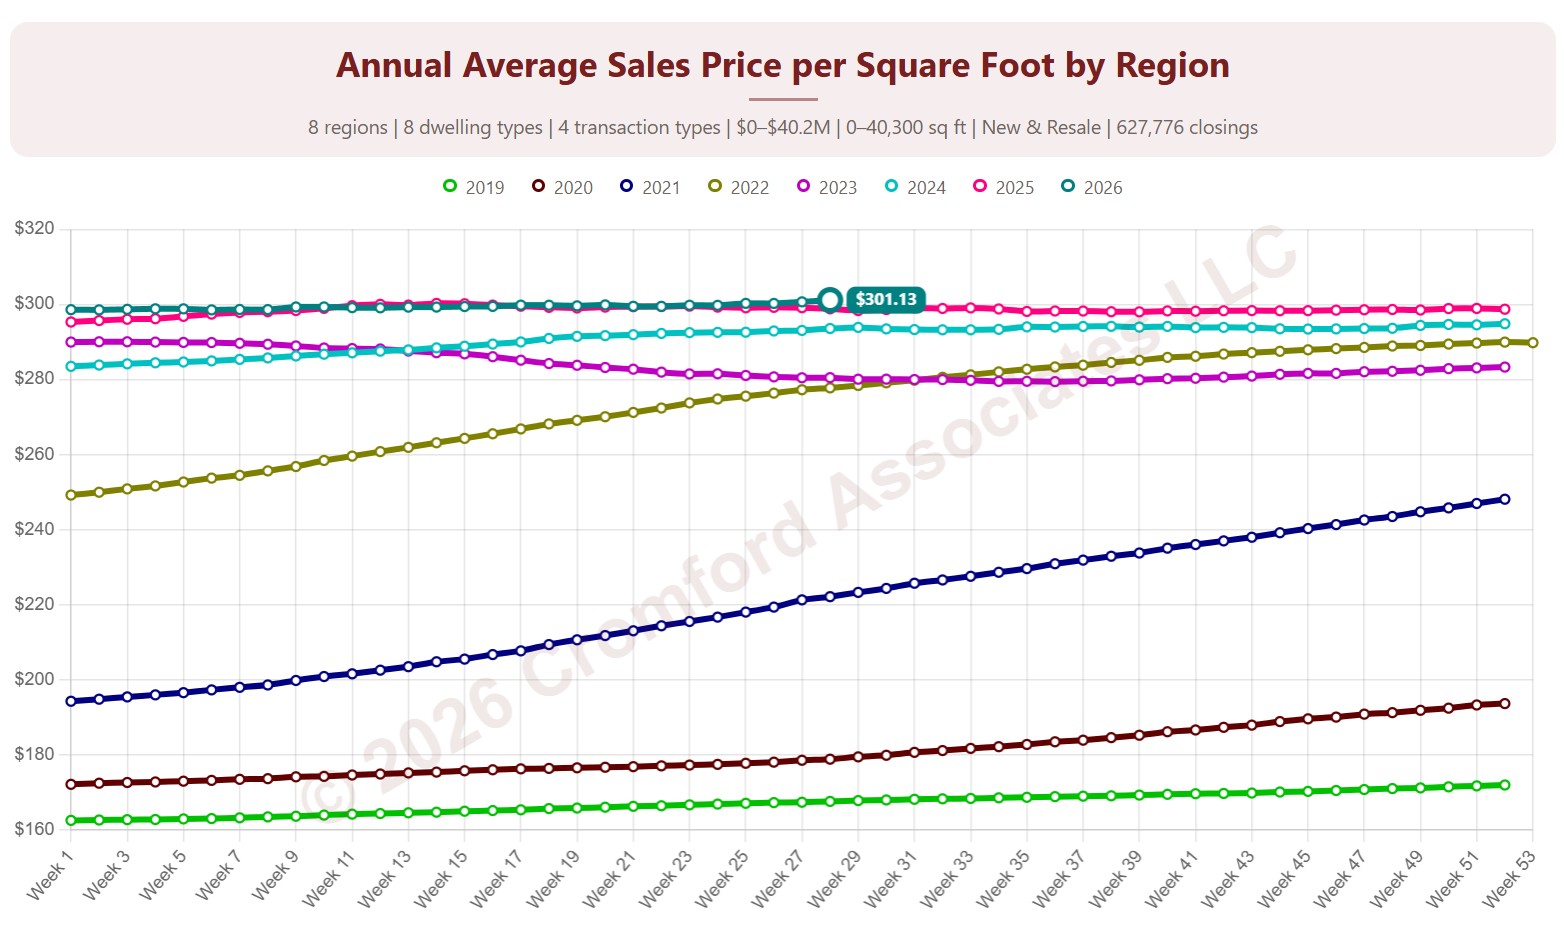
Annual Average Sales Price per Square Foot by Region

About this chart

This chart shows the average sales price per square foot of homes that closed through ARMLS, measured every week. Each point covers the homes that closed in the 12 months up to that week. Price per square foot lets you compare homes of different sizes; this is the true average across all the square feet sold.

Each year has its own line, laid out by week of the year, so you can compare this year with earlier years at the same point in the season. It opens on the last three years; tick any year back to 2001 in the Year panel.

It opens with every region included. Use the Region panel to focus on one region or compare a combination of them. Narrow it with the Dwelling Type, Transaction Type, and New / Resale boxes and the sales price, home size, and year built sliders. The Inflation (CPI) option restates prices in today’s dollars using national or Phoenix inflation.

Hover over a line to see the exact figure for that week.
Quarterly Average Price per Square Foot by Region

About this chart

This chart shows the average sales price per square foot of homes that closed through ARMLS, measured every week. Each point covers the homes that closed in the three months up to that week. Price per square foot lets you compare homes of different sizes; this is the true average across all the square feet sold.

Each year has its own line, laid out by week of the year, so you can compare this year with earlier years at the same point in the season. It opens on the last three years; tick any year back to 2001 in the Year panel.

It opens with every region included. Use the Region panel to focus on one region or compare a combination of them. Narrow it with the Dwelling Type, Transaction Type, and New / Resale boxes and the sales price, home size, and year built sliders. The Inflation (CPI) option restates prices in today’s dollars using national or Phoenix inflation.

Hover over a line to see the exact figure for that week.
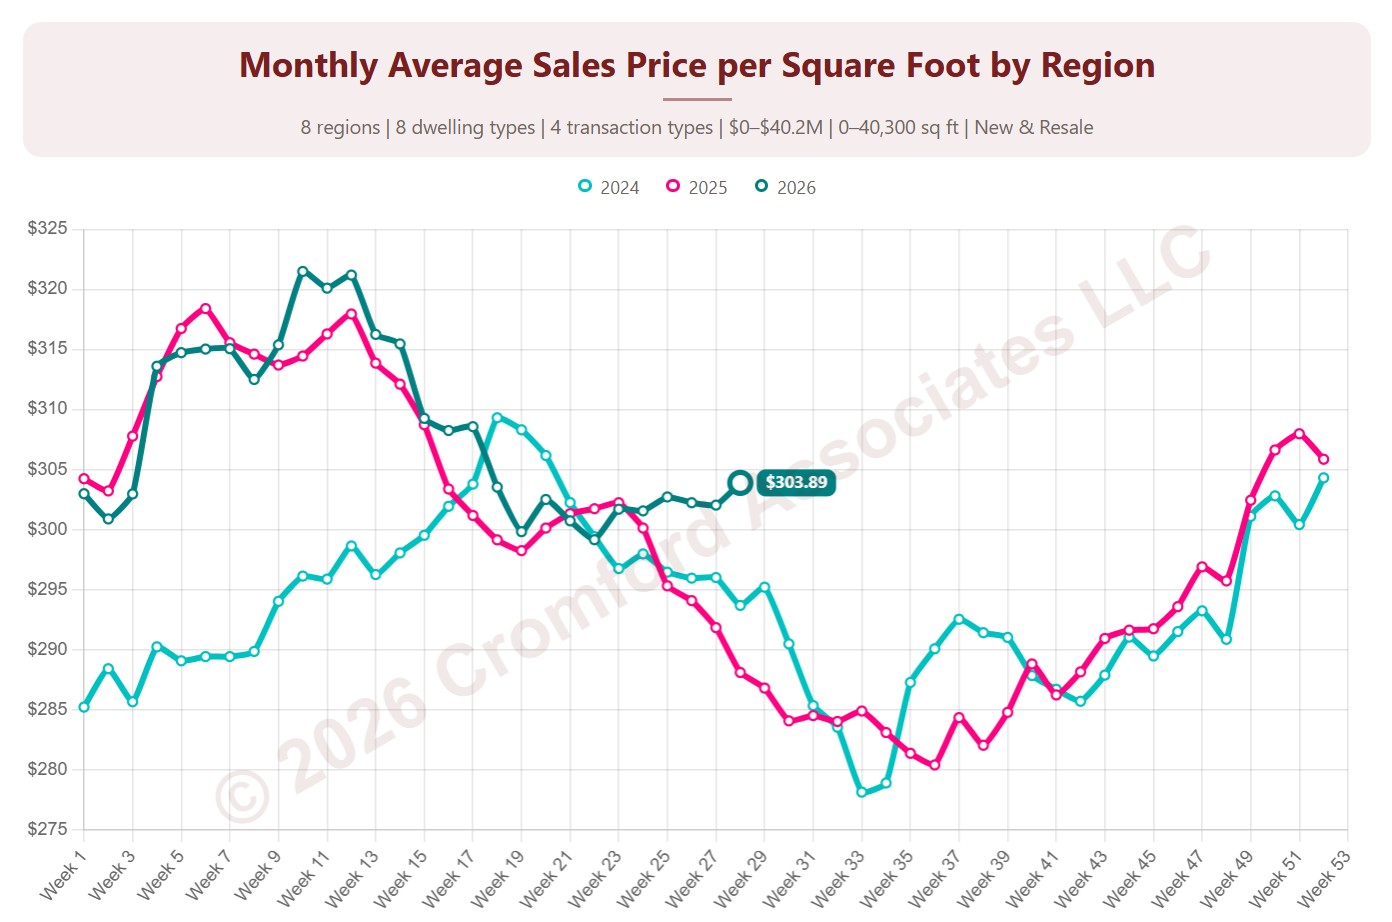
Monthly Average Sales Price per Square Foot by Region

About this chart

This chart shows the average sales price per square foot of homes that closed through ARMLS, measured every week. Each point covers the homes that closed in the month up to that week. Price per square foot lets you compare homes of different sizes; this is the true average across all the square feet sold.

Each year has its own line, laid out by week of the year, so you can compare this year with earlier years at the same point in the season. It opens on the last three years; tick any year back to 2001 in the Year panel.

It opens with every region included. Use the Region panel to focus on one region or compare a combination of them. Narrow it with the Dwelling Type, Transaction Type, and New / Resale boxes and the sales price, home size, and year built sliders. The Inflation (CPI) option restates prices in today’s dollars using national or Phoenix inflation.

Hover over a line to see the exact figure for that week.
Contract Ratio by Region

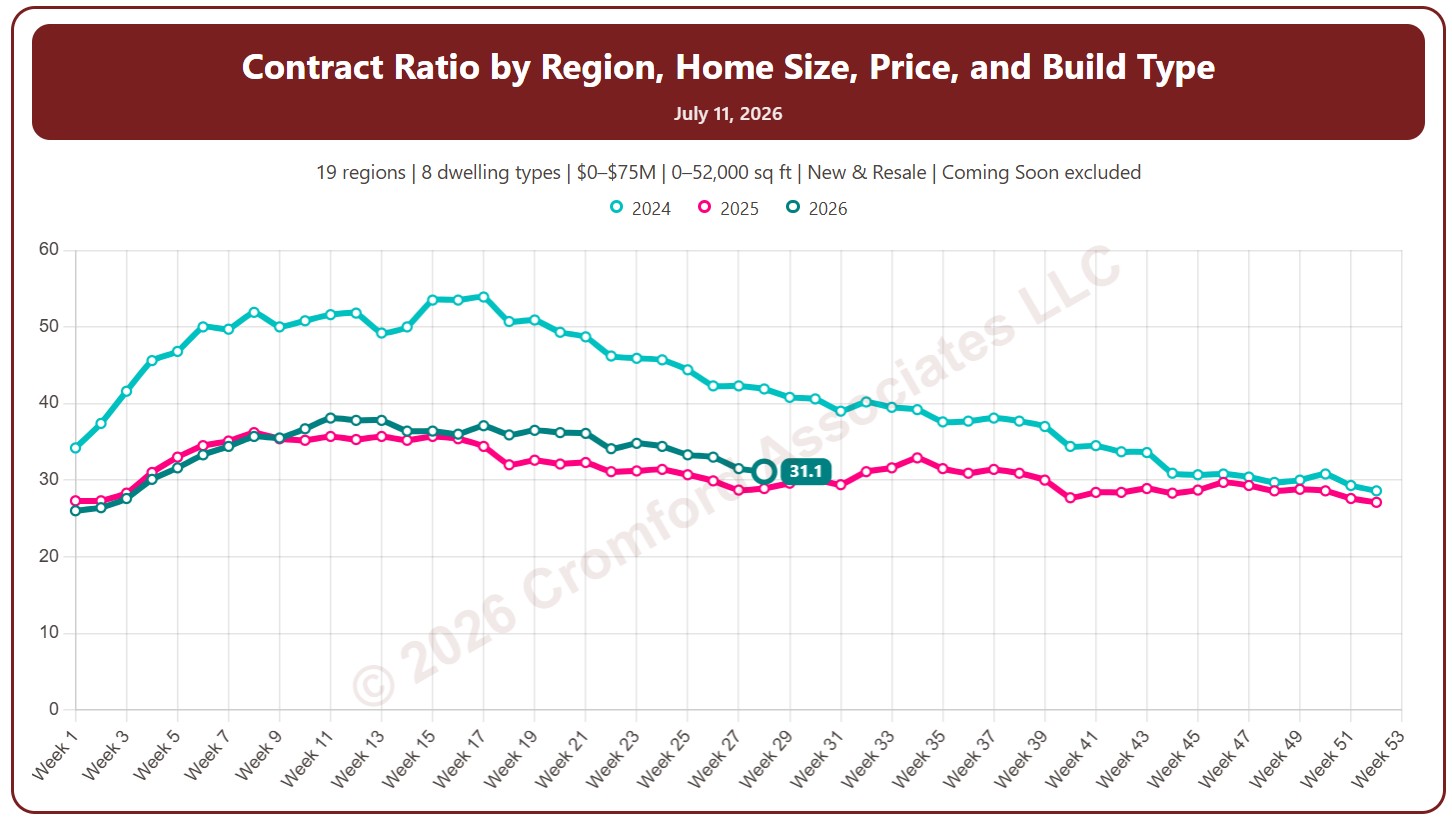
About this chart

This chart shows the contract ratio, measured every week (on Saturdays). It compares the listings under contract with the active listings available. The higher the ratio, the stronger buying activity is relative to supply: a rising ratio is good news for sellers, a falling one for buyers.

Coming Soon listings are left out by default; tick Count Coming Soon as Active to include them.

Each year has its own line, laid out by week of the year, so you can compare this year with earlier years at the same point in the season. It opens on the last three years; tick any year back to 2011 in the Year panel.

It opens with every region included. Use the Region panel to focus on one region or compare a combination of them. Narrow it with the Dwelling Type and New / Resale boxes and the list price and home size sliders.

Hover over a line to see the exact figure for that week.
Active Listings by Region

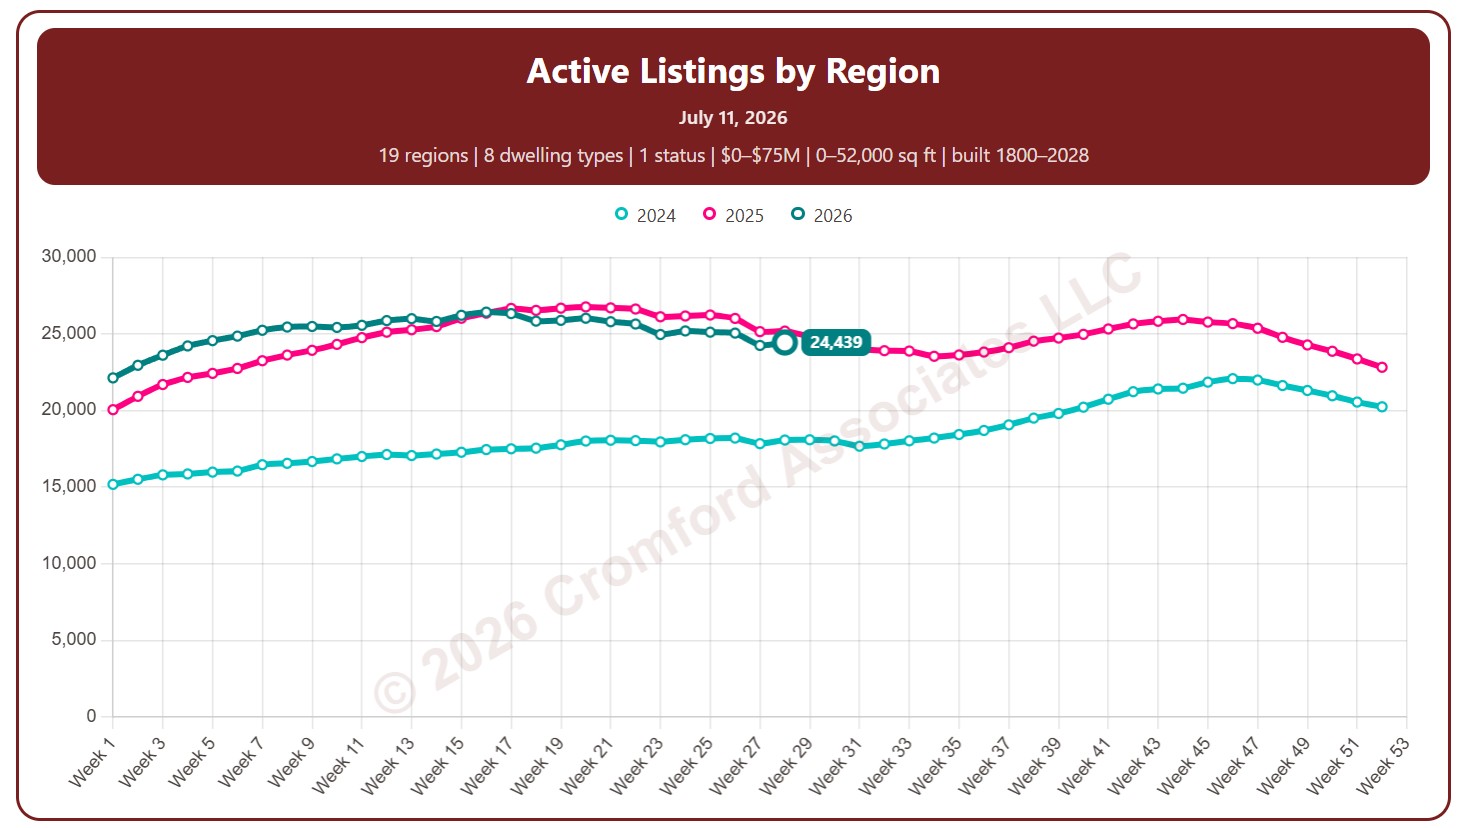
About this chart

This chart counts the homes listed for sale on ARMLS, measured every week (on Saturdays).

By default it counts Active listings. Tick Coming Soon, UCB / CCBS (under contract but still accepting back-up offers), or Temp Off Market in the List Status panel to include them.

Each year has its own line, laid out by week of the year, so you can compare this year with earlier years at the same point in the season. It opens on the last three years; tick any year back to 2011 in the Year panel.

It opens with every region included. Use the Region panel to focus on one region or compare a combination of them. Narrow it with the Dwelling Type, List Status, Transaction Type, and New / Resale boxes and the list price, home size, year built, and days on market sliders.

Rising inventory gives buyers more choice and more negotiating power; falling inventory favors sellers. Hover over a line to see the exact figure for that week.
Notes:

  • This chart excludes listings for homes that are located outside Arizona

Active Listings by City and ZIP Code

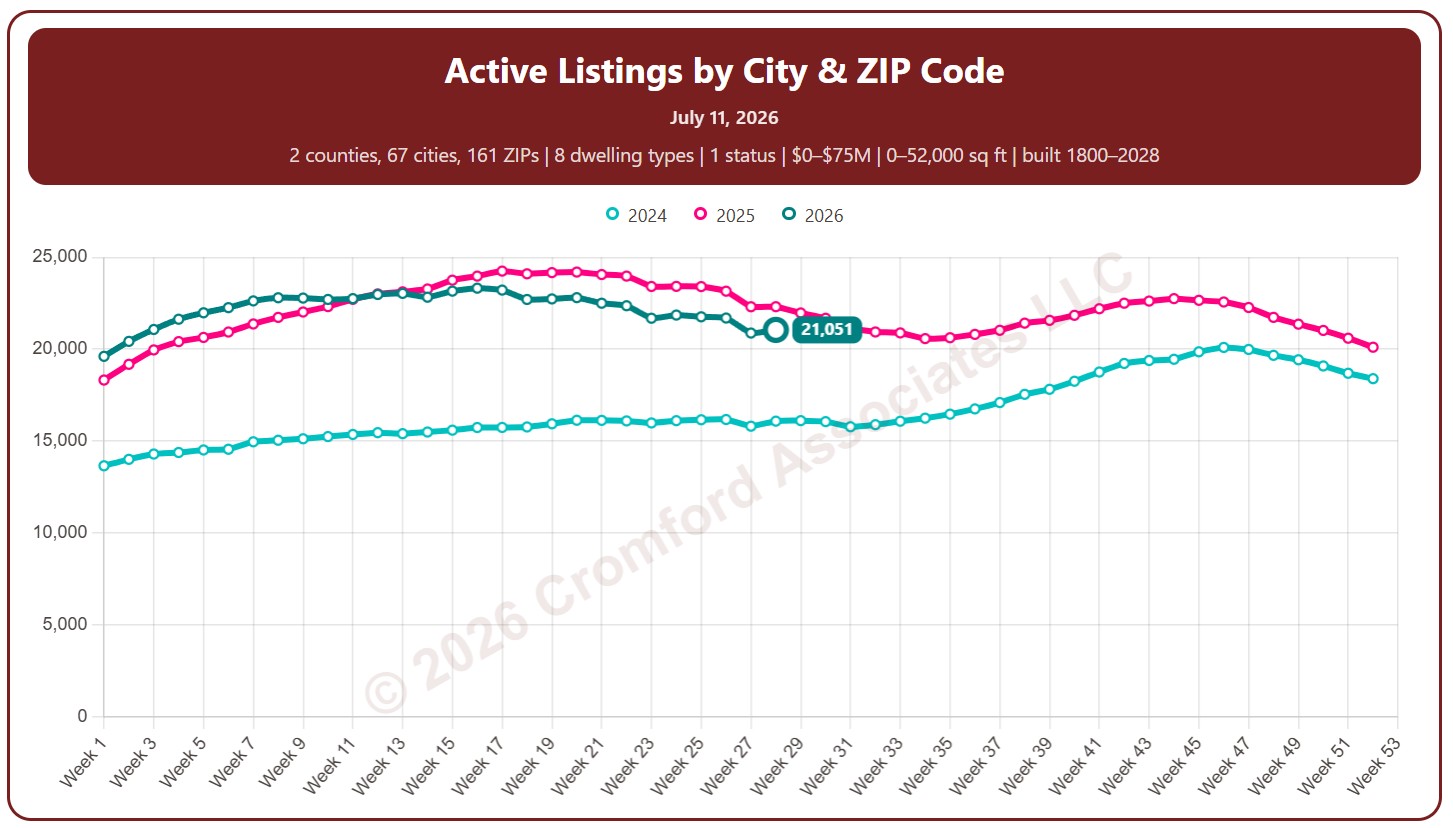
About this chart

This chart counts the homes listed for sale on ARMLS, measured every week (on Saturdays).

By default it counts Active listings. Tick Coming Soon, UCB / CCBS (under contract but still accepting back-up offers), or Temp Off Market in the List Status panel to include them.

Each year has its own line, laid out by week of the year, so you can compare this year with earlier years at the same point in the season. It opens on the last three years; tick any year back to 2011 in the Year panel.

It opens on Maricopa and Pinal Counties with every city and ZIP code included. Use the County, City, and ZIP panels to focus on any area, from a whole county down to a single ZIP code. Narrow it with the Dwelling Type, List Status, Transaction Type, and New / Resale boxes and the list price, home size, year built, and days on market sliders.

Rising inventory gives buyers more choice and more negotiating power; falling inventory favors sellers. Hover over a line to see the exact figure for that week.
Active Listings Map

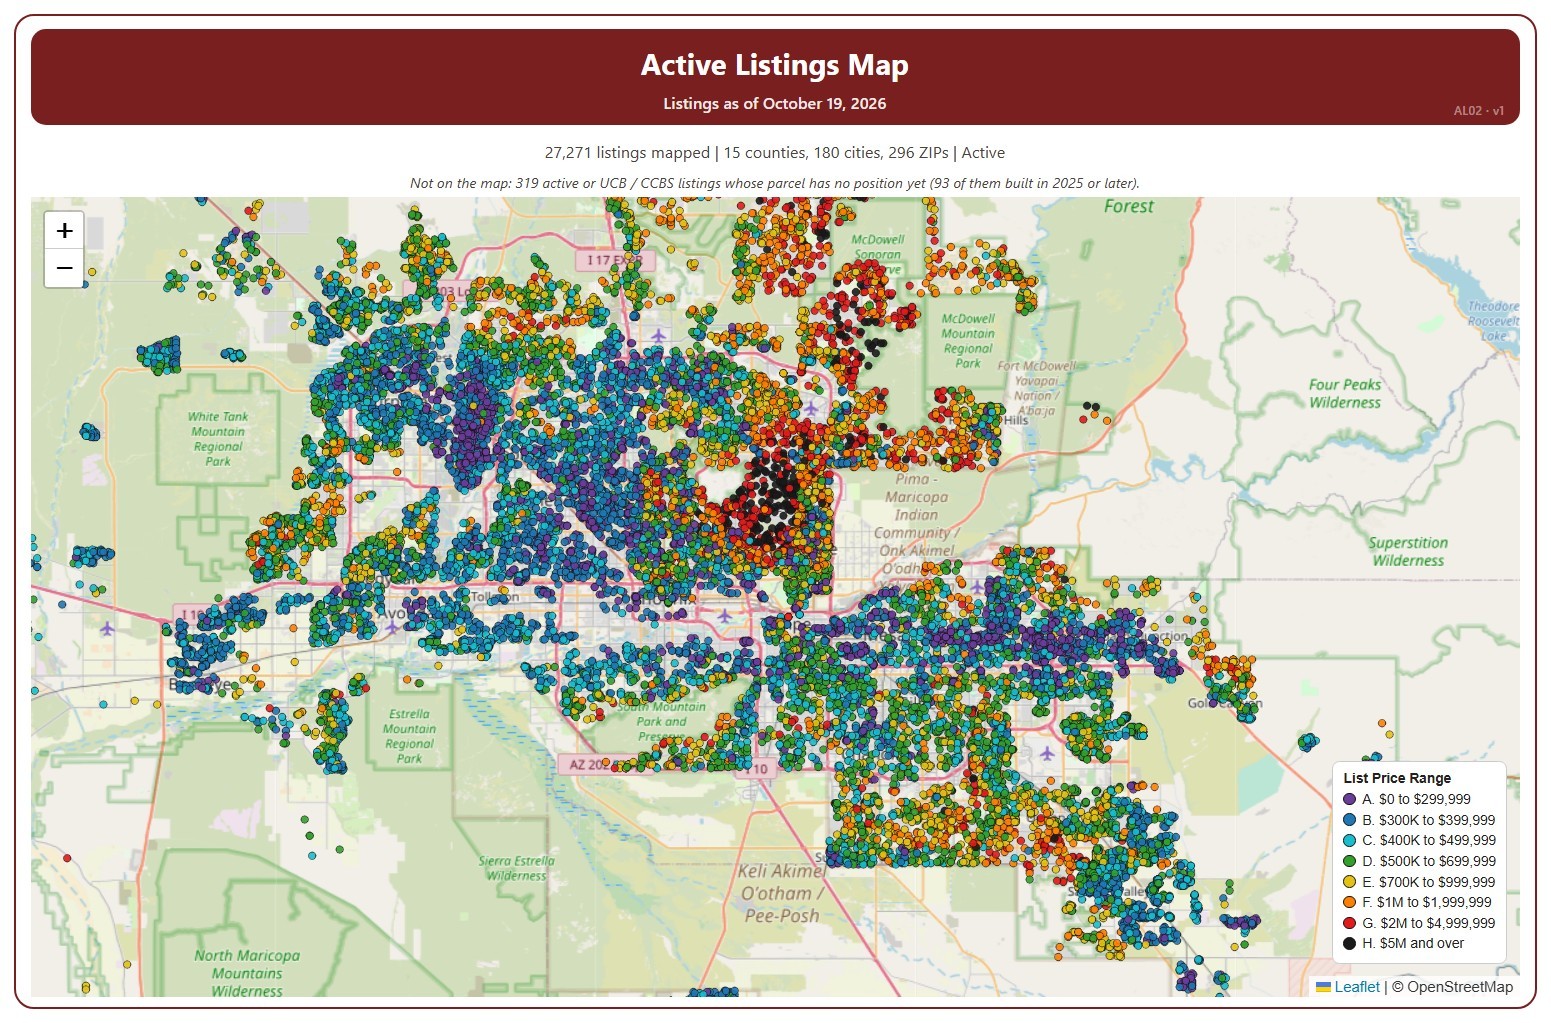
About this chart

This map shows every home listed for sale or coming soon on ARMLS across Arizona today, one dot per listing, coloured by its list price range, from A (under $300,000) to H ($5 million and over).

It opens on Active and Coming Soon listings in every county; tick UCB / CCBS in the Status box to add listings under contract with a contingency. Tick or untick counties, cities, and ZIP codes to change the area, and use the Price Range boxes to show or hide a range. The map is updated every day.

Narrow it further with the Dwelling Type, Transaction Type, and New / Resale boxes and the list price, home size, year built, and days on market sliders. A listing whose parcel has no map position yet is not shown; the note above the map says how many.

Hover over a dot to see the address, list price, status, dwelling and transaction type, size, year built, days on market, and listing office.

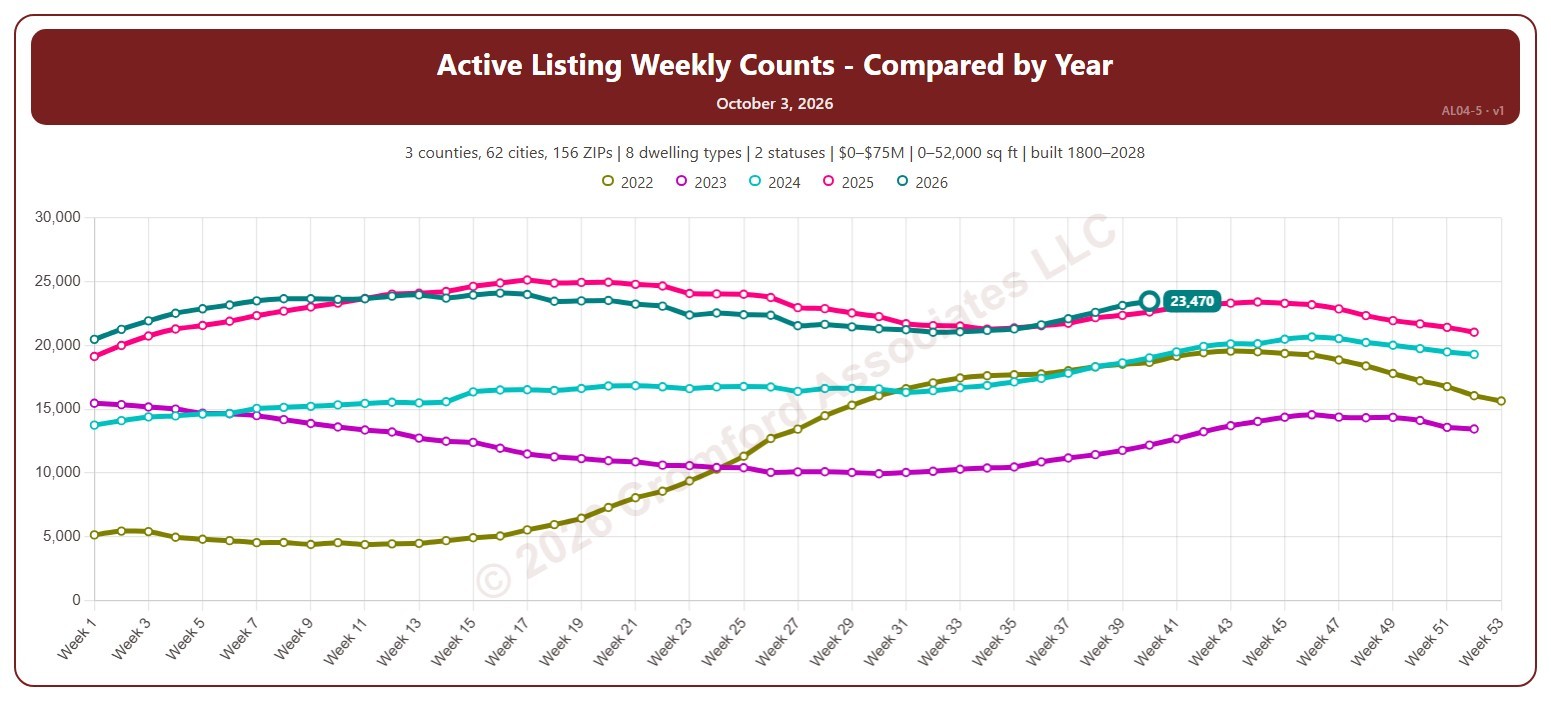
Active Listing Weekly Counts – Compared by Year

About this chart

This chart counts the homes listed for sale on ARMLS each week (on Saturdays), with one line per year laid out by week of the year, so you can compare this year with earlier years at the same point in the season.

By default it counts Active and Coming Soon listings; tick UCB / CCBS (under contract but still accepting back-up offers) or Temp Off Market in the List Status panel to include them. It opens on the last five years; tick any year back to 2011 in the Year panel.

It opens on the Greater Phoenix area: the counties, cities, and ZIP codes that make it up are ticked to start with. Tick or untick any of them to change the area, including counties beyond Greater Phoenix. Narrow it further with the Dwelling Type, List Status, Transaction Type, and New / Resale boxes and the list price, home size, year built, and days on market sliders.

Hover over the chart to see the figures for that week.