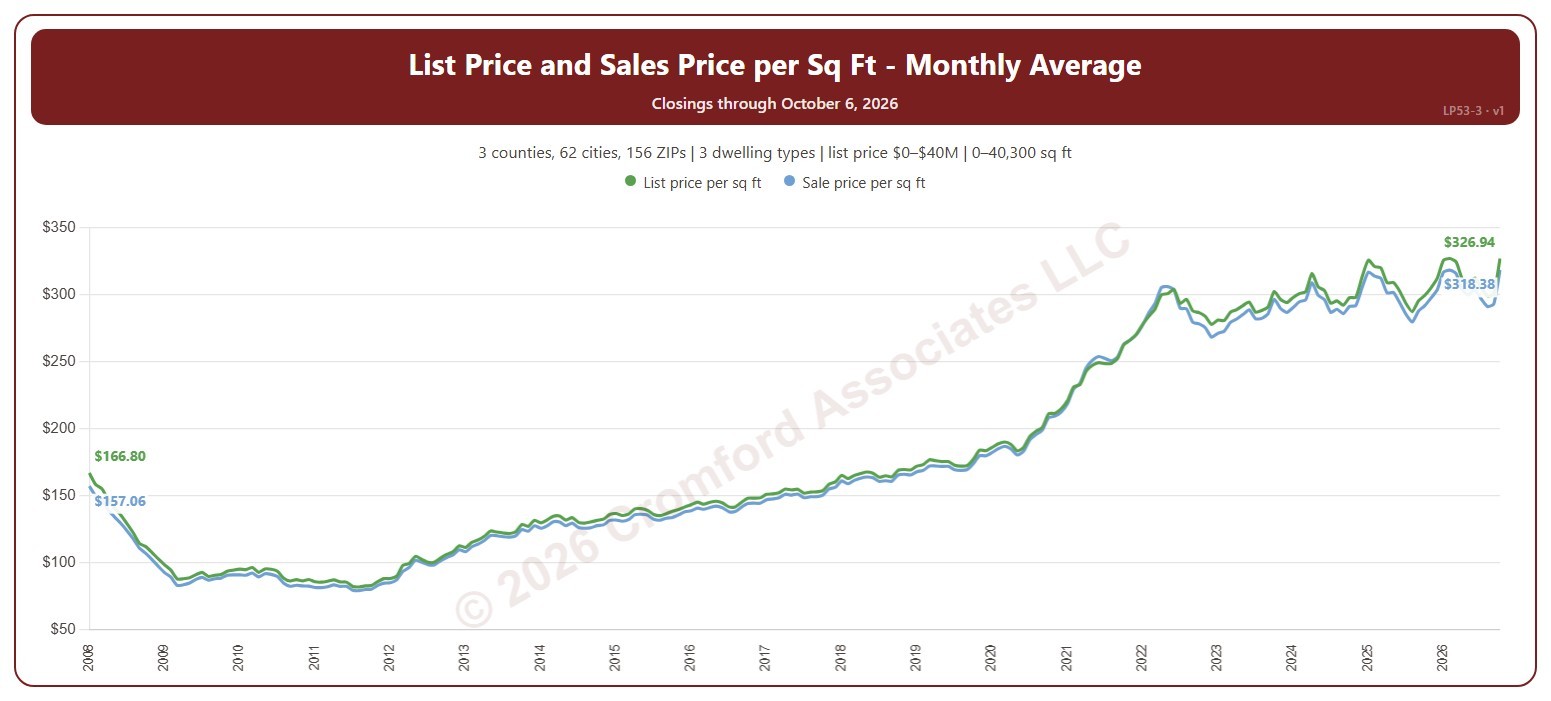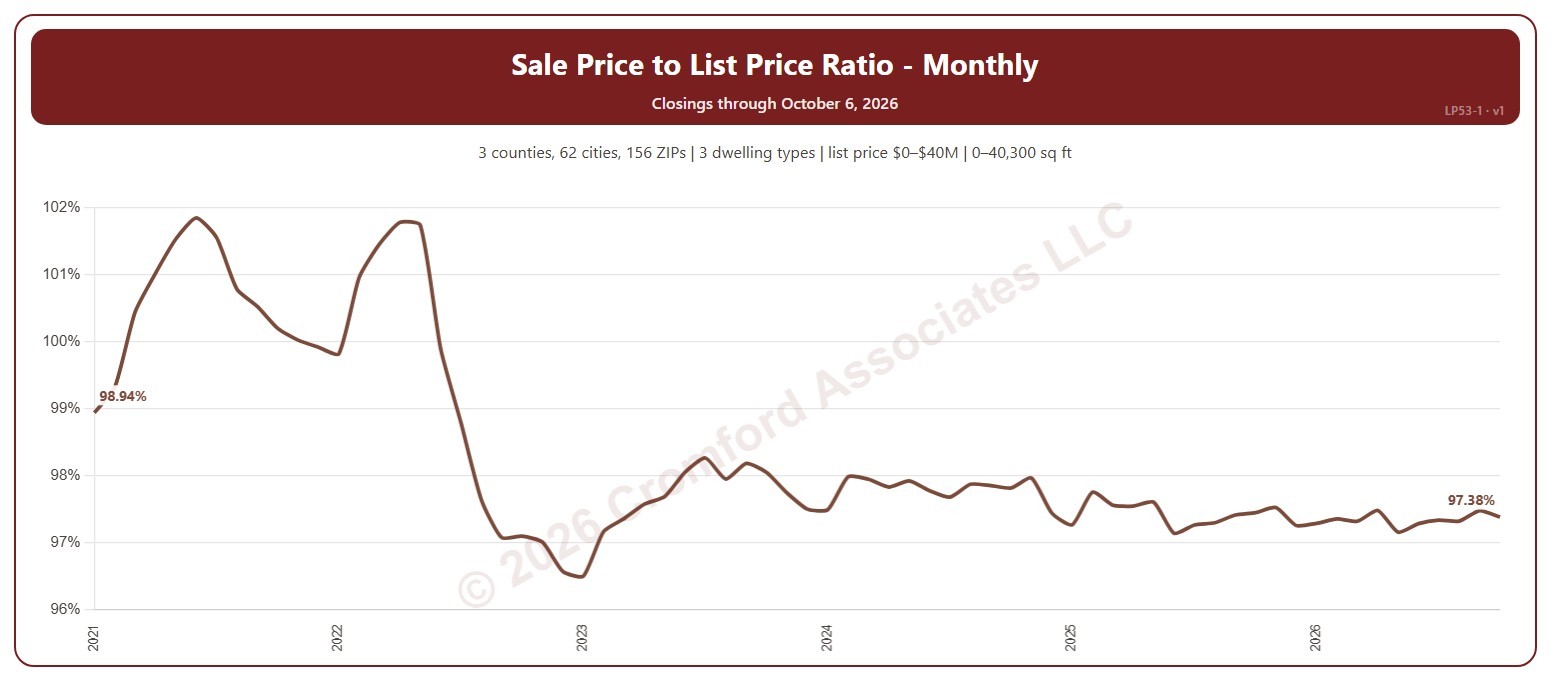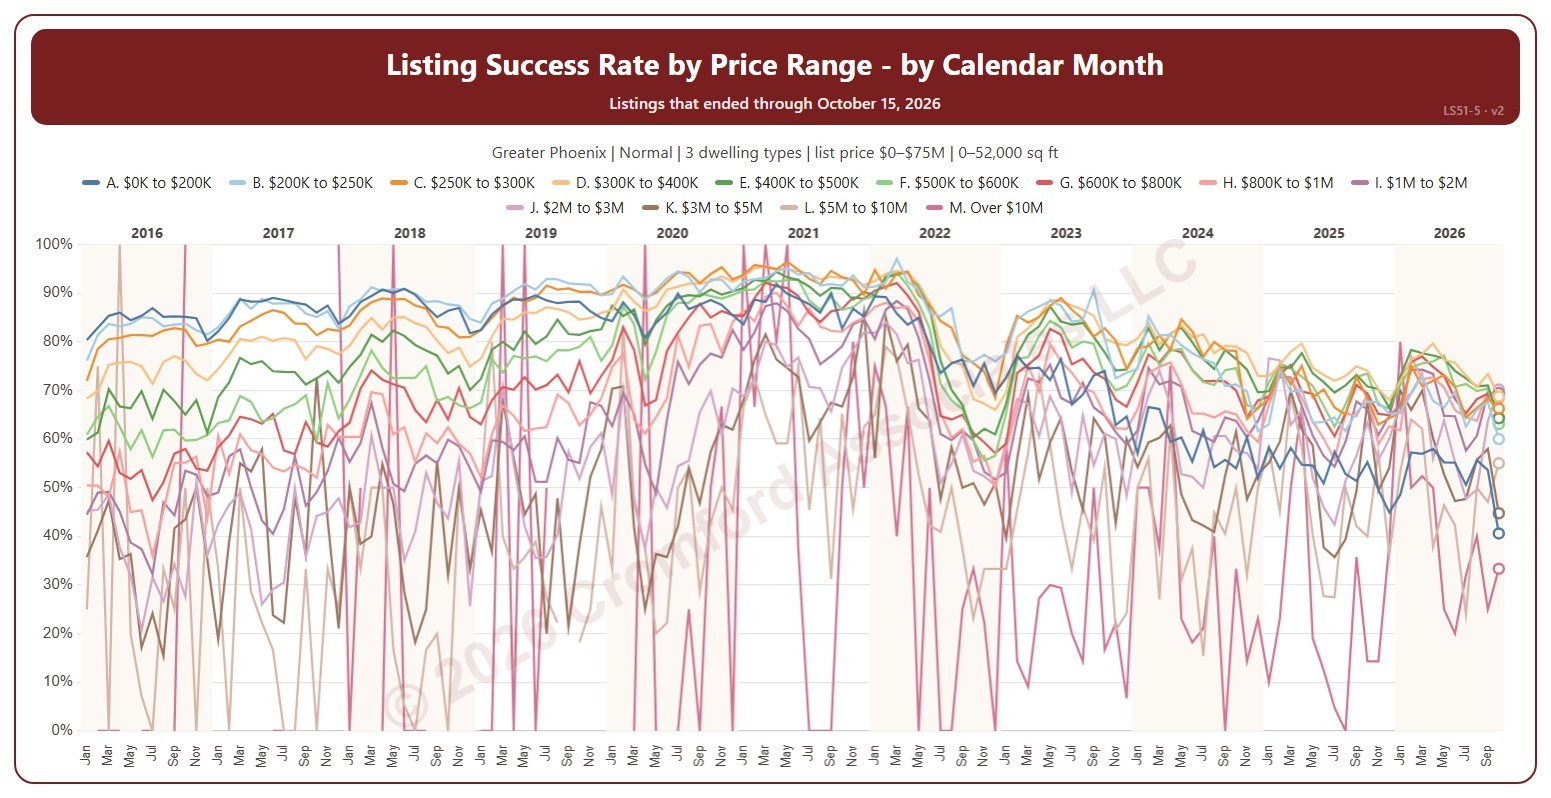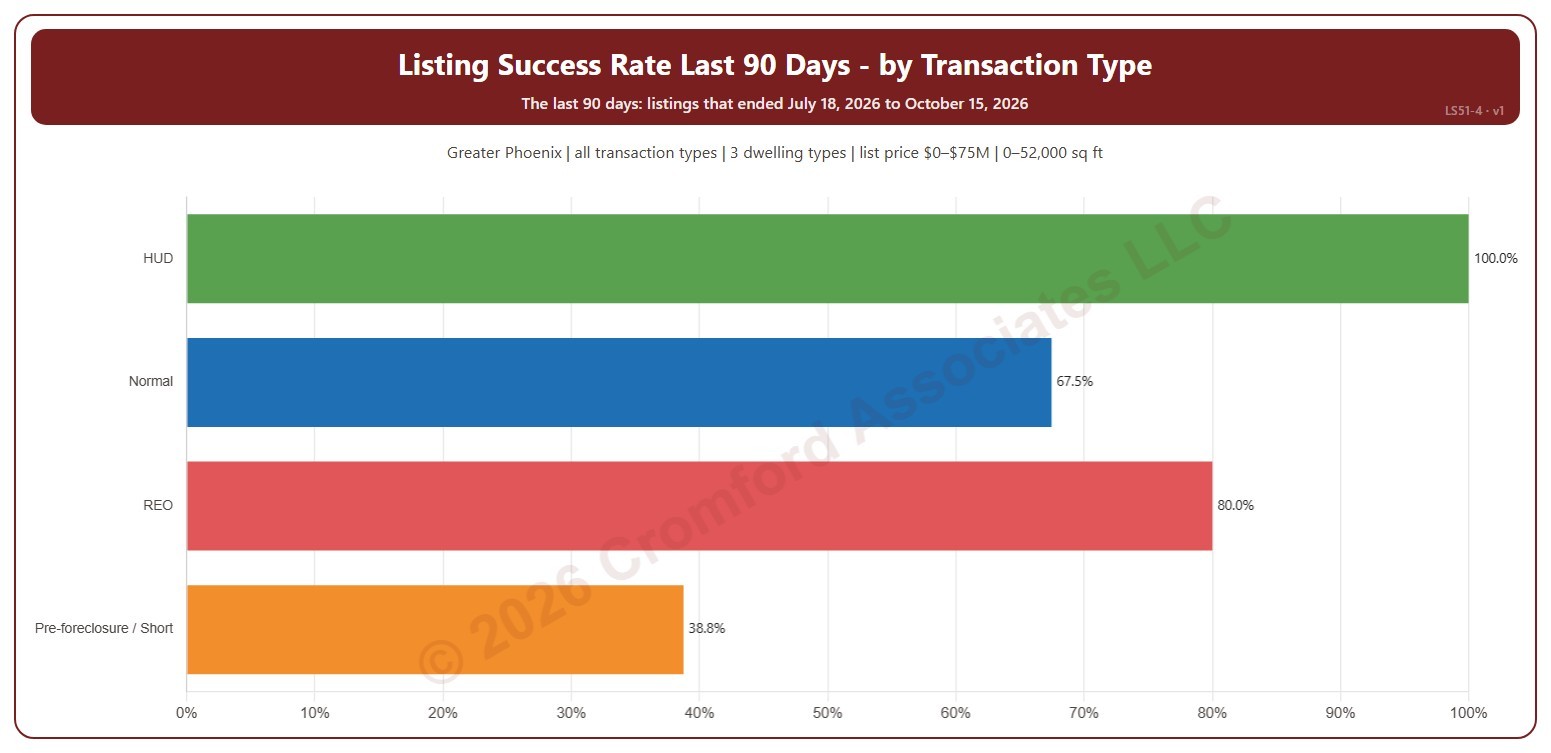
About this chart
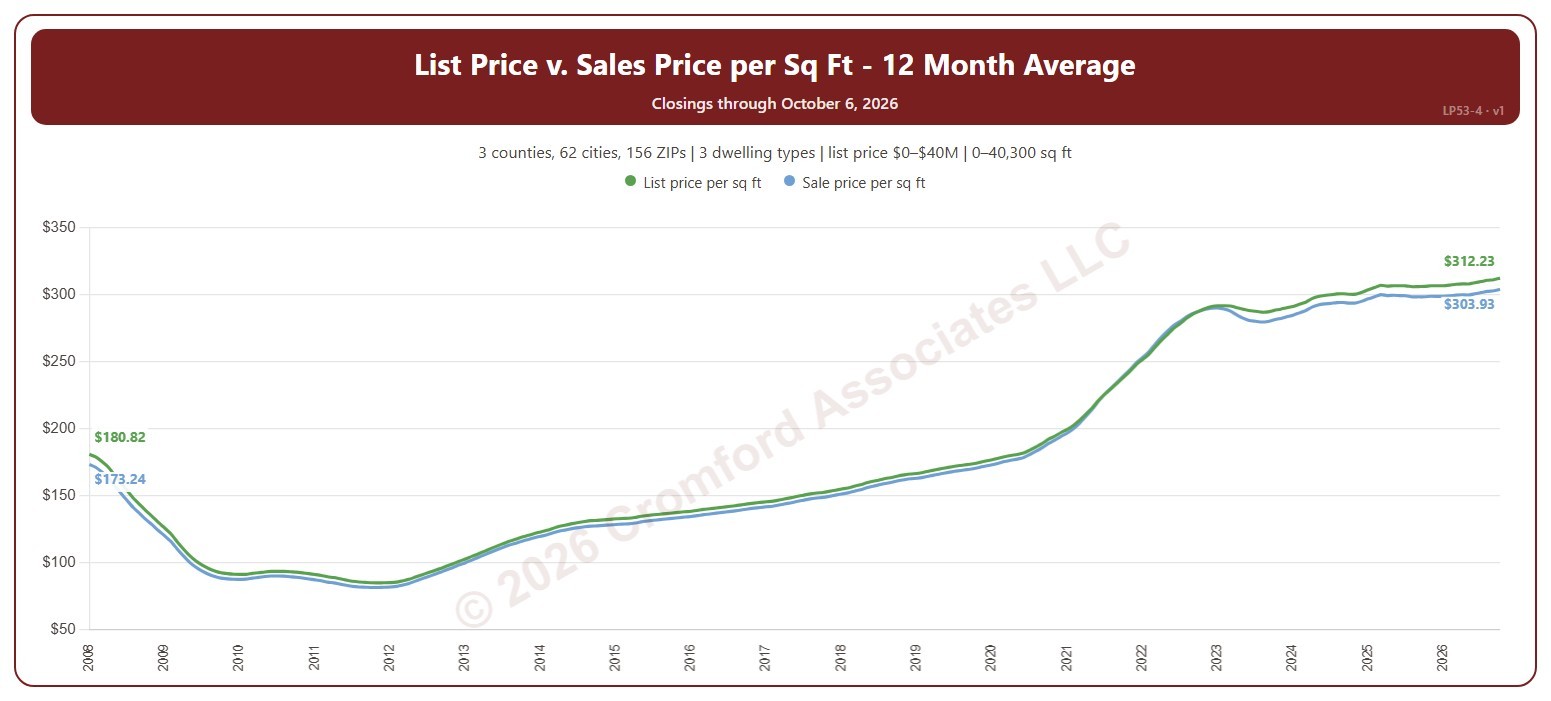
This chart shows two lines for the homes that closed through ARMLS: the list price per square foot and the sale price per square foot, over the 12 months ending with each month. The gap between them shows how far below (or above) their asking price homes are selling. Averaging over a year smooths out the seasonal swings.
It opens on the years since 2008; tick any year back to 2000 in the Year panel. The newest month is the month so far.
It opens on the Greater Phoenix area: the counties, cities, and ZIP codes that make it up are ticked to start with. Tick or untick any of them to change the area, including counties beyond Greater Phoenix. Narrow it further with the Dwelling Type (condo, mobile, single family), Transaction Type, and New / Resale boxes and the list price, home size, and year built sliders.
Hover over the chart to see the figures for that month.