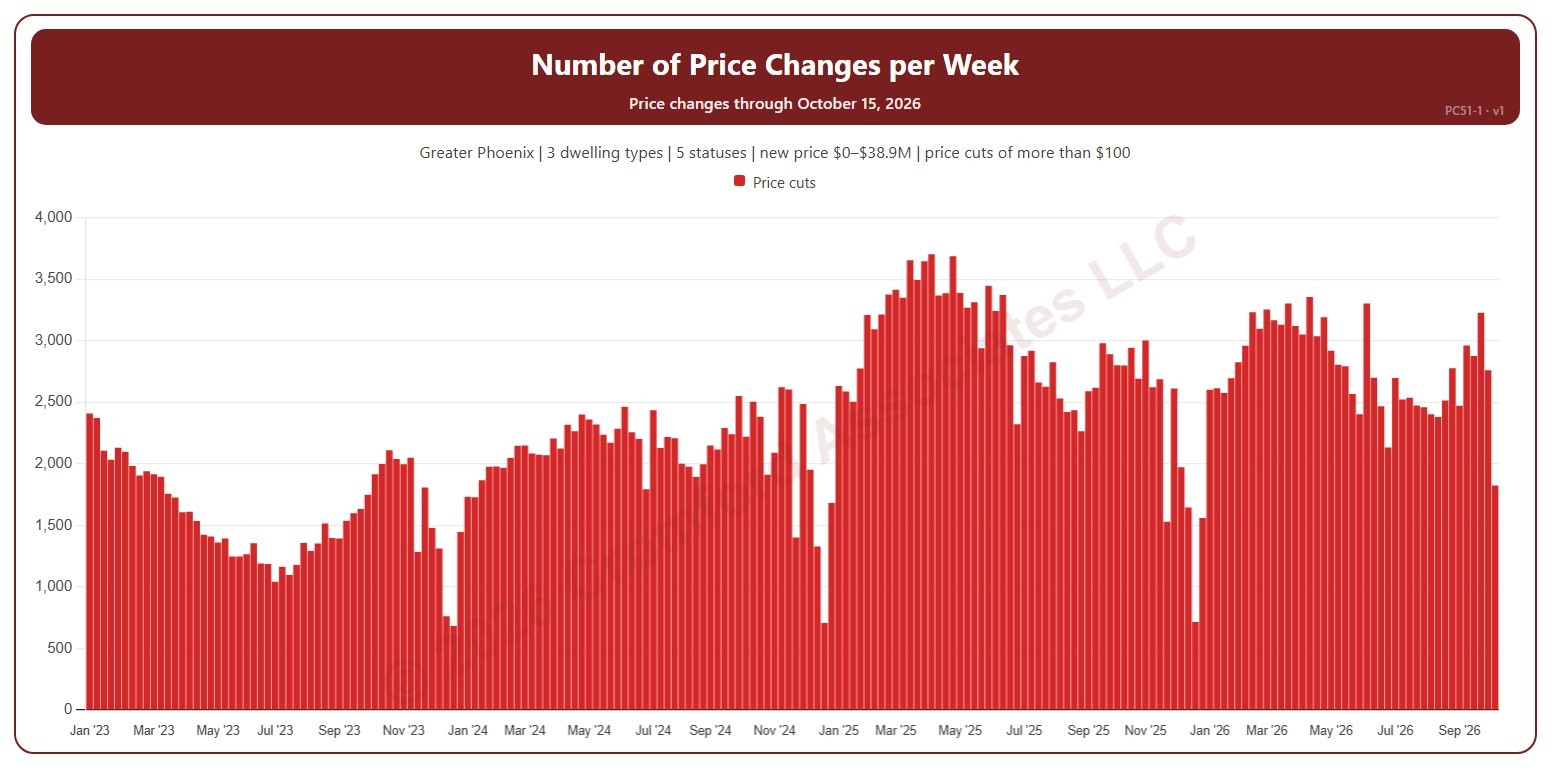
Number of Price Changes per Week

About this chart

This chart shows the number of list price changes each week. It counts changes to a listing’s list price on ARMLS, using the new price for the price filter. A change counts only when it is more than the amount in the Price Change panel ($100 to start with). Use the Price Change panel to show price cuts (the opening view), price increases, or both.

Weeks run Sunday to Saturday. It opens on January three years back to date; drag the handles of the date slider under the chart to choose the weeks shown, as far back as January 2013. The newest week is the week so far. The chart is updated every week.

It opens on the Greater Phoenix area: the counties, cities, and ZIP codes that make it up are ticked to start with. Tick or untick any of them to change the area, including counties beyond Greater Phoenix. Narrow it further with the Dwelling Type, List Status, Transaction Type, and New / Resale boxes and the new list price, home size, and year built sliders.

Hover over a bar to see the week’s dates and the count.
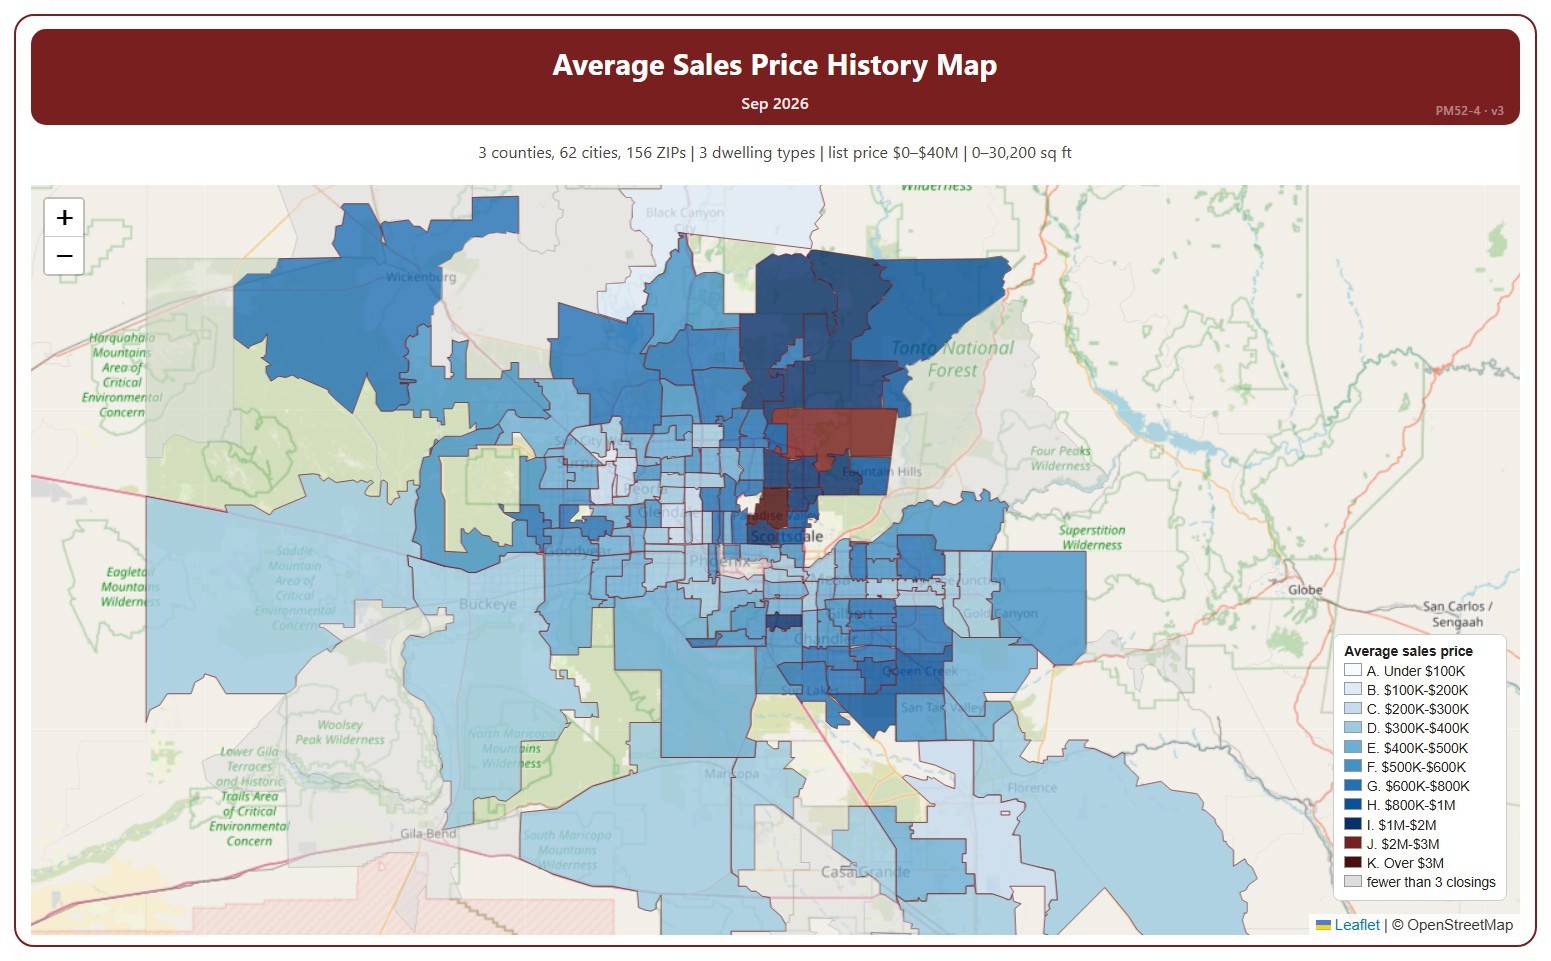
Average Sales Price History Map

About this chart

This map shades each ZIP code by the average sale price of the homes that closed in one month, in price ranges from under $100K to over $3M.

It opens on the latest complete month. Use the Month panel, or its arrows, to step back through earlier months as far as 2008. ZIP codes with fewer than 3 closings in the month are shown in grey.

It opens on the Greater Phoenix area: the counties, cities, and ZIP codes that make it up are ticked to start with. Tick or untick any of them to change the area, including counties beyond Greater Phoenix. Narrow it further with the Dwelling Type, Transaction Type, and New / Resale boxes and the list price, home size, and year built sliders.

Hover over a ZIP code to see its average price and number of closings.

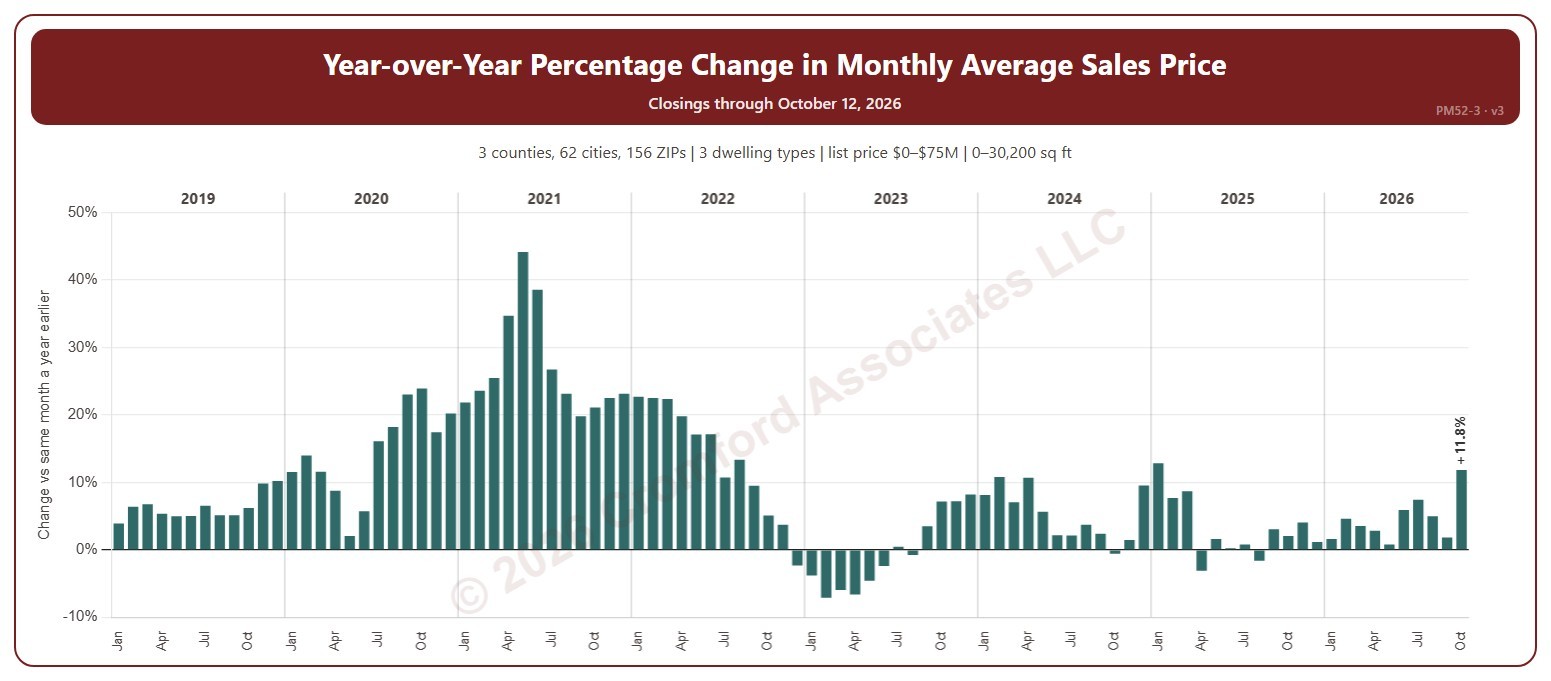
Year-over-Year Percentage Change in Monthly Average Sales Price

About this chart

This chart shows the year-over-year change in the average sale price: each month compared with the same month a year earlier, as a percentage. Above zero, prices are higher than a year ago; below zero, lower.

It opens on January 2019 to date; drag the handles of the date slider under the chart to choose the months shown. It goes back to January 2009. The list price slider runs up to $75 million. The newest month is the month so far.

It opens on the Greater Phoenix area: the counties, cities, and ZIP codes that make it up are ticked to start with. Tick or untick any of them to change the area, including counties beyond Greater Phoenix. Narrow it further with the Dwelling Type, Transaction Type, and New / Resale boxes and the list price, home size, and year built sliders.

Hover over a bar to see both months’ average prices and the number of closings.

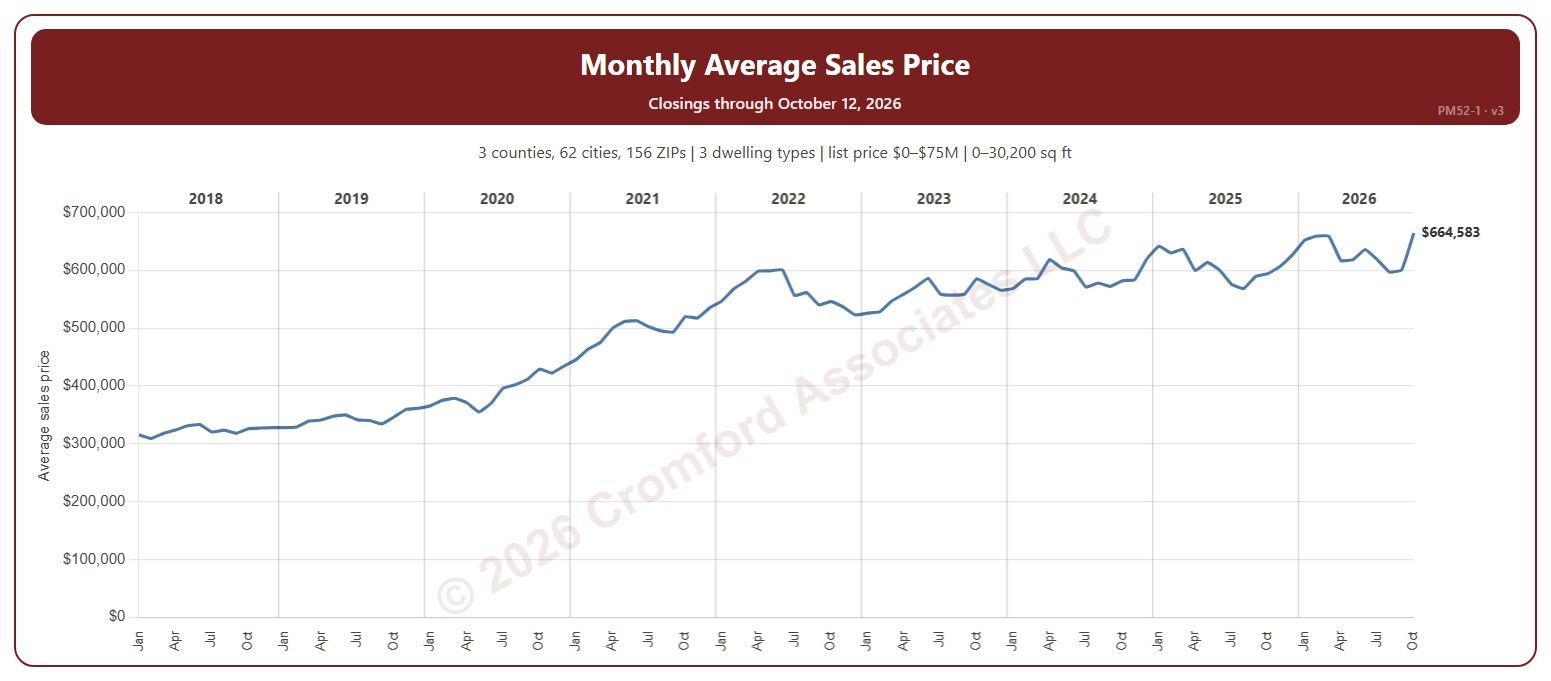
Monthly Average Sales Price

About this chart

This chart shows the average sale price of the homes that closed each month on ARMLS.

It opens on January 2018 to date; drag the handles of the date slider under the chart to choose the months shown. It goes back to January 2008. The list price slider runs up to $75 million. The newest month is the month so far.

It opens on the Greater Phoenix area: the counties, cities, and ZIP codes that make it up are ticked to start with. Tick or untick any of them to change the area, including counties beyond Greater Phoenix. Narrow it further with the Dwelling Type, Transaction Type, and New / Resale boxes and the list price, home size, and year built sliders.

Hover over the chart to see the figures for that month.

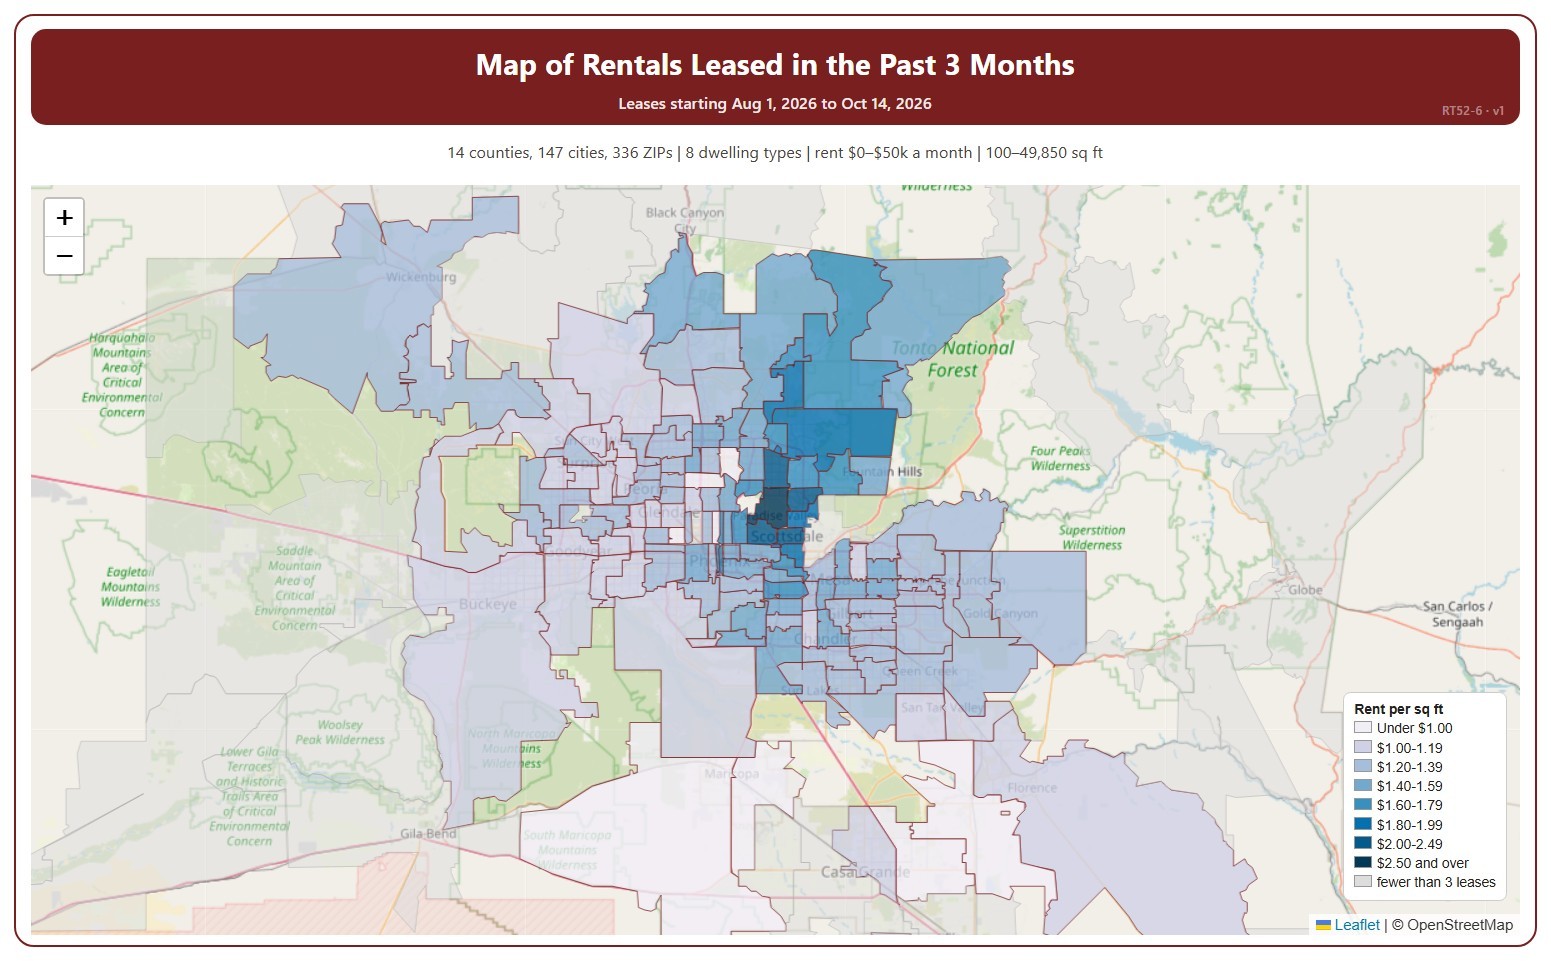
Map of Rentals Leased in Past 3 Months

About this chart

This map shades each ZIP code by the average monthly rent per square foot of recent leases, darker for a higher rent. It covers residential rentals leased through ARMLS, using the monthly rent each lease closed at, and places each lease in the month its tenancy starts.

It covers the last three calendar months up to the latest data; the heading shows the exact dates. The chart is updated every day. ZIP codes with fewer than 3 leases in the period are shown in grey.

It opens on every area in ARMLS; tick or untick counties, cities, and ZIP codes to narrow it. Narrow it further with the Dwelling Type and Furnished boxes and the monthly rent, home size, and year built sliders.

Hover over a ZIP code to see its rent per square foot, average rent, and number of leases.

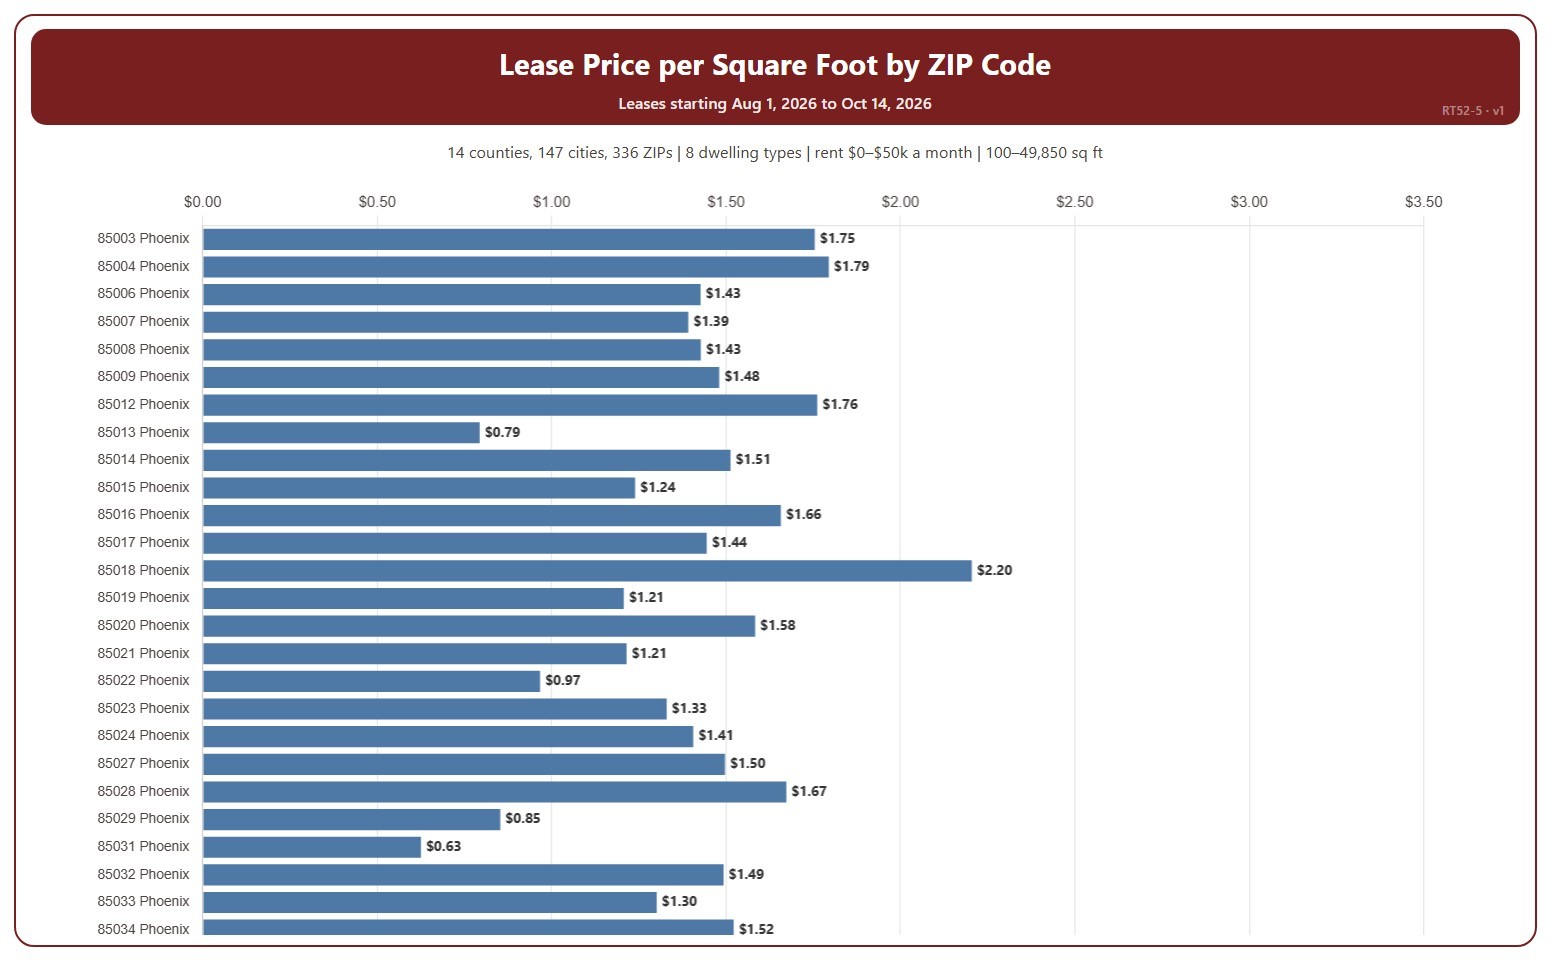
Lease Price by ZIP Code

About this chart

This chart shows the average monthly rent per square foot of recent leases in each ZIP code. It covers residential rentals leased through ARMLS, using the monthly rent each lease closed at, and places each lease in the month its tenancy starts.

It covers the last three calendar months up to the latest data; the heading shows the exact dates. The chart is updated every day. A ZIP code with only a few leases can be pulled up or down by a single home; the tooltip gives the number of leases. Scroll inside the chart to see every ZIP code.

It opens on every area in ARMLS; tick or untick counties, cities, and ZIP codes to narrow it. Narrow it further with the Dwelling Type and Furnished boxes and the monthly rent, home size, and year built sliders.

Hover over a bar to see the rent per square foot, the average rent, and the number of leases.

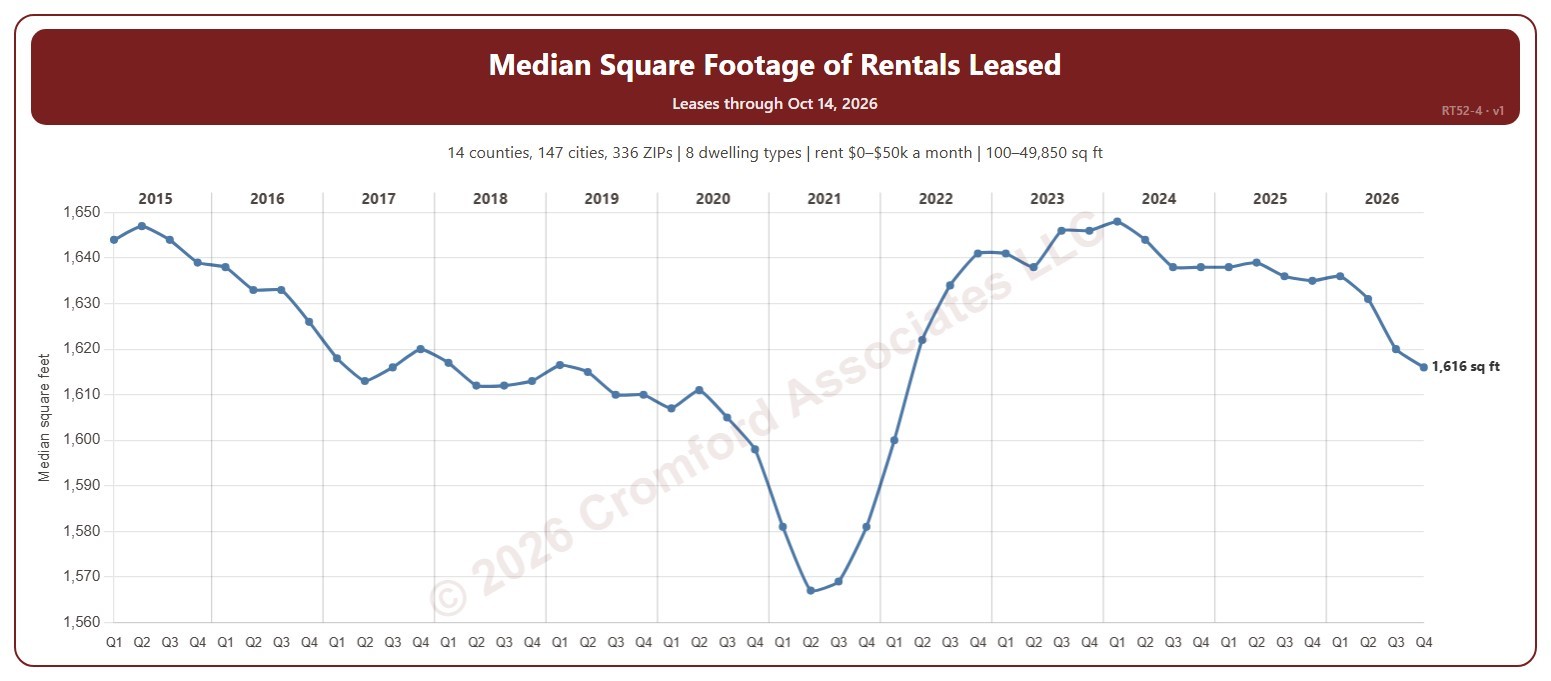
Median Square Foot of Rentals

About this chart

This chart shows the median size, in square feet, of the homes leased in the 12 months to the end of each quarter. Using a full year smooths out the seasons. It covers residential rentals leased through ARMLS, using the monthly rent each lease closed at, and places each lease in the month its tenancy starts.

It opens on 2015 to date; tick other years in the Year panel to go back as far as 2001.

It opens on every area in ARMLS; tick or untick counties, cities, and ZIP codes to narrow it. Narrow it further with the Dwelling Type and Furnished boxes and the monthly rent, home size, and year built sliders.

Hover over the chart to see the figures for that quarter.

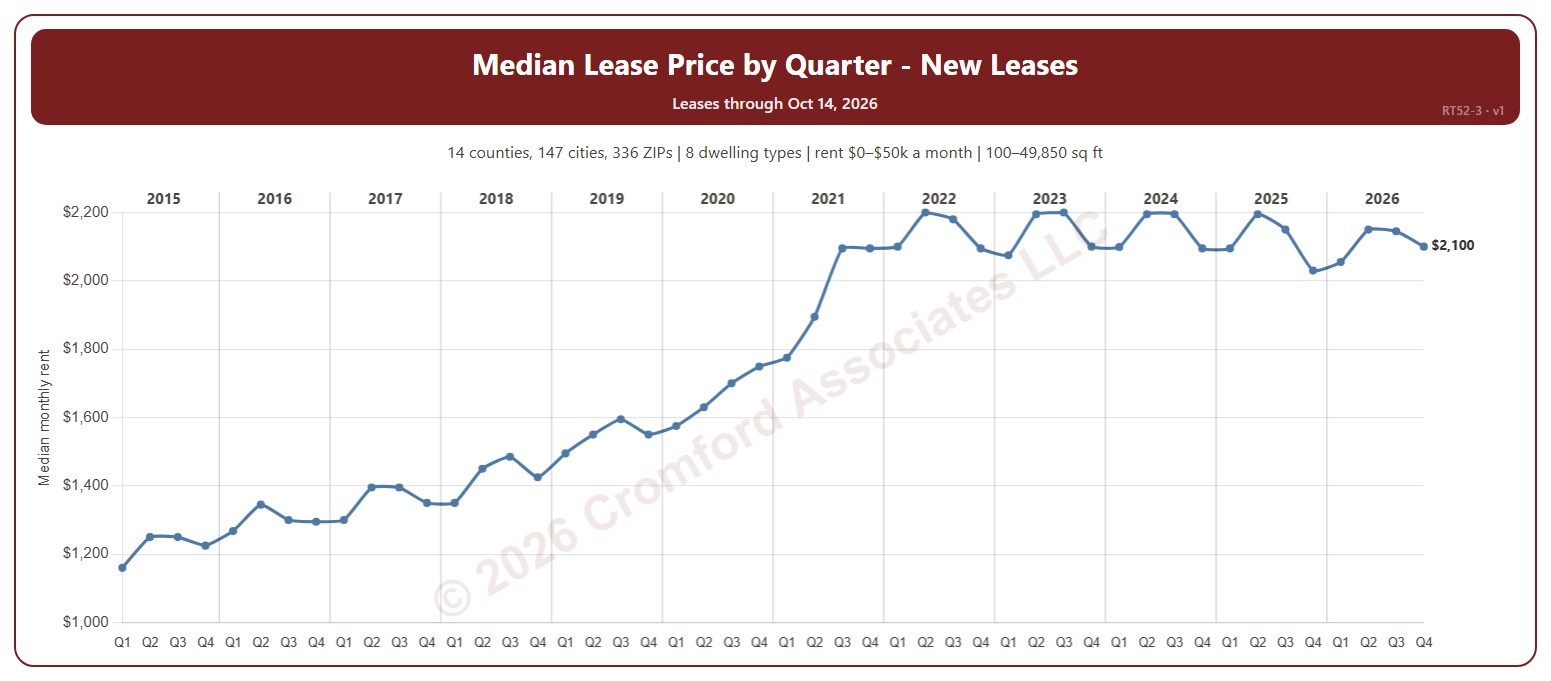
Median Lease Price by Quarter – New Leases

About this chart

This chart shows the median monthly rent of the homes leased each quarter. It covers residential rentals leased through ARMLS, using the monthly rent each lease closed at, and places each lease in the month its tenancy starts.

It opens on 2015 to date; tick other years in the Year panel to go back as far as 2001. The newest quarter is the quarter so far.

It opens on every area in ARMLS; tick or untick counties, cities, and ZIP codes to narrow it. Narrow it further with the Dwelling Type and Furnished boxes and the monthly rent, home size, and year built sliders.

Hover over the chart to see the figures for that quarter.

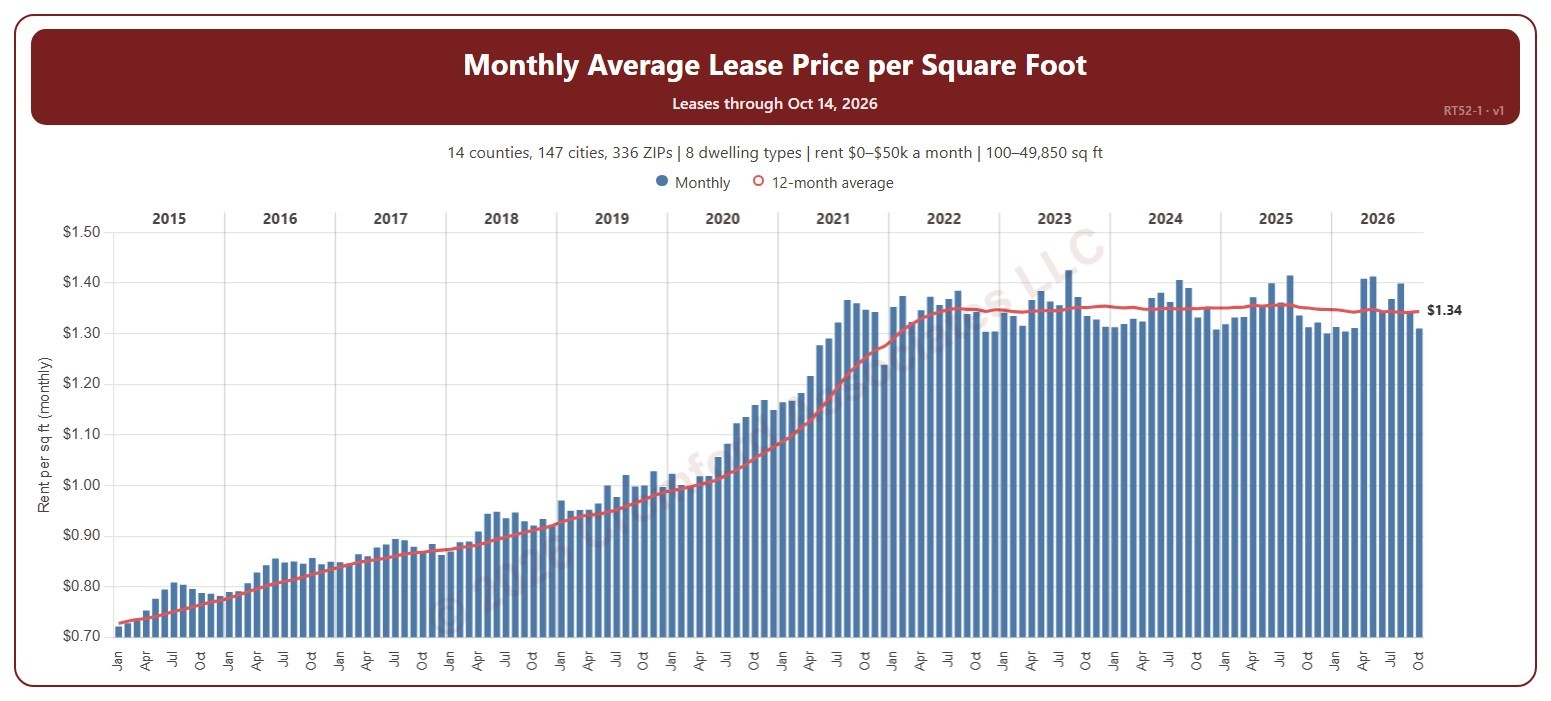
Monthly Average Lease Price per Square Foot

About this chart

This chart shows the average monthly rent per square foot of the homes leased each month (the bars) and the average over the last 12 months (the line). It covers residential rentals leased through ARMLS, using the monthly rent each lease closed at, and places each lease in the month its tenancy starts.

It opens on 2015 to date; tick other years in the Year panel to go back as far as 2001. The newest month is the month so far.

It opens on every area in ARMLS; tick or untick counties, cities, and ZIP codes to narrow it. Narrow it further with the Dwelling Type and Furnished boxes and the monthly rent, home size, and year built sliders.

Hover over the chart to see the figures for that month.

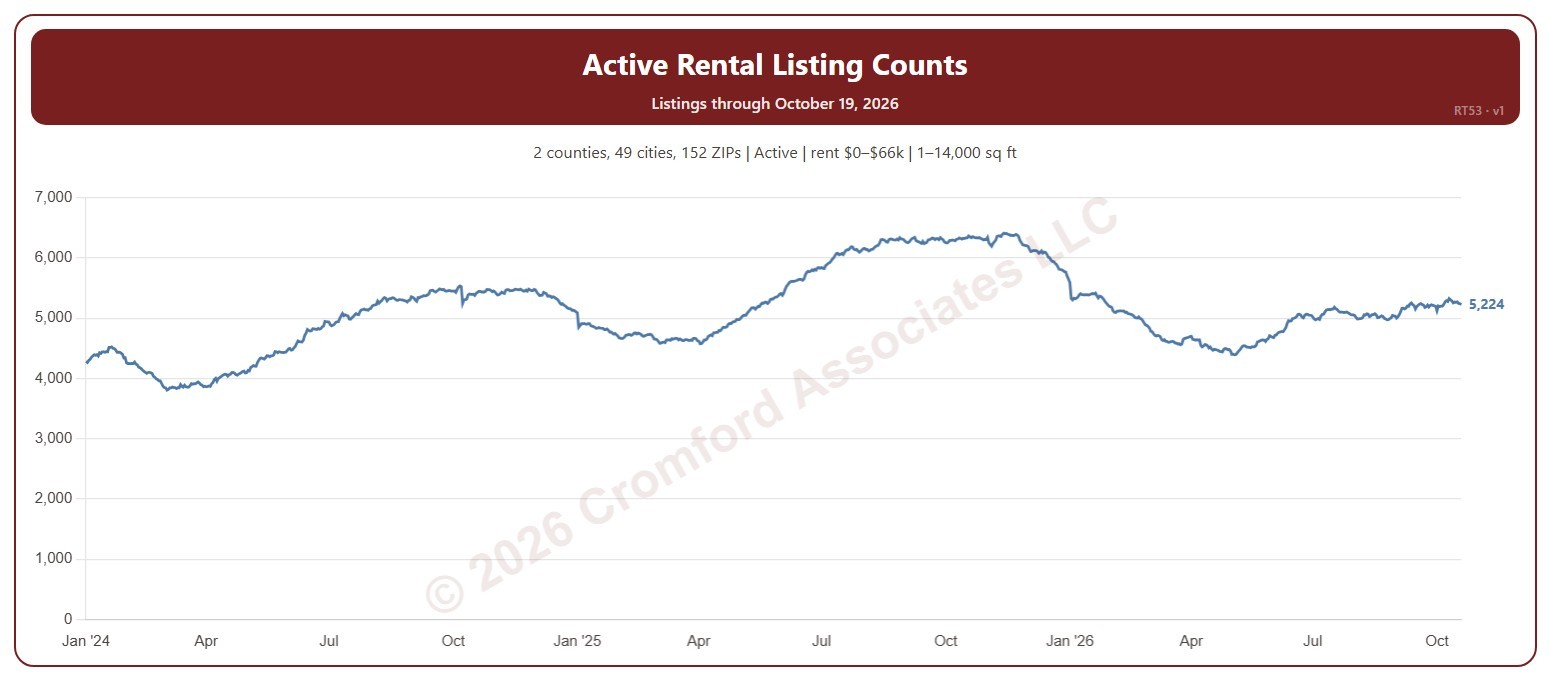
Active Rental Listing Counts

About this chart

This chart shows the number of homes listed for lease on ARMLS each day since January 2024, so the rise and fall of rental supply through the seasons can be read against earlier years.

It opens on Maricopa and Pinal Counties, Active rental listings, and homes of 1 to 14,000 square feet. Tick Coming Soon, Pending, or Temp Off Market in the Status box to add them, and tick or untick counties, cities, and ZIP codes to change the area. The chart is updated every day.

Narrow it further with the Dwelling Type and Bedrooms boxes and the asking rent, home size, and year built sliders.

Hover over the line to see the day’s count and the count on the same day a year earlier, with the change.