Quarterly Closed Home Sales

About this chart

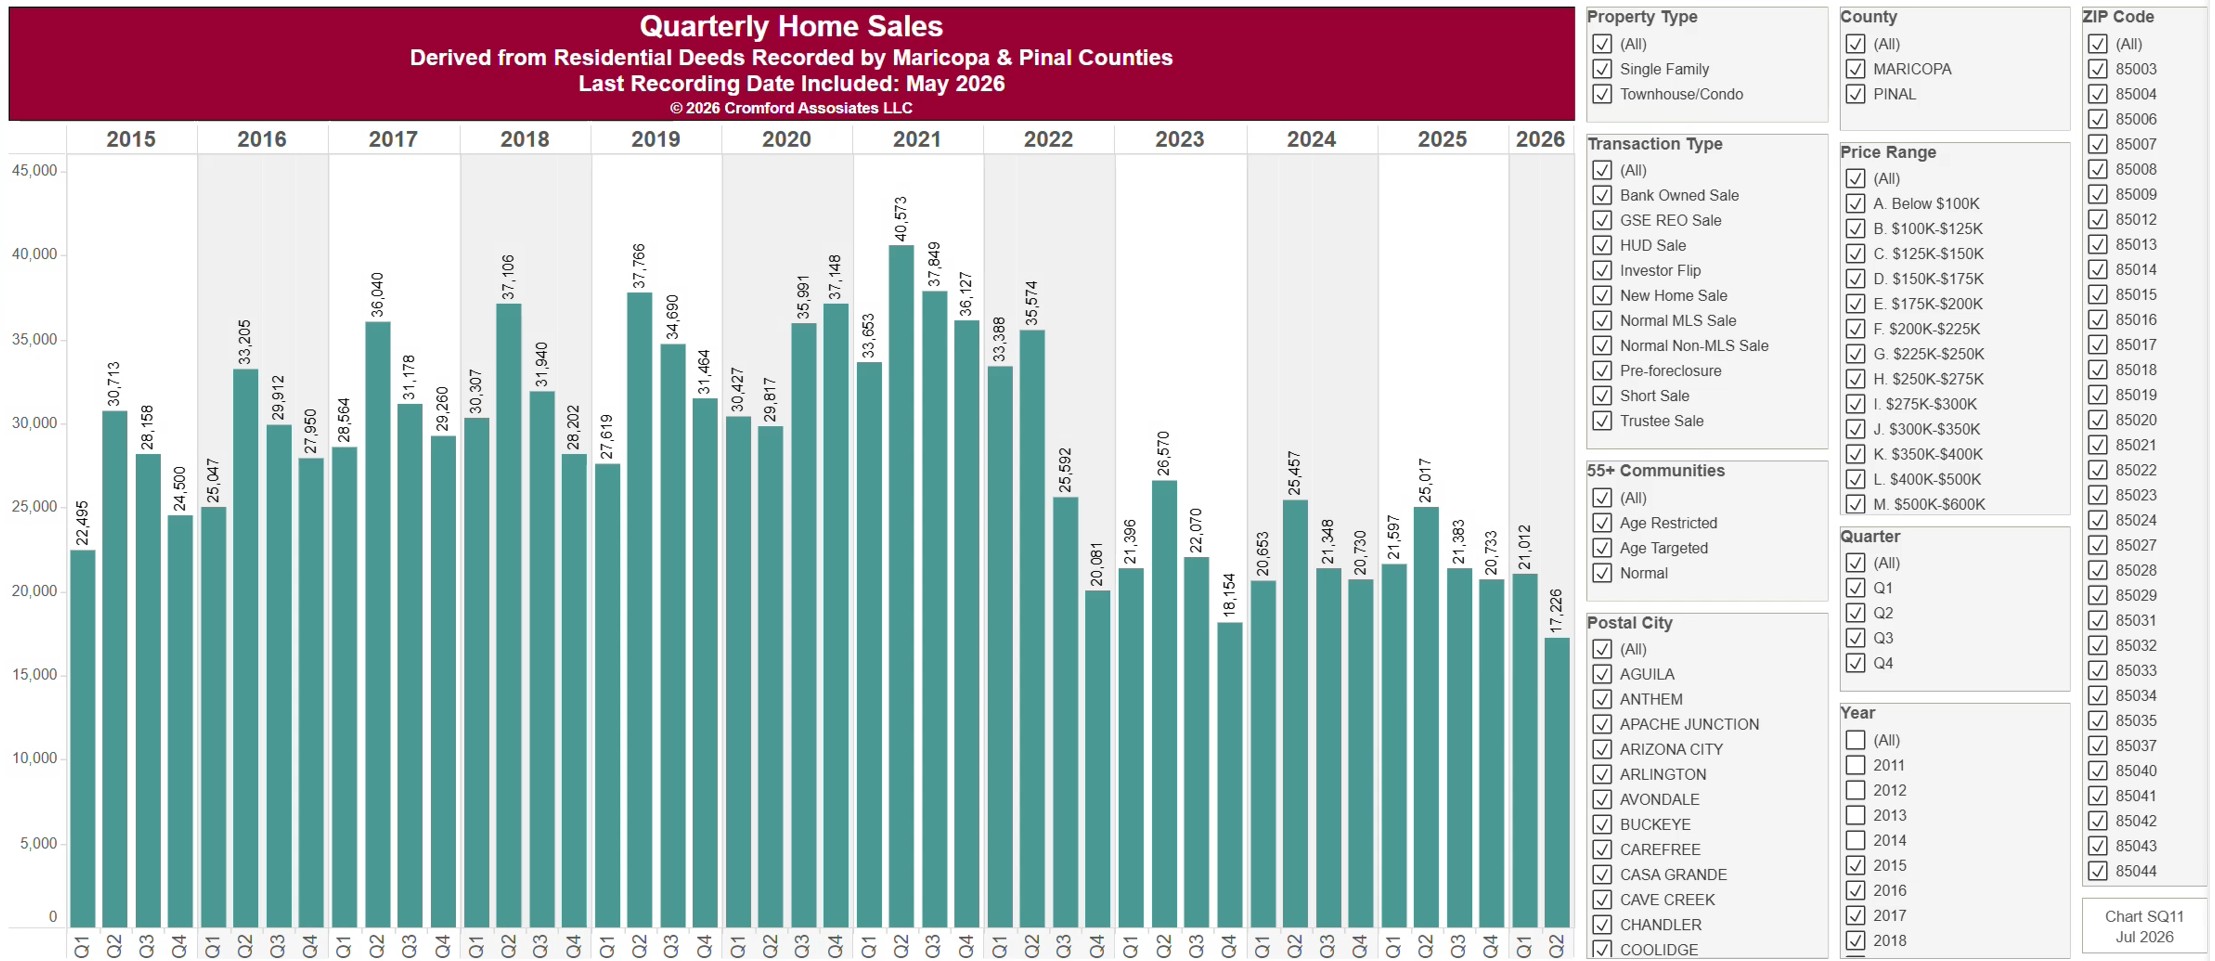
This chart counts the homes sold each calendar quarter since 2011, from residential deeds recorded by Maricopa and Pinal Counties. Because it is built from recorded deeds, it covers every recorded sale, not just homes listed on ARMLS: new homes, private sales, and investor deals are all included.

It opens on Maricopa and Pinal Counties with everything included. Narrow it with the County, City, and ZIP panels, the Transaction Type, Property Type, and 55+ Communities boxes, and the sale price and home size sliders. Untick years in the Year panel to drop them from the chart.

The newest quarter is usually only part of a quarter, because the records run to the end of last month. A part quarter’s bar is short, so compare it with the same months of earlier years. Hover over a bar to see the exact figure for that quarter.
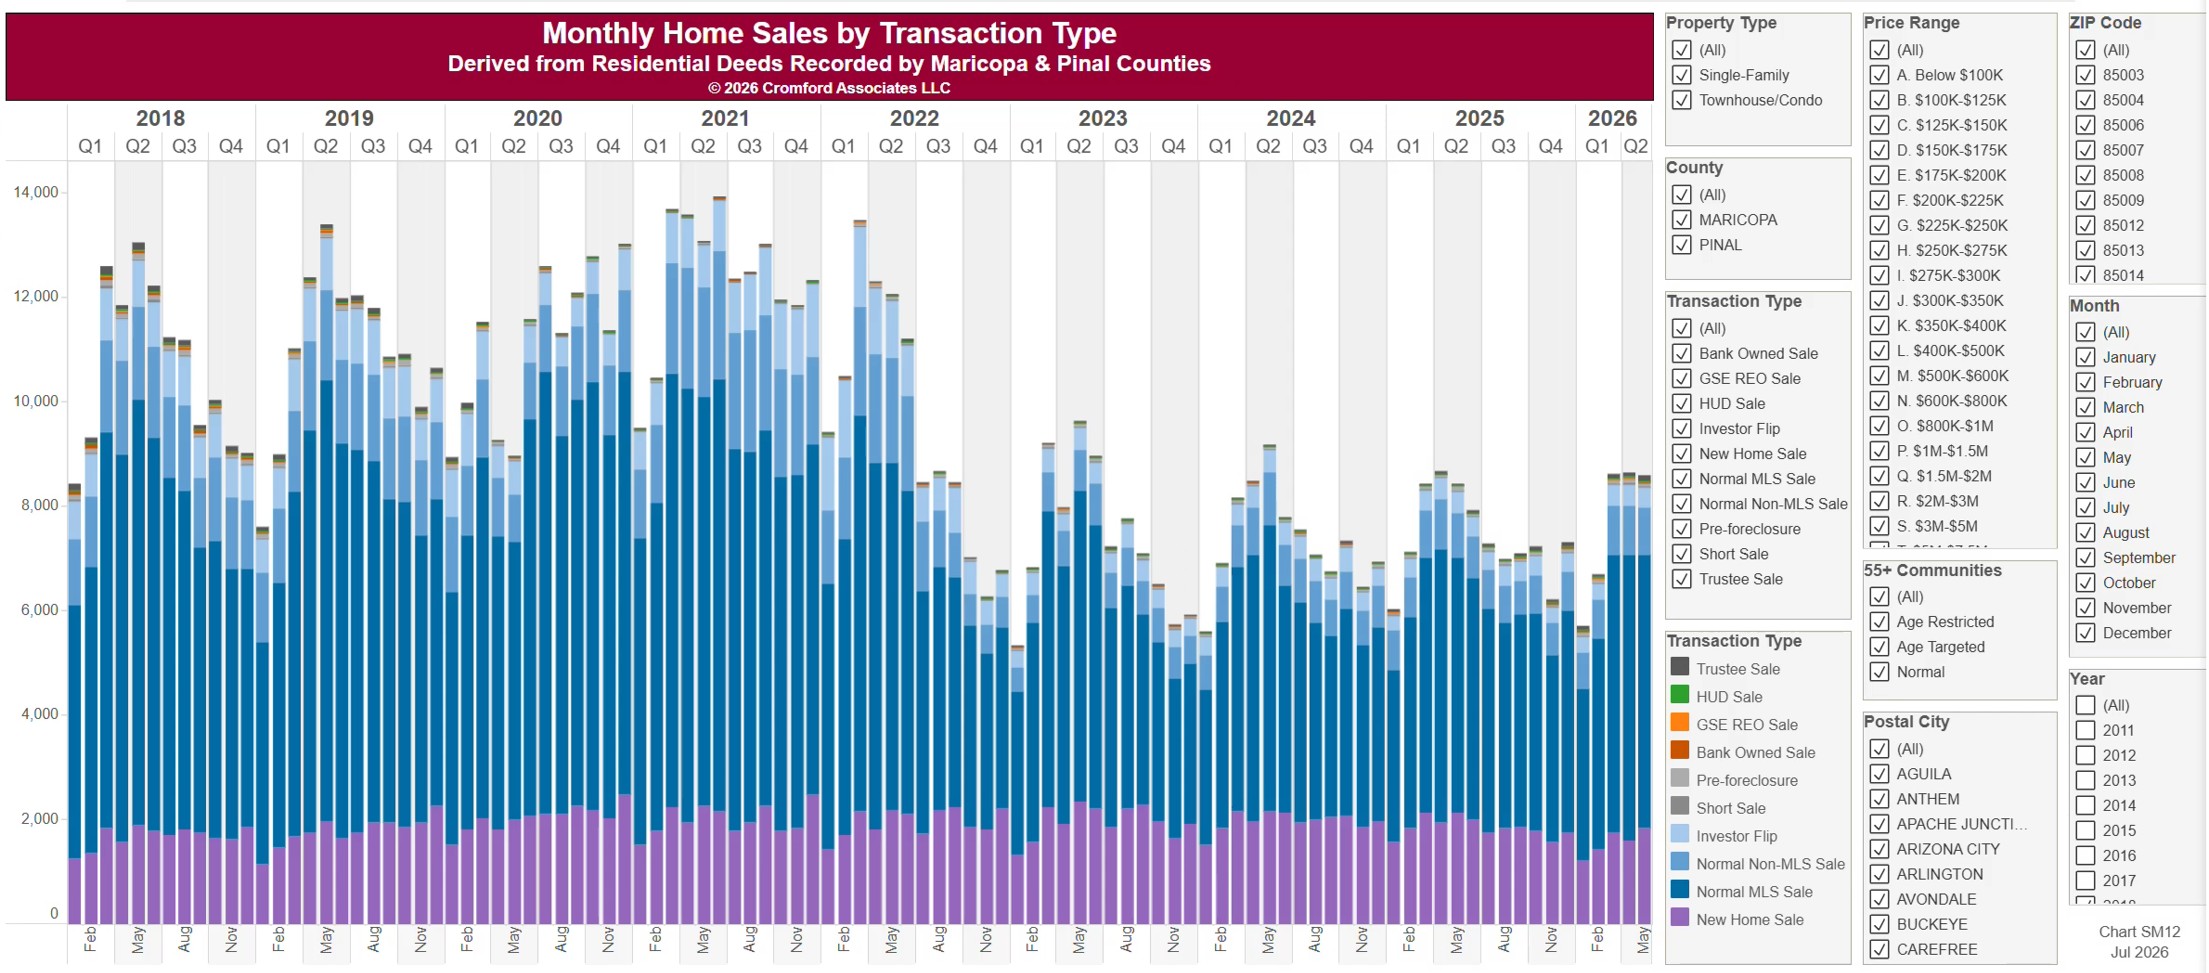
Monthly Closed Sales by Transaction Type

About this chart

This chart counts the homes sold each calendar month since January 2011, from residential deeds recorded by Maricopa and Pinal Counties, with each bar split by transaction type: normal MLS and non-MLS sales, new home sales, investor flips, short sales and pre-foreclosures, trustee sales, and lender-owned and HUD sales. It shows how the mix of the market changes over time. Because it is built from recorded deeds, it covers every recorded sale, not just homes listed on ARMLS: new homes, private sales, and investor deals are all included.

It opens on Maricopa and Pinal Counties with everything included. Narrow it with the County, City, and ZIP panels, the Transaction Type, Property Type, and 55+ Communities boxes, and the sale price and home size sliders. Untick years in the Year panel to drop them from the chart.

The records run to the end of last month and are updated monthly. Hover over a bar to see the counts for that month.

Home Sales Year-to-Date

About this chart

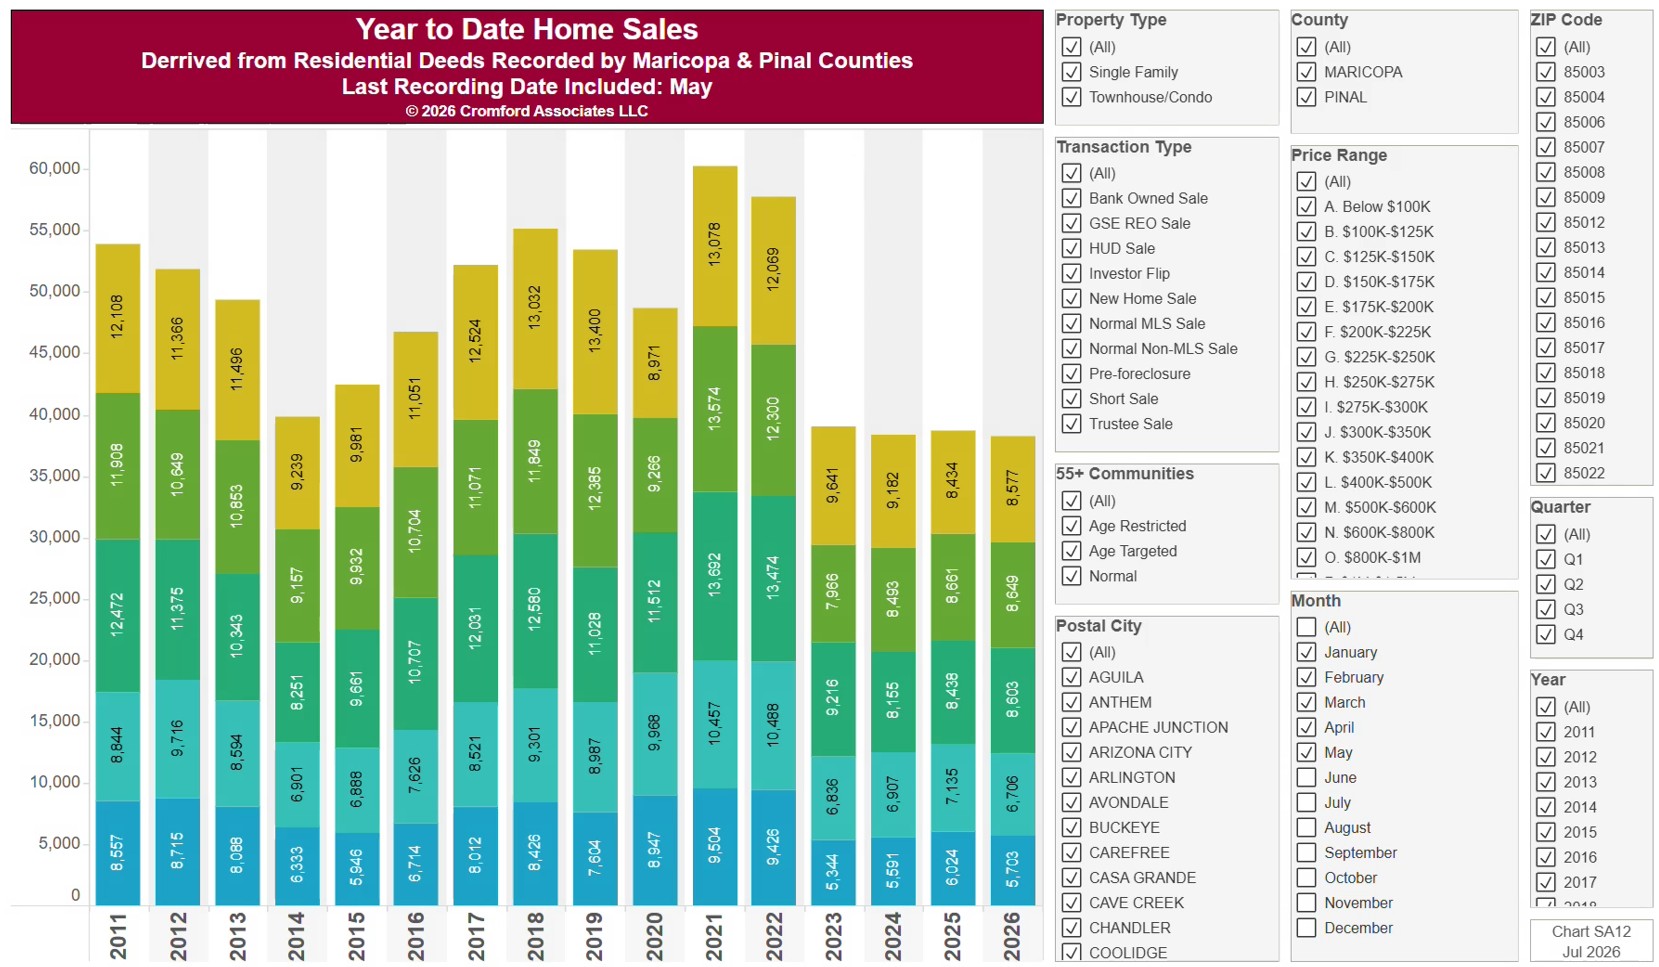
This chart counts the homes sold each year since 2011, from residential deeds recorded by Maricopa and Pinal Counties, with every year cut to the same months (January to the latest month recorded), so the current year can be compared fairly with earlier ones. Because it is built from recorded deeds, it covers every recorded sale, not just homes listed on ARMLS: new homes, private sales, and investor deals are all included.

It opens on Maricopa and Pinal Counties with everything included. Narrow it with the County, City, and ZIP panels, the Transaction Type, Property Type, and 55+ Communities boxes, and the sale price slider.

The records run to the end of last month and are updated monthly. Hover over a bar to see the exact figure for that year.

Annual Home Sales

About this chart

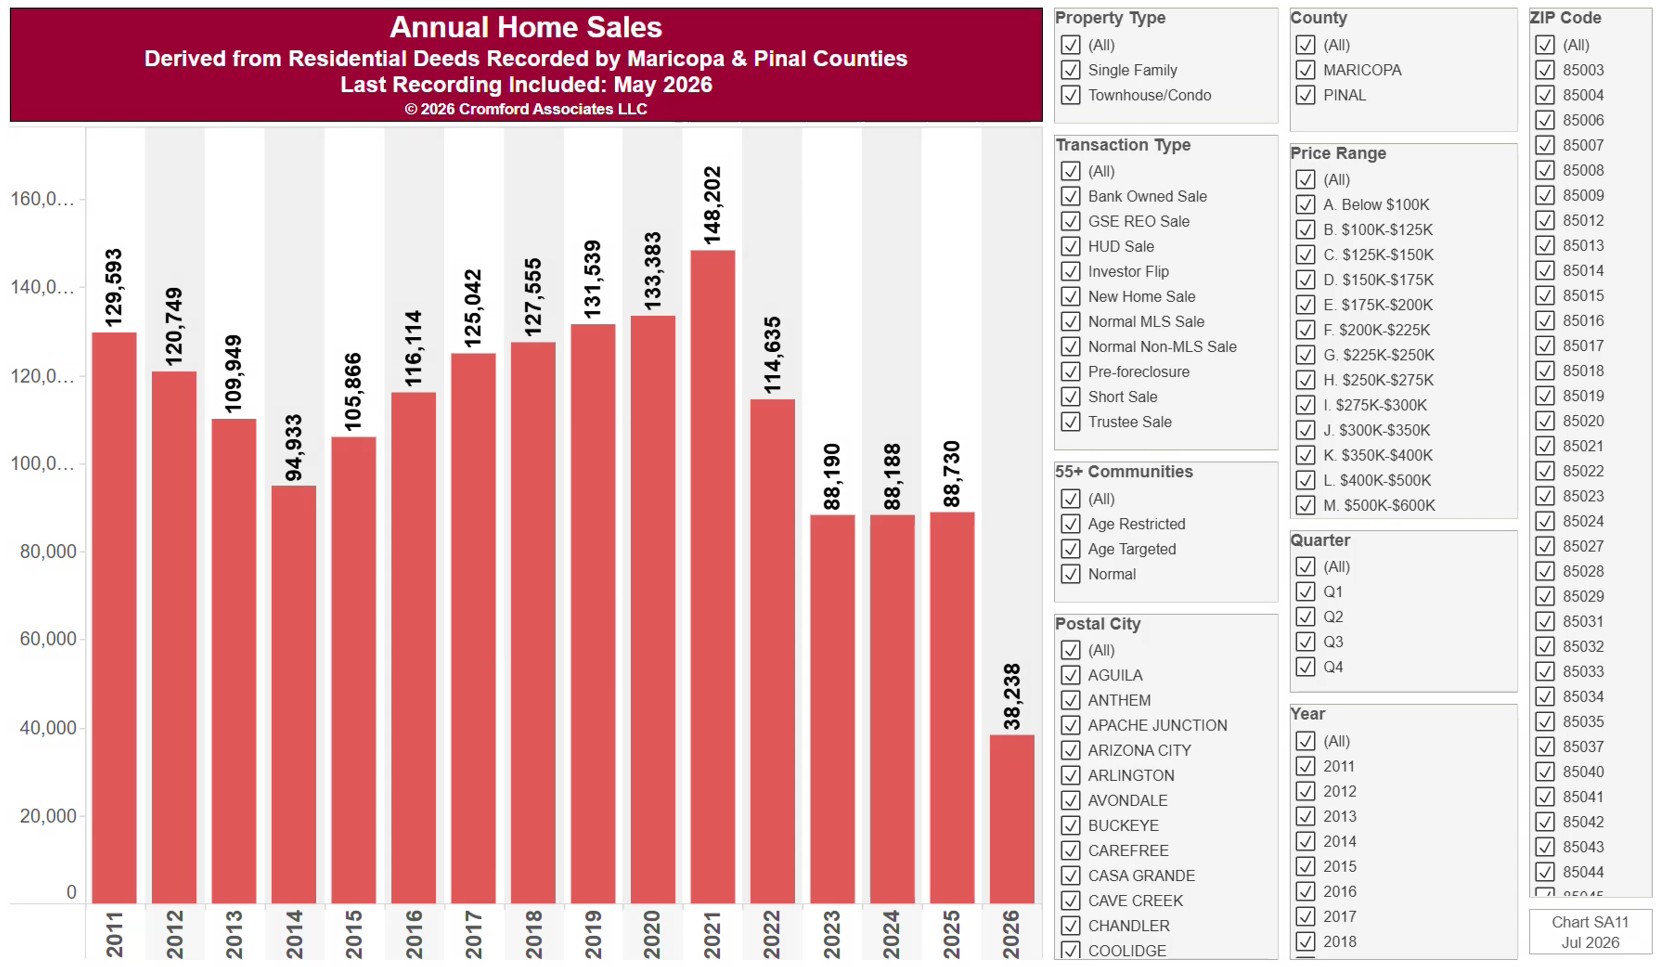
This chart counts the homes sold each calendar year since 2011, from residential deeds recorded by Maricopa and Pinal Counties. Because it is built from recorded deeds, it covers every recorded sale, not just homes listed on ARMLS: new homes, private sales, and investor deals are all included.

It opens on Maricopa and Pinal Counties with everything included. Narrow it with the County, City, and ZIP panels, the Transaction Type, Property Type, and 55+ Communities boxes, and the sale price slider.

The current year’s bar covers only the months recorded so far. SA12 compares every year over the same months. Hover over a bar to see the exact figure for that year.

Monthly Average Sale Price

About this chart

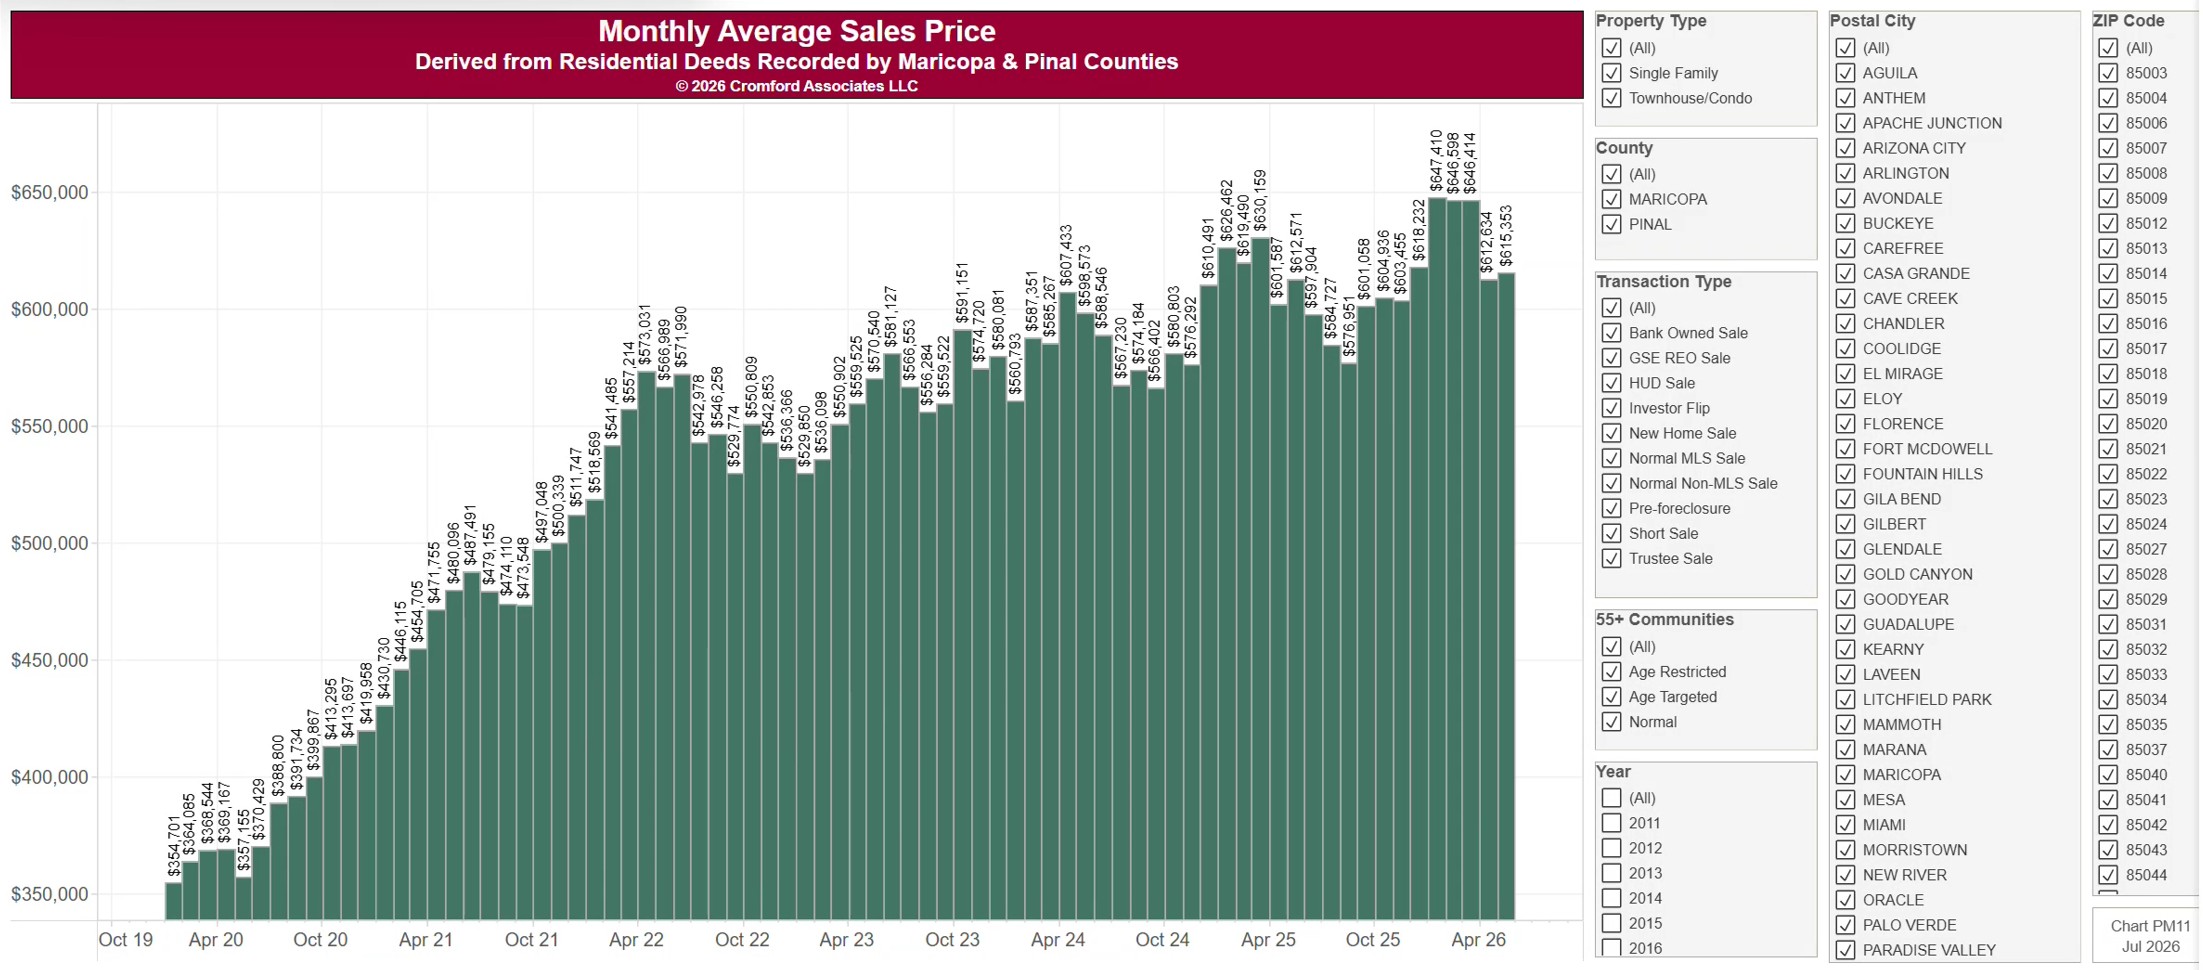
This chart shows the average sale price of homes, one bar per calendar month since January 2011, from residential deeds recorded by Maricopa and Pinal Counties. Sales of large, expensive homes pull the average up more than the median. Because it is built from recorded deeds, it covers every recorded sale, not just homes listed on ARMLS: new homes, private sales, and investor deals are all included.

It opens on Maricopa and Pinal Counties with everything included. Narrow it with the County, City, and ZIP panels, the Transaction Type, Property Type, and 55+ Communities boxes, and the sale price slider. Untick years in the Year panel to drop them from the chart.

The records run to the end of last month and are updated monthly. Hover over a bar to see the exact figure for that month.

New Home Closings by Price Range

About this chart

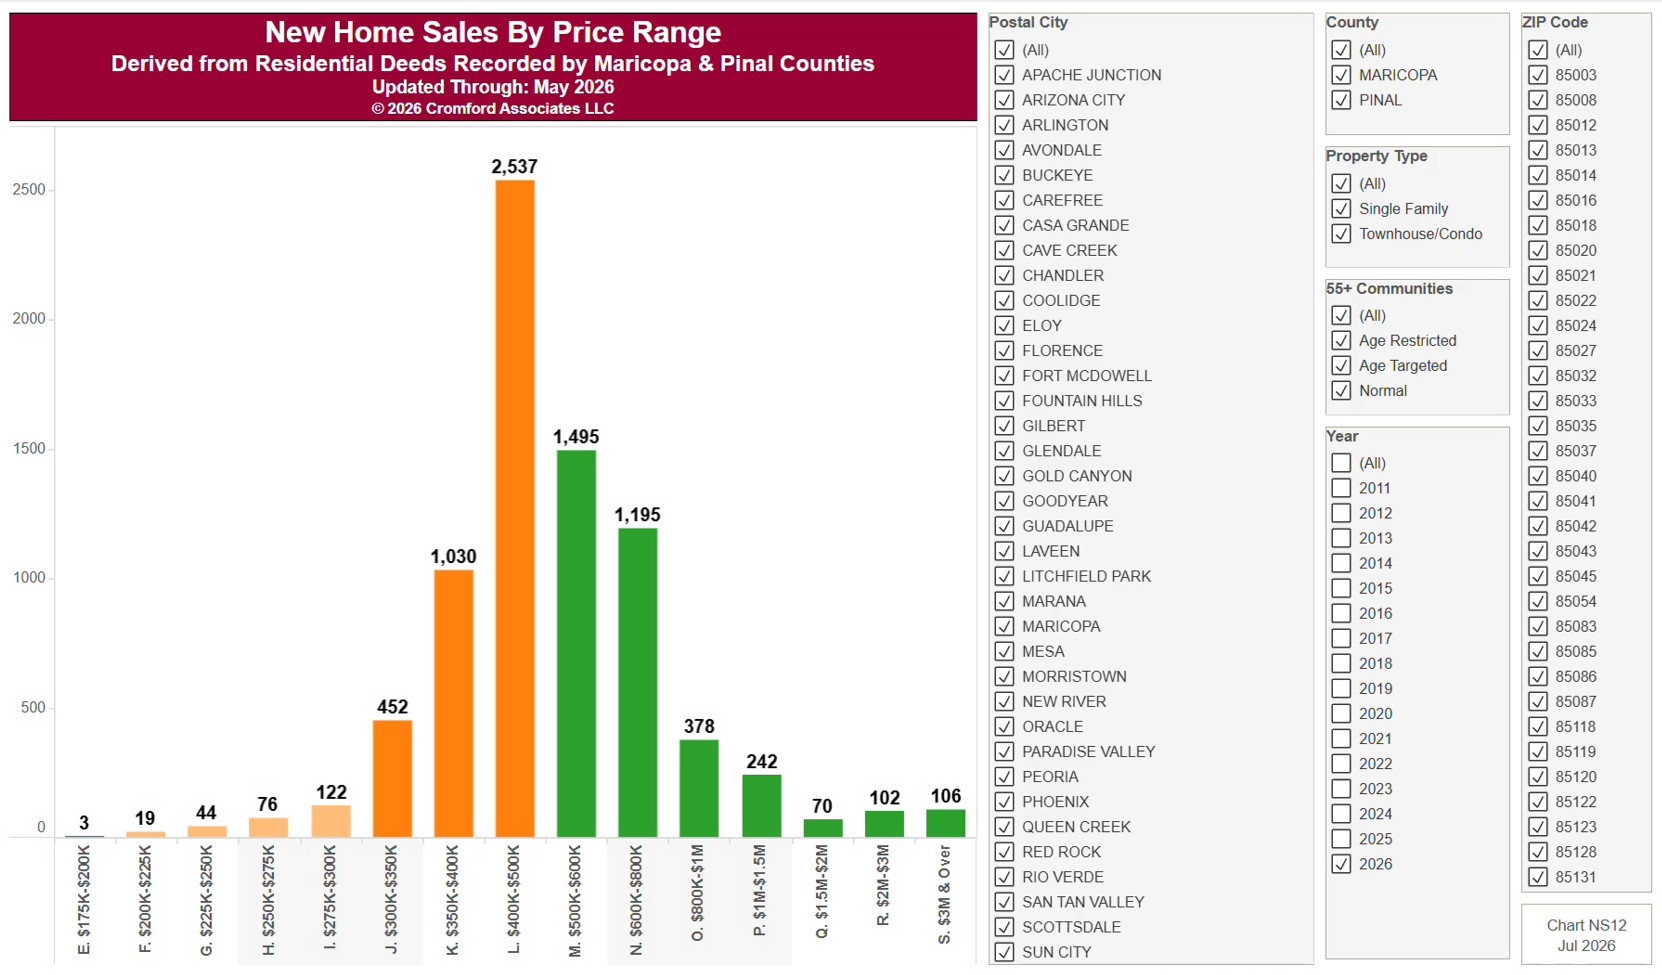
This chart counts new home closings in each price band, from below $100K up to $3M and over, from residential deeds recorded by Maricopa and Pinal Counties. It opens on the current year (January to the latest month recorded); tick more years in the Year panel to include them. To a builder a sale is the contract signature, months before the deed records, so we count closings.

It opens on Maricopa and Pinal Counties with everything included. Narrow it with the County, City, and ZIP panels and the Property Type and 55+ Communities boxes.

Hover over a bar to see the count for that price band.

Percentage of Home Sales by Intended Use

About this chart

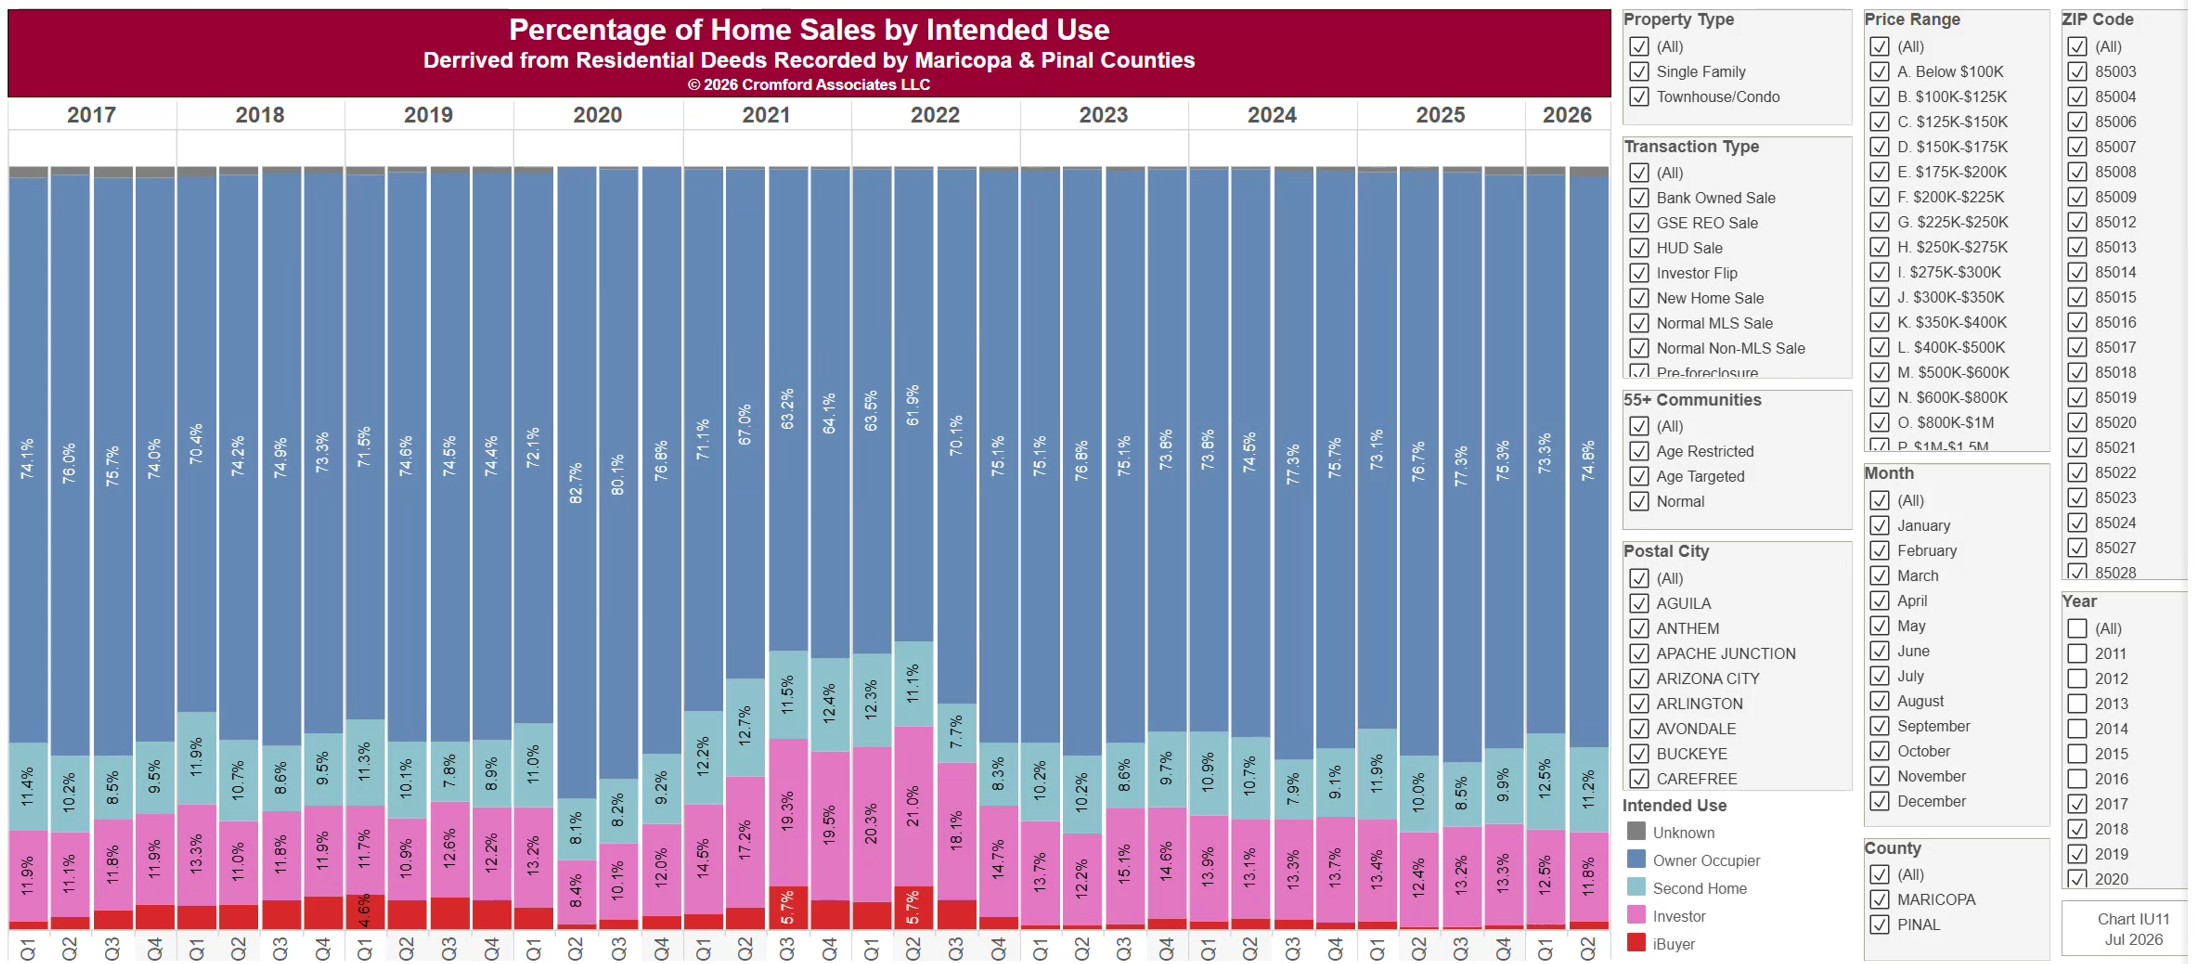
This chart shows what buyers said they were buying homes for, one bar per calendar quarter since 2011, from residential deeds recorded by Maricopa and Pinal Counties. Each bar adds up to 100% and is split by intended use: owner occupier, investor, second home, iBuyer, and unknown. It is about the mix, not the volume.

It opens on Maricopa and Pinal Counties with everything included. Narrow it with the County, City, and ZIP panels, the Intended Use, Transaction Type, Property Type, and 55+ Communities boxes, and the sale price and home size sliders. Untick years in the Year panel to drop them from the chart. Use the date slider, or Full range, to choose the stretch of history shown.

The newest quarter is usually only part of a quarter, because the records run to the end of last month. Hover over a bar to see each share for that quarter.

30 Year Fixed Mortgage Interest Rate

About this chart

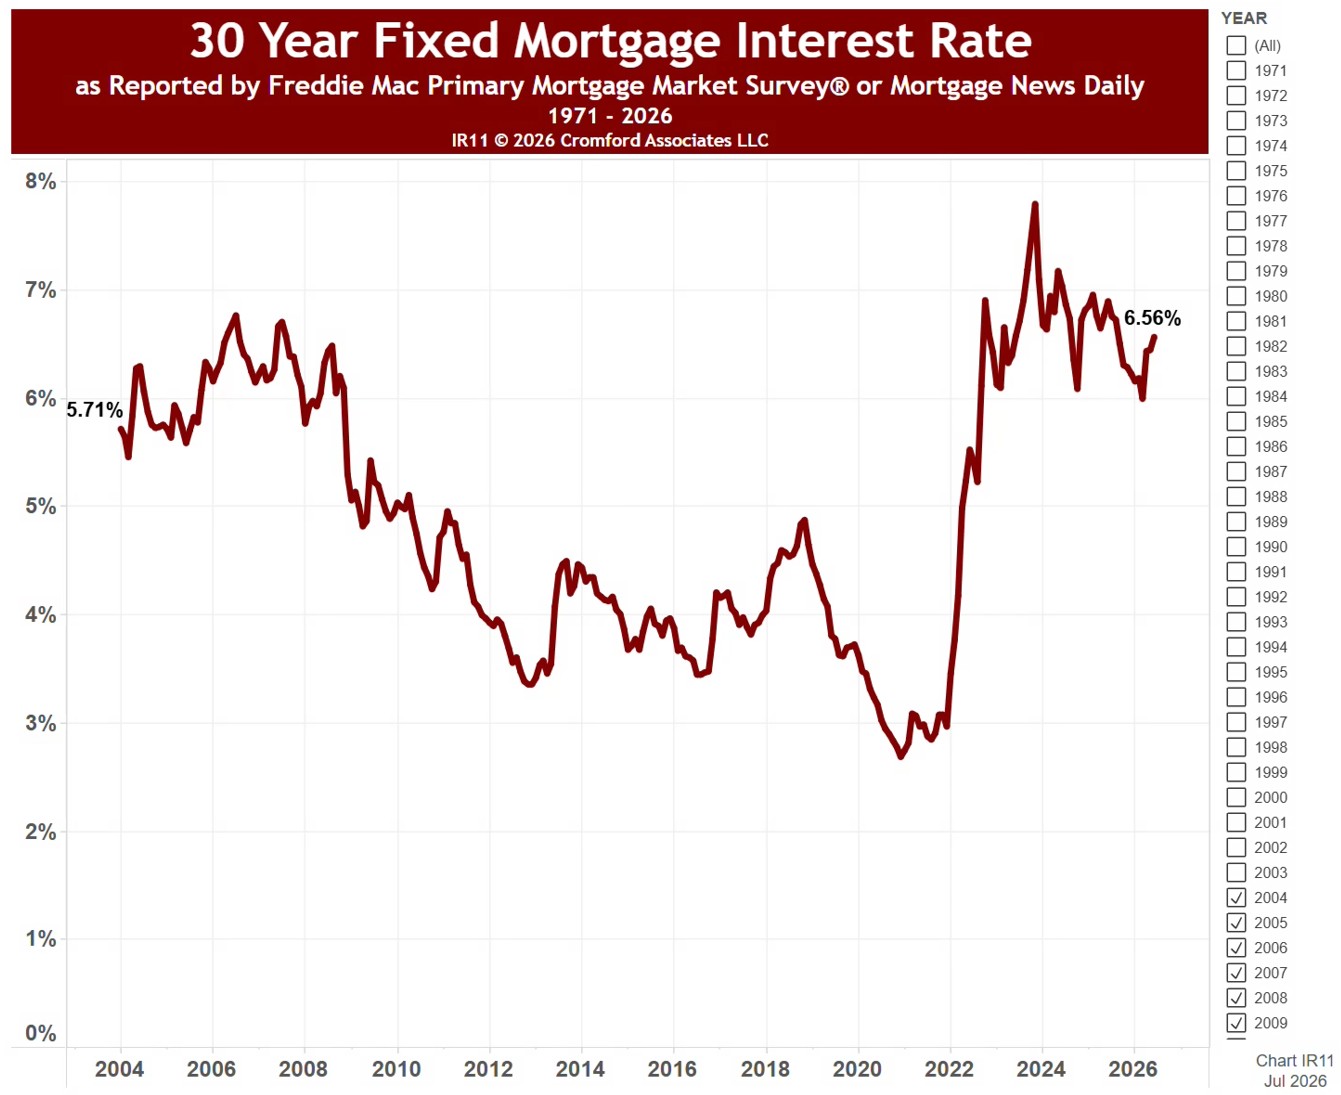
This chart shows the average 30-year fixed mortgage rate each month since April 1971, as reported by the Freddie Mac Primary Mortgage Market Survey®. The line under the title gives the latest rate and the lowest and highest for the months shown.

It opens on the whole history; use the Recording Month range to zoom in on any stretch of months, and the line under the title updates to match.

Rates feed straight into what buyers can afford: on the same budget, a higher rate means a smaller loan. Hover over the line to see the rate for any month.

Percentage of Home Sales by Finance Type

About this chart

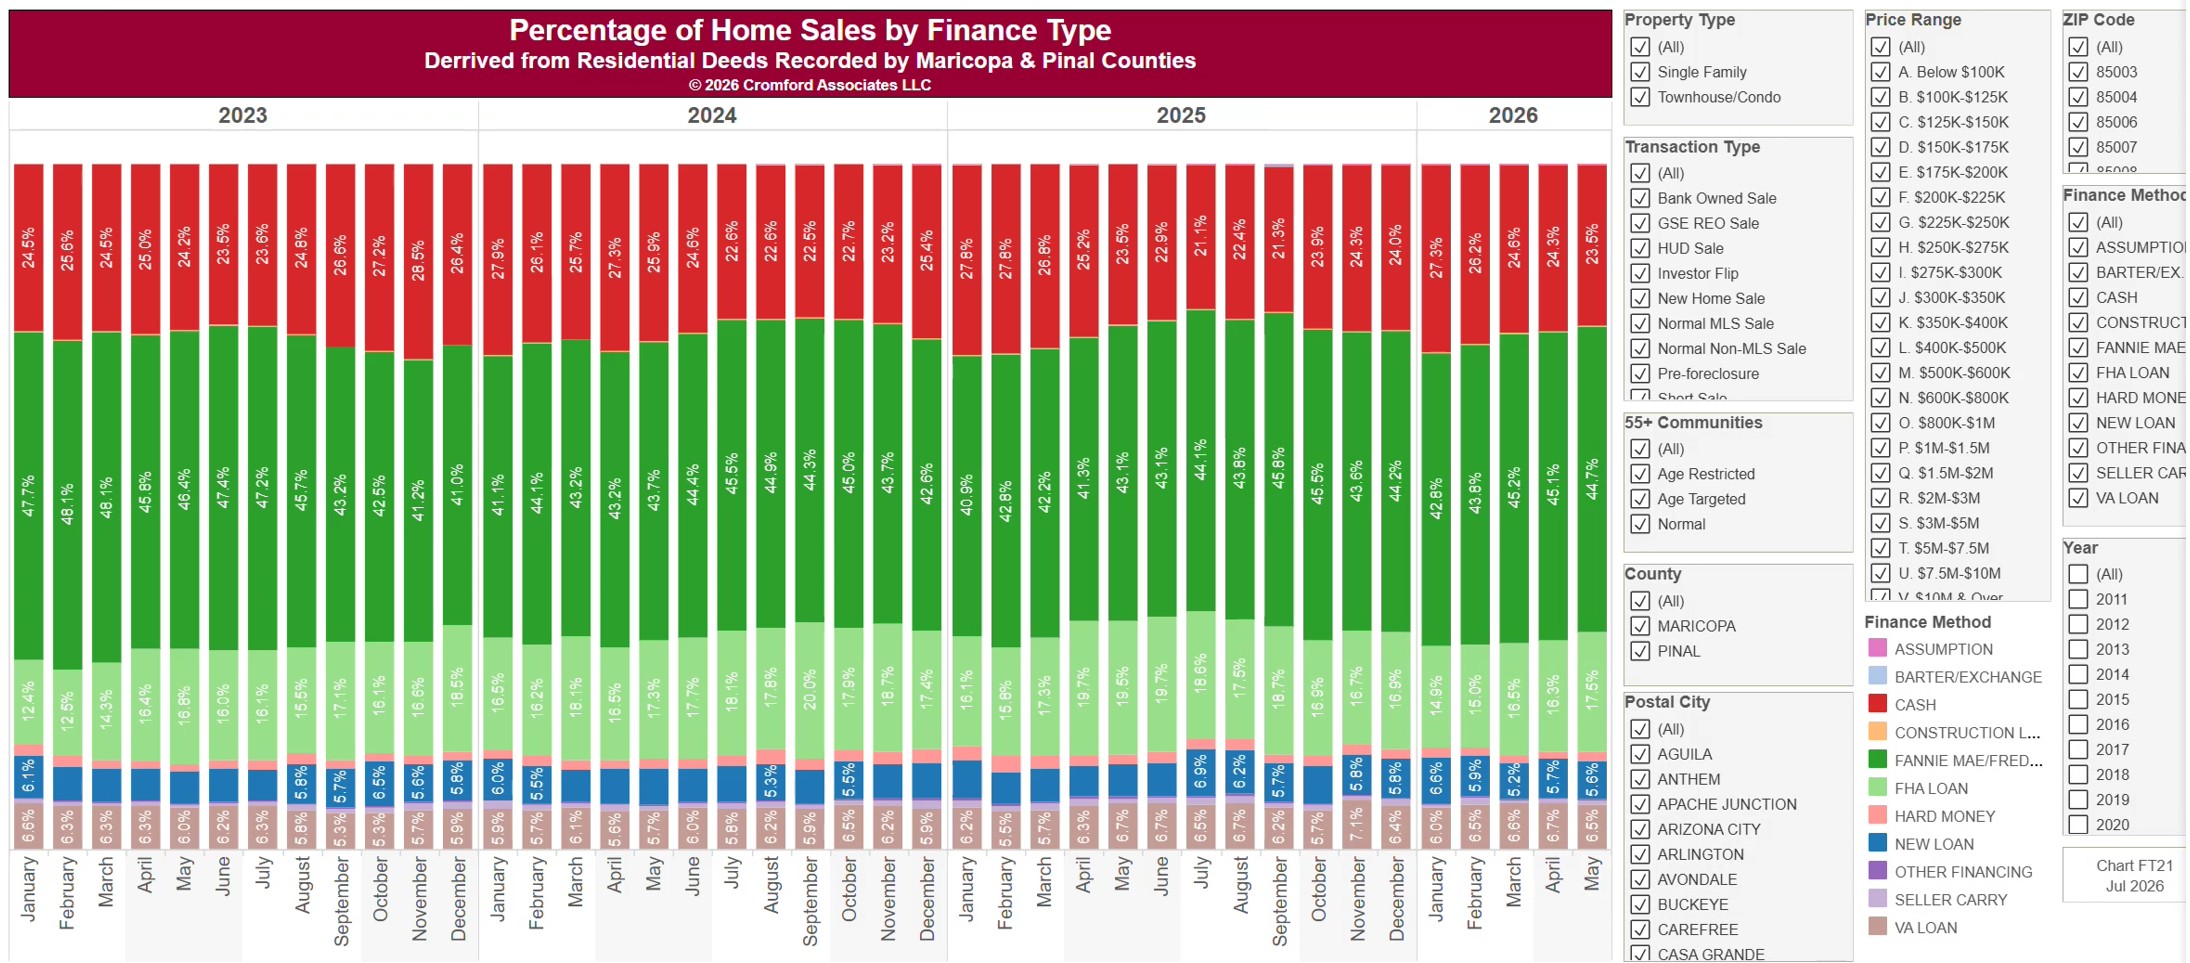
This chart shows how homes were paid for, one bar per calendar month since January 2011, from residential deeds recorded by Maricopa and Pinal Counties. Each bar adds up to 100% and is split by finance method: cash, Fannie Mae / Freddie Mac, FHA, VA, other new loans, hard money, seller carry, assumptions, construction loans, and other financing. It is about the mix, not the volume, so a quiet month and a busy month are the same height.

It opens on Maricopa and Pinal Counties with everything included. Narrow it with the County, City, and ZIP panels, the Finance Method, Transaction Type, Property Type, and 55+ Communities boxes, and the sale price slider. Untick years in the Year panel to drop them from the chart.

The records run to the end of last month and are updated monthly. Hover over a bar to see each share for that month.

Flip Sales – Median Acquisition and Sales Prices

About this chart

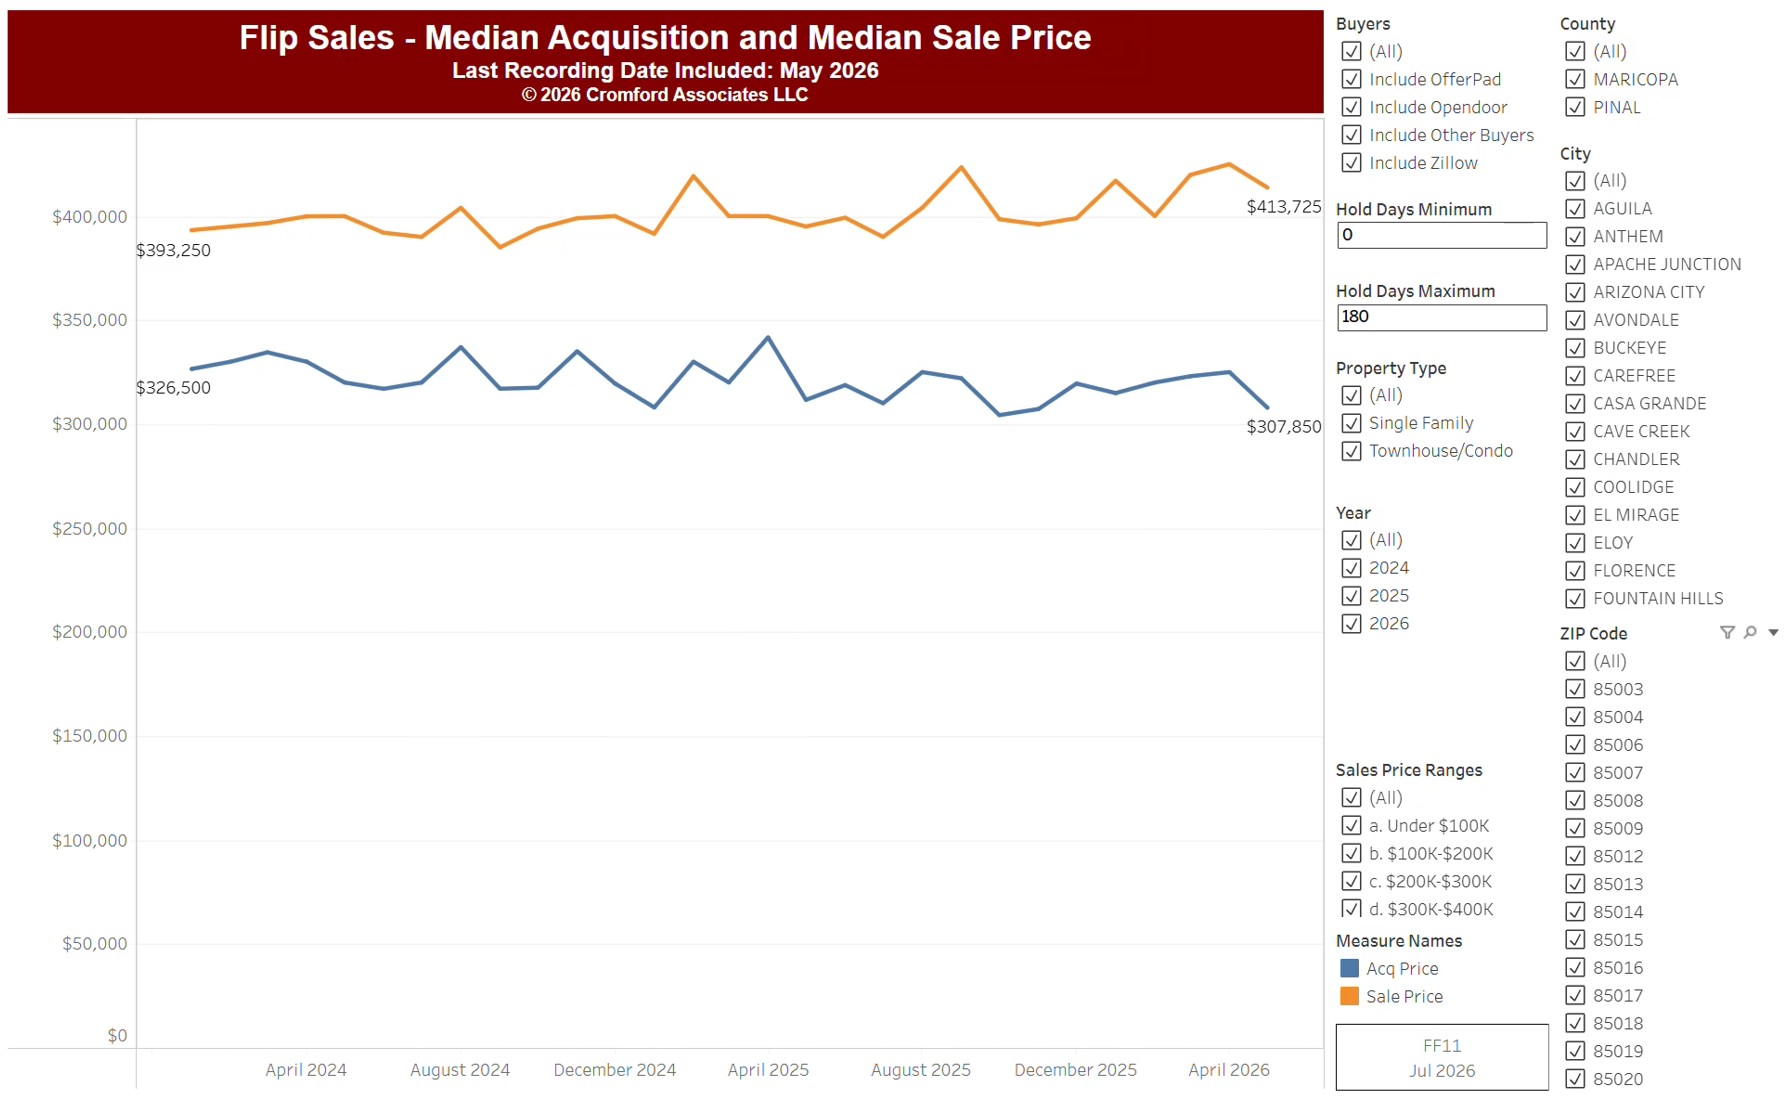
This chart follows fix-and-flip sales, from residential deeds recorded by Maricopa and Pinal Counties: homes bought and resold by an investor. Its two lines show, by calendar month since January 2014, the median price flippers paid and the median price they resold for. The gap between the lines is the typical gross margin on a flip, before renovation and selling costs.

It opens on every month since January 2014, with Maricopa and Pinal Counties and all buyers included, Opendoor, OfferPad, Zillow, and Homes2X among them; untick them under Buyers to leave them out. Choose the period with the Recording Month slider, and narrow it with the County, City, and ZIP panels, the Property Type boxes, and the sale price and hold days sliders.

The records run to the end of last month and are updated monthly. Hover over the chart to see the figures for that month.