Case-Shiller® Home Price Index®

About this chart

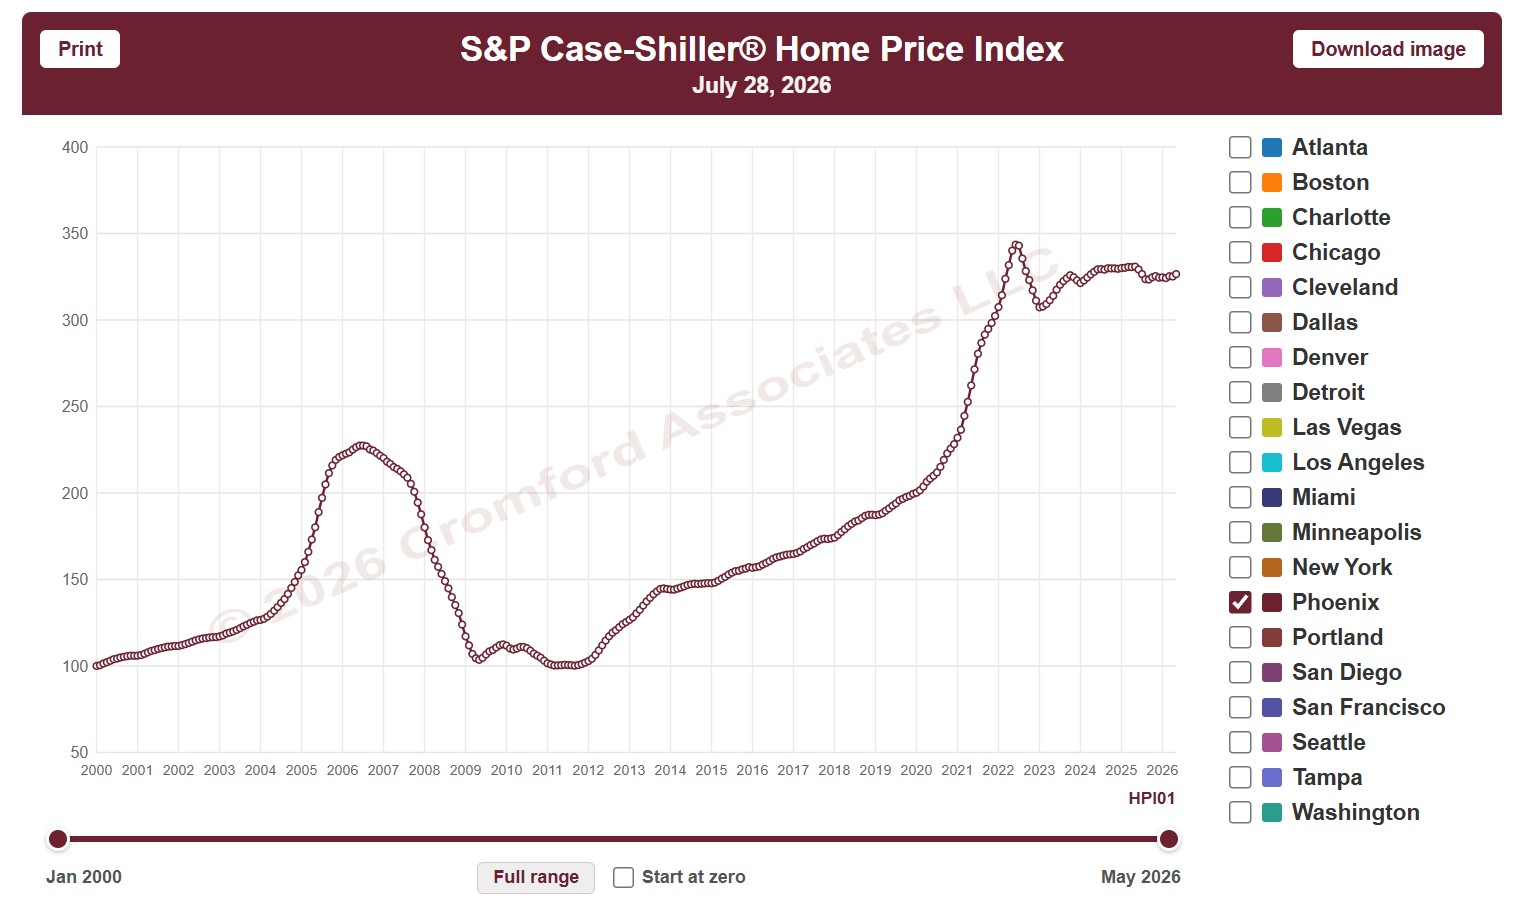
This chart shows the S&P Cotality Case-Shiller Home Price Index, which tracks the prices of the same homes as they resell, so it measures price change without being skewed by the mix of homes that sold. It opens on Phoenix; tick any of the other 19 metro areas to compare them.

The CPI option switches between nominal prices and real prices adjusted for US or Phoenix inflation, and Start at zero sets the axis to begin at zero. Use the date slider, or Full range, to choose the stretch of history shown.

The index is published monthly, about two months in arrears. Hover over the chart to see the figures for that month.
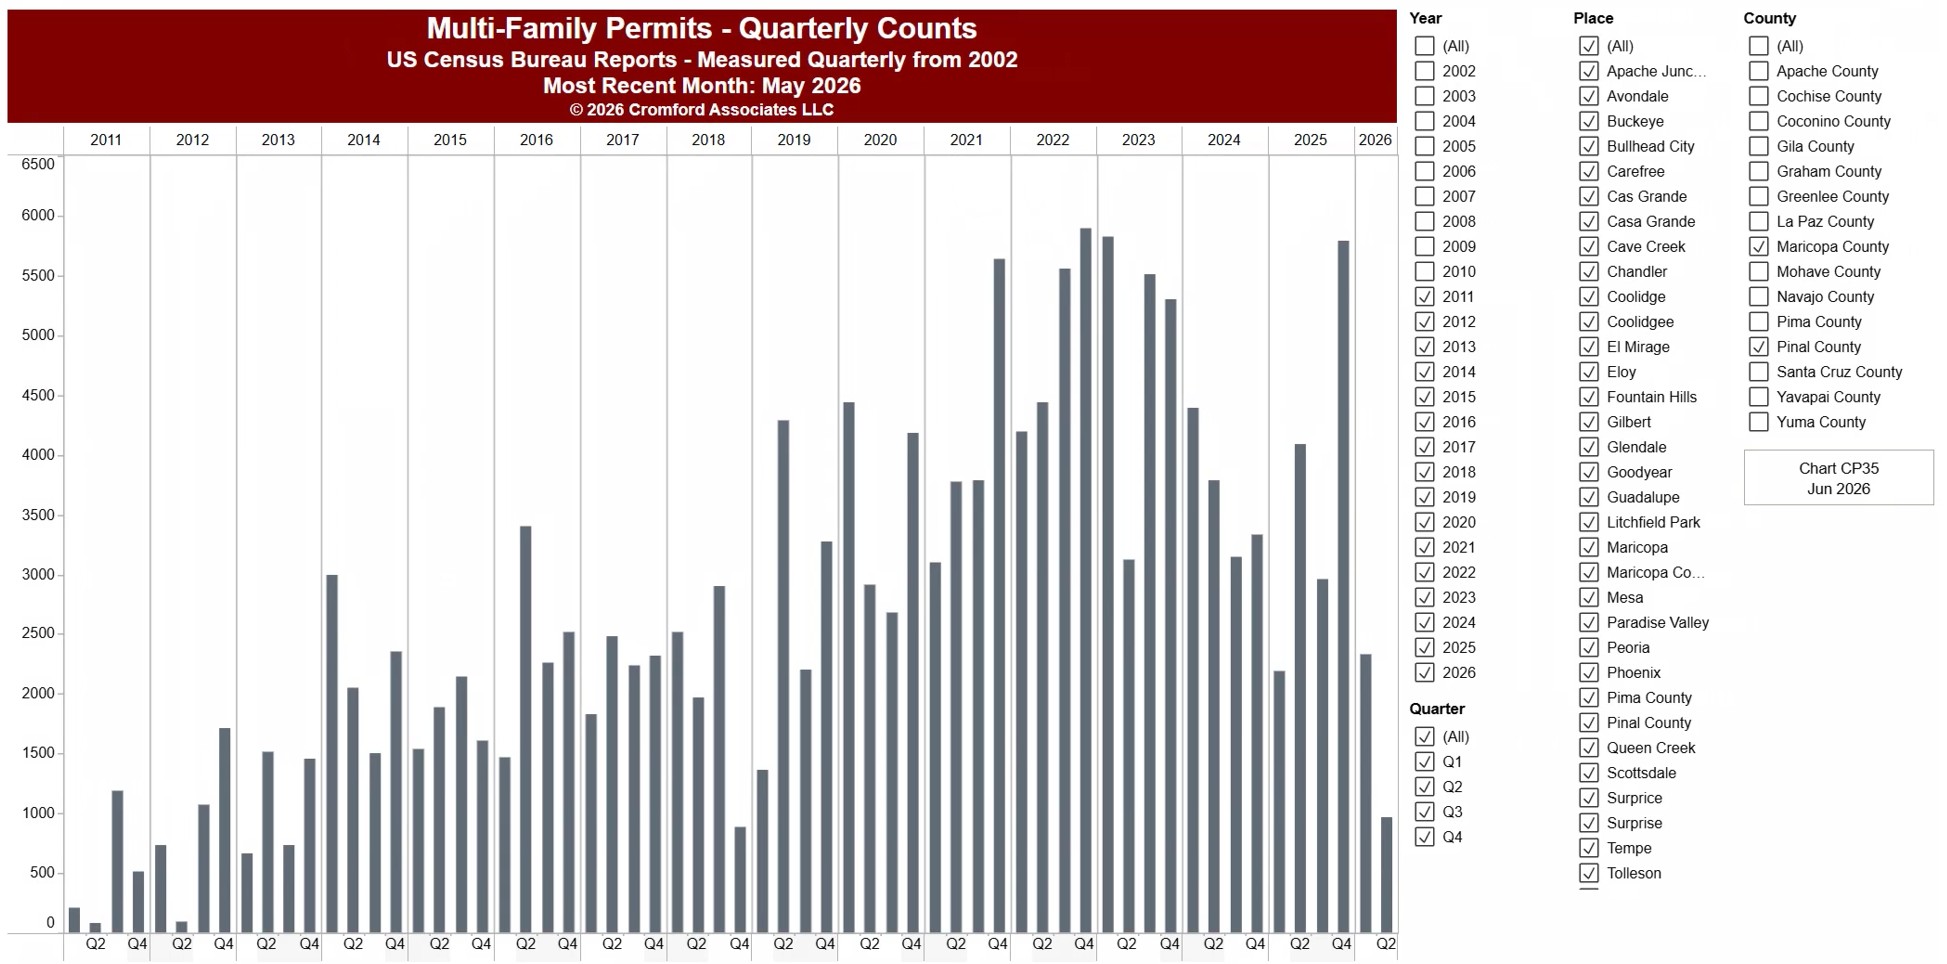
Multi-Family Permits – Quarterly Counts

About this chart

This chart shows the number of multi-family homes (apartments, condos, and other units in buildings with more than one home) authorized by building permits, from the US Census Bureau’s Building Permits Survey. Each bar is the total for one calendar quarter. The newest quarter may cover only the months published so far.

It opens on Arizona with Maricopa and Pinal Counties and every city and town in them, from 2017 onwards. Choose any US state from the State list, pick counties and places, and use the Date range control to look back as far as 1996. The most recent month available is shown under the title.

Permits are an early sign of new construction, so this shows how much new multi-family housing is on the way. Hover over a bar to see its value.

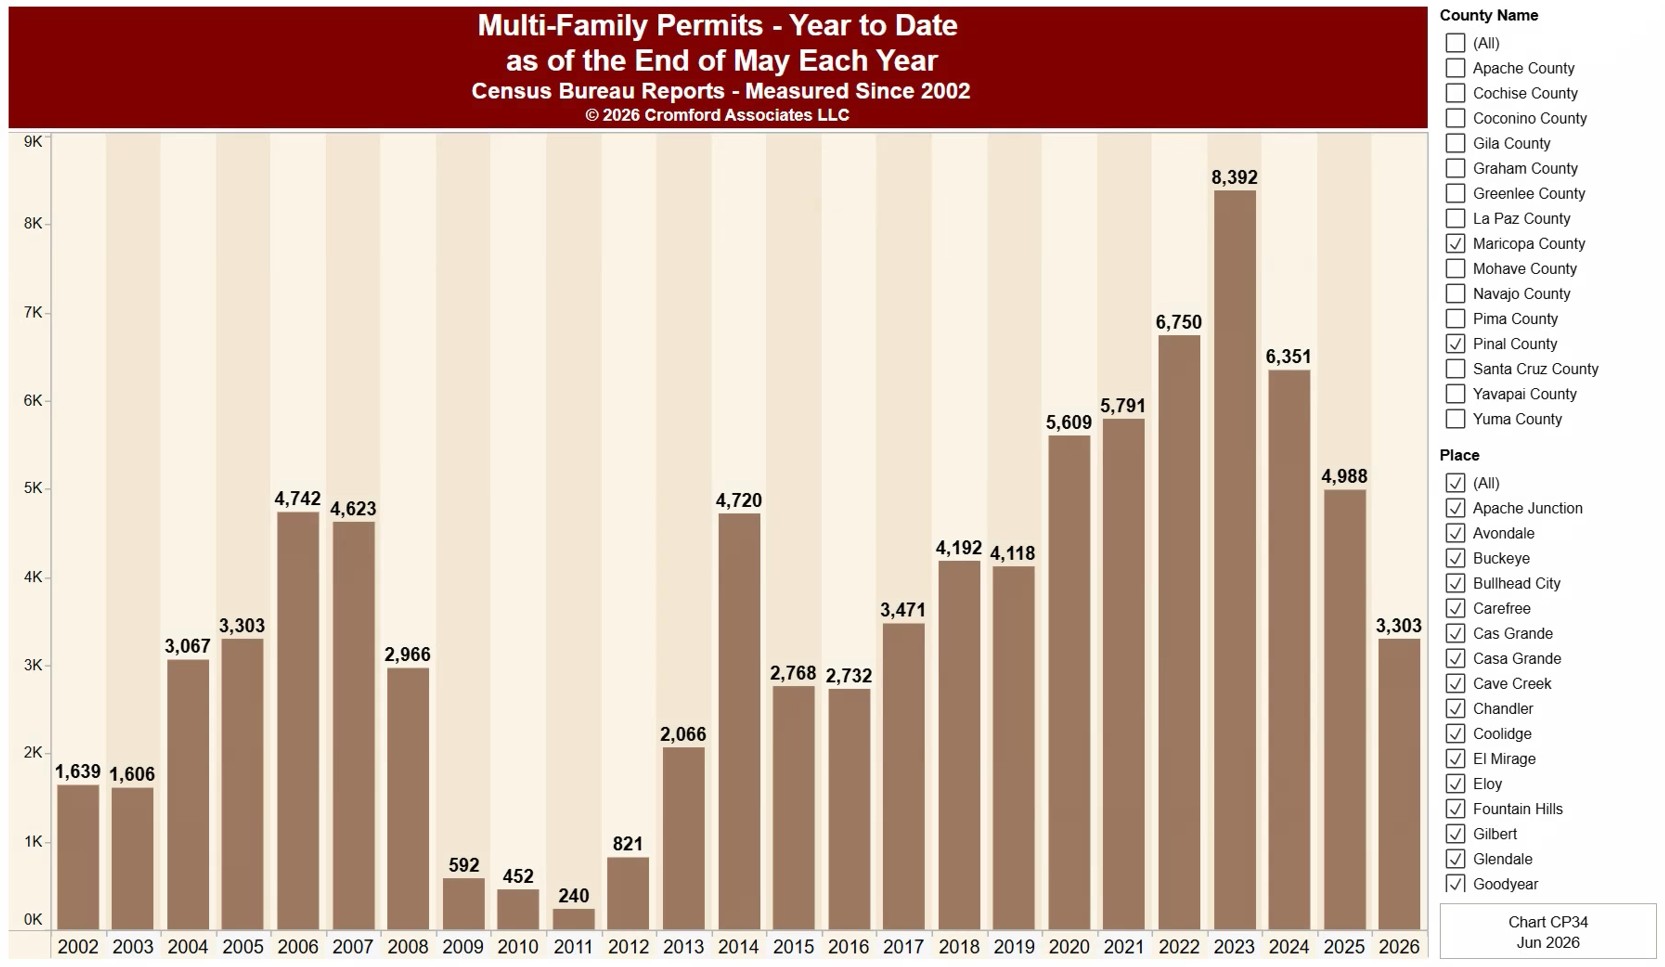
Multi-Family Permits – Year-to-Date Counts

About this chart

This chart shows the number of multi-family homes (apartments, condos, and other units in buildings with more than one home) authorized by building permits, from the US Census Bureau’s Building Permits Survey. Each bar is one year’s total from January to the latest month published, with every year cut to the same months, so the current year can be compared fairly with earlier ones.

It opens on Arizona with Maricopa and Pinal Counties and every city and town in them, from 2017 onwards. Choose any US state from the State list, pick counties and places, and use the Date range control to look back as far as 1996. The most recent month available is shown under the title.

Permits are an early sign of new construction, so this shows how much new multi-family housing is on the way. Hover over a bar to see its value.

Multi-Family Permits – Monthly Counts

About this chart

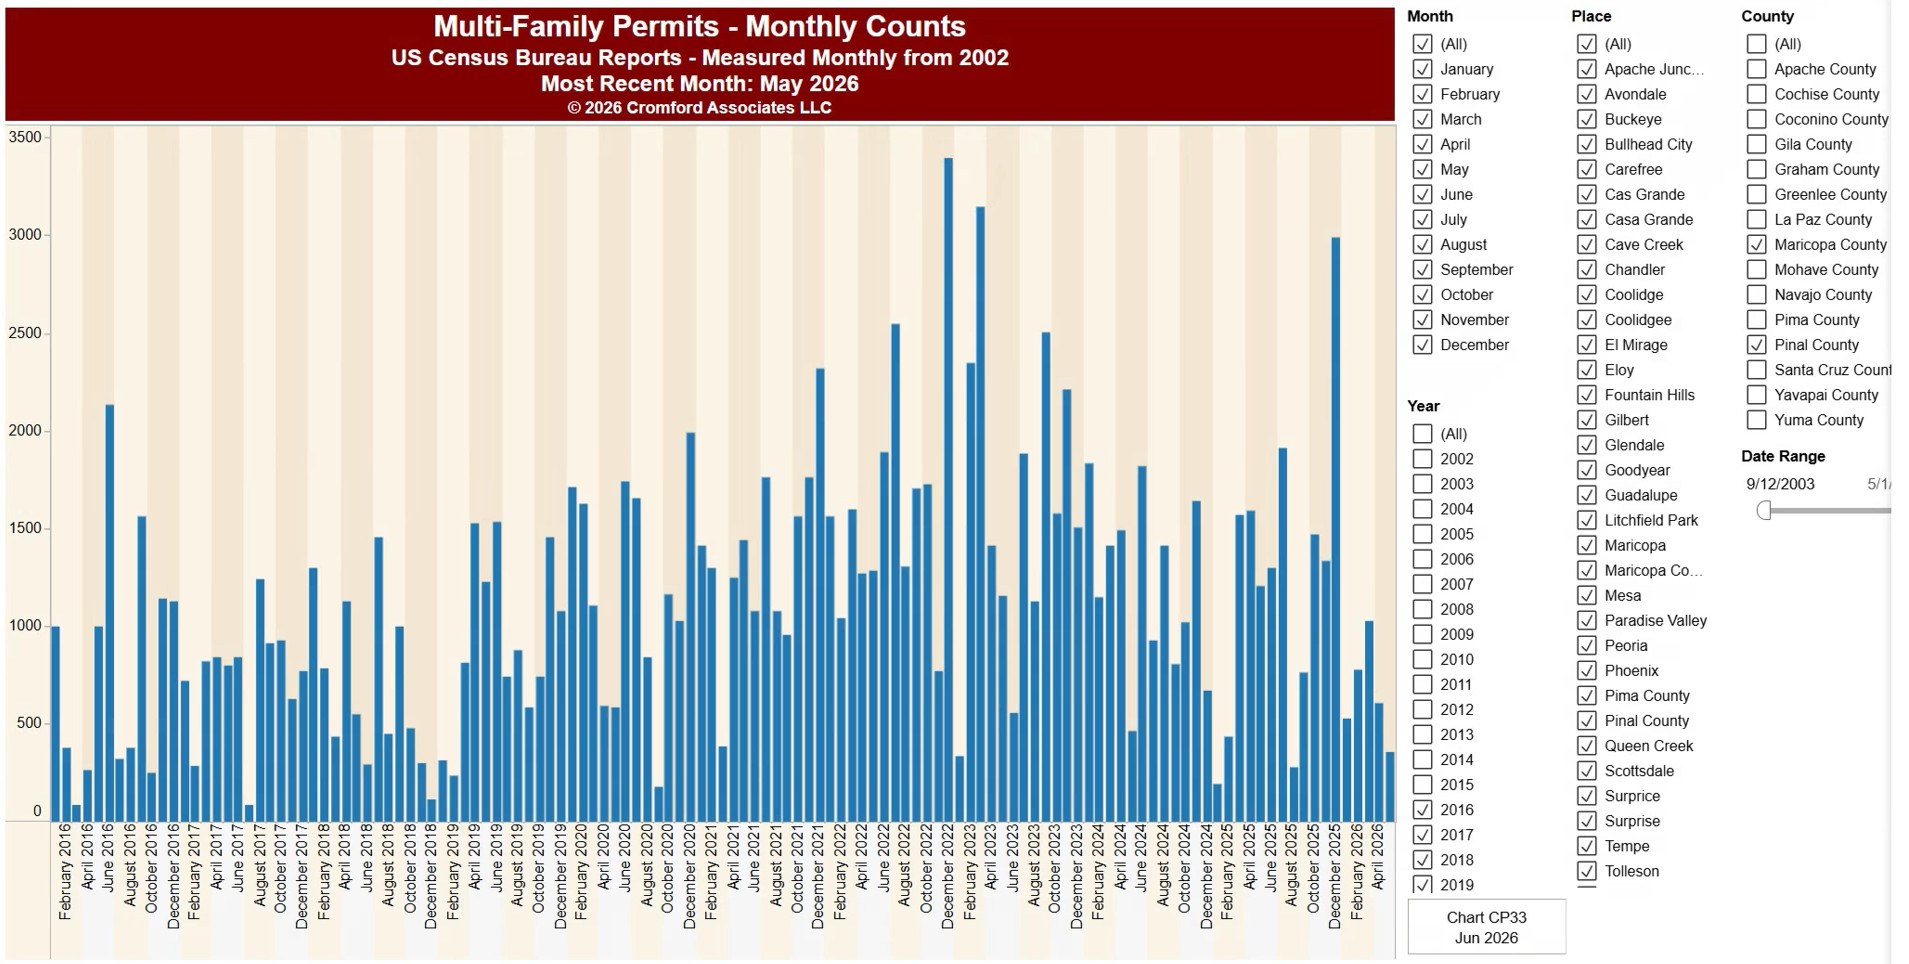
This chart shows the number of multi-family homes (apartments, condos, and other units in buildings with more than one home) authorized by building permits, from the US Census Bureau’s Building Permits Survey. Each bar is the total for one month.

It opens on Arizona with Maricopa and Pinal Counties and every city and town in them, from 2017 onwards. Choose any US state from the State list, pick counties and places, and use the Date range control to look back as far as 1996. The most recent month available is shown under the title.

Permits are an early sign of new construction, so this shows how much new multi-family housing is on the way. Hover over a bar to see its value.

Multi-Family Permits – Annual Counts

About this chart

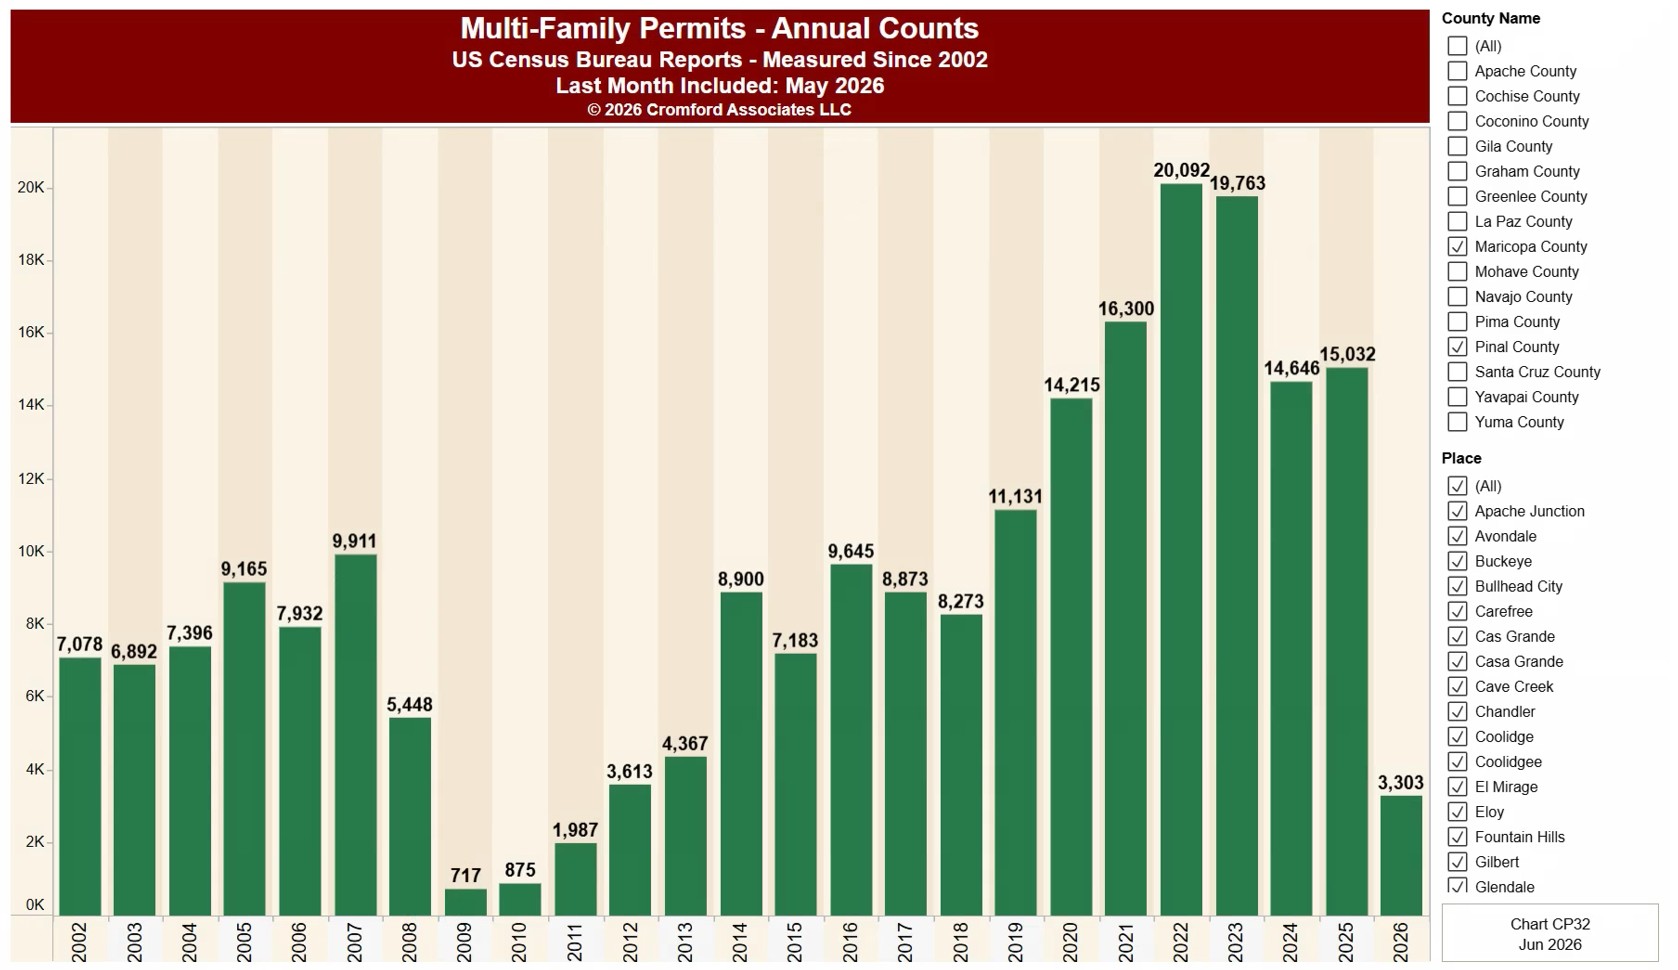
This chart shows the number of multi-family homes (apartments, condos, and other units in buildings with more than one home) authorized by building permits, from the US Census Bureau’s Building Permits Survey. Each bar is the total for one calendar year. The current year’s bar covers only the months published so far.

It opens on Arizona with Maricopa and Pinal Counties and every city and town in them, from 2017 onwards. Choose any US state from the State list, pick counties and places, and use the Date range control to look back as far as 1996. The most recent month available is shown under the title.

Permits are an early sign of new construction, so this shows how much new multi-family housing is on the way. Hover over a bar to see its value.

Multi-Family Permits – Rolling 12-Month Counts

About this chart

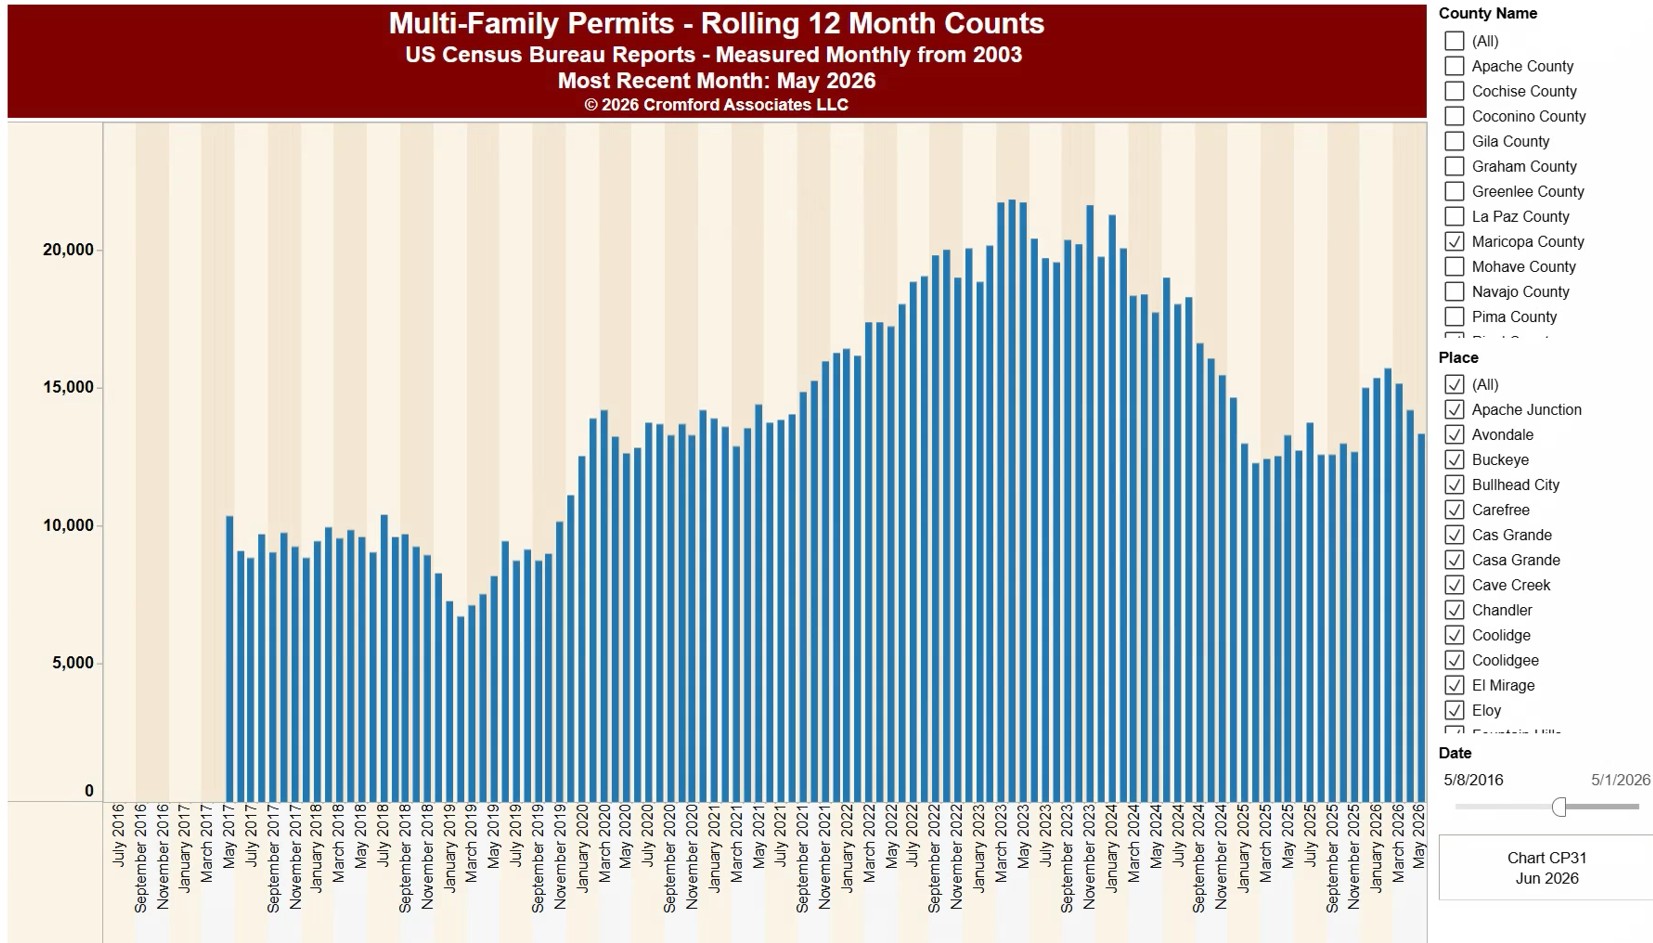
This chart shows the number of multi-family homes (apartments, condos, and other units in buildings with more than one home) authorized by building permits, from the US Census Bureau’s Building Permits Survey. Each bar is the total for the 12 months ending in that month, which smooths out seasonal swings and makes the underlying trend easy to see.

It opens on Arizona with Maricopa and Pinal Counties and every city and town in them, from 2017 onwards. Choose any US state from the State list, pick counties and places, and use the Date range control to look back as far as 1996. The most recent month available is shown under the title.

Permits are an early sign of new construction, so this shows how much new multi-family housing is on the way. Hover over a bar to see its value.

Single-Family Permits – Quarterly Counts

About this chart

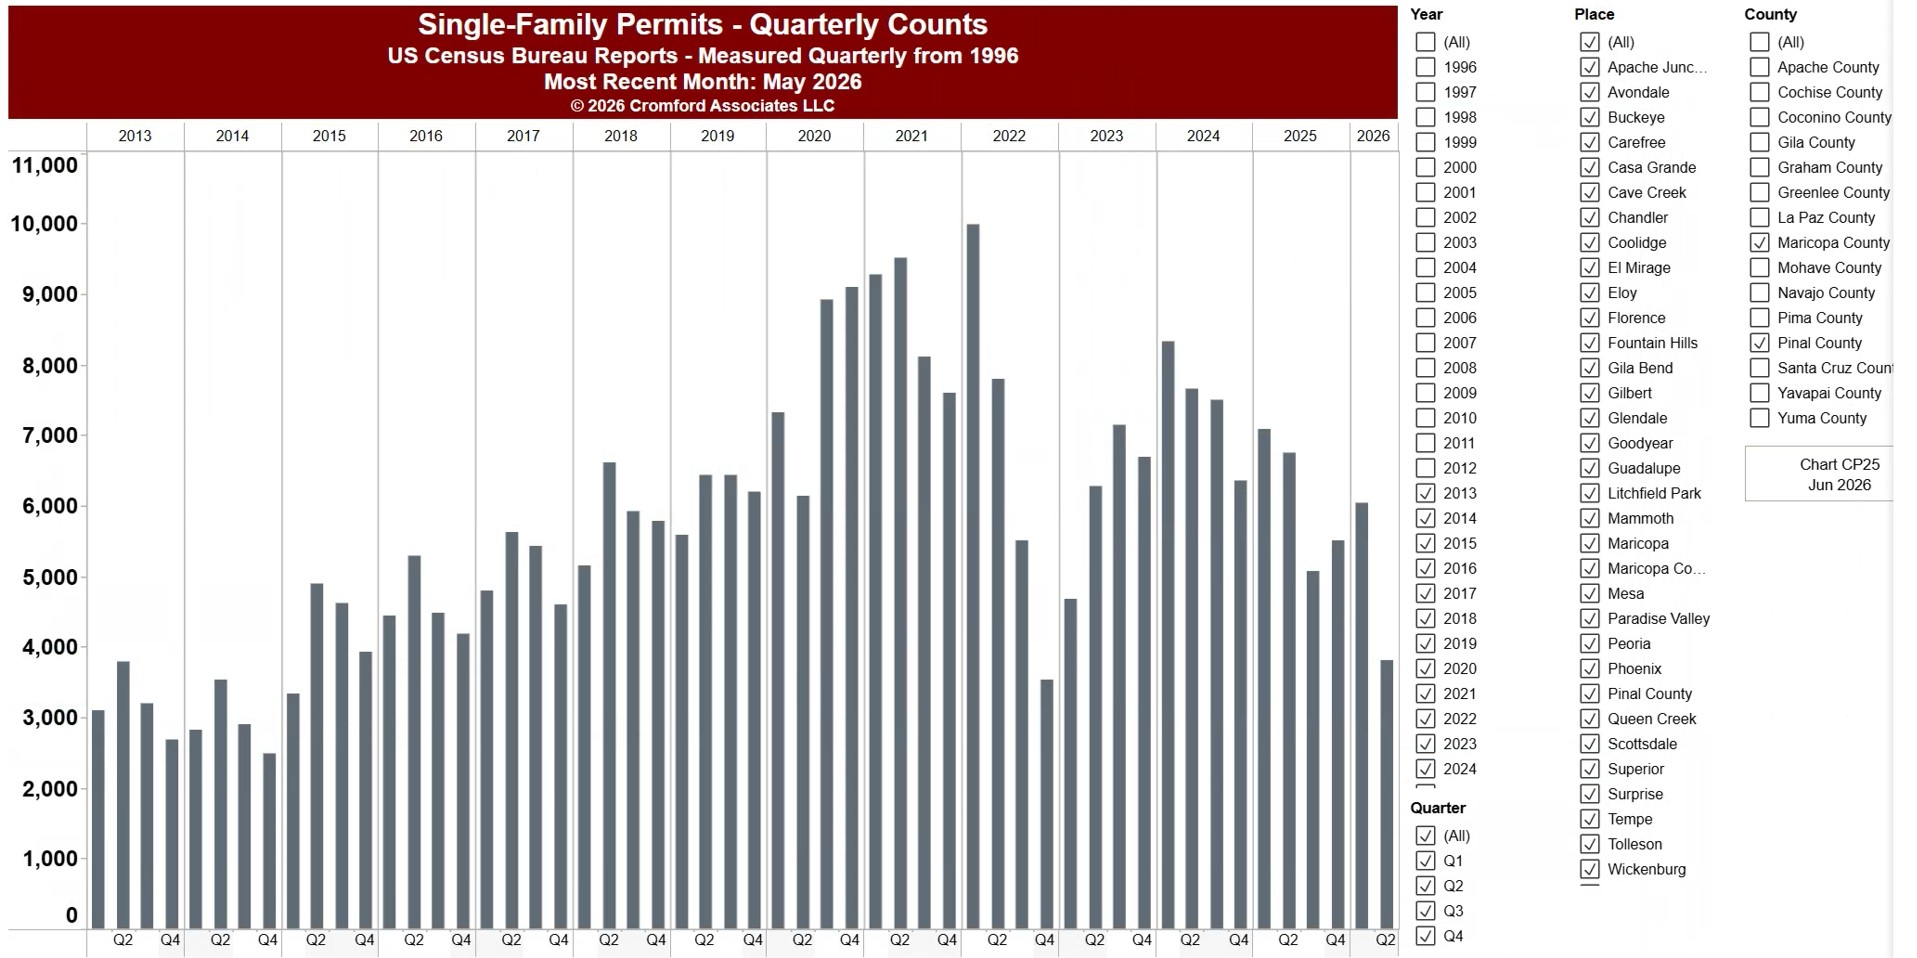
This chart shows the number of single-family homes authorized by building permits, from the US Census Bureau’s Building Permits Survey. Each bar is the total for one calendar quarter. The newest quarter may cover only the months published so far.

It opens on Arizona with Maricopa and Pinal Counties and every city and town in them, from 2017 onwards. Choose any US state from the State list, pick counties and places, and use the Date range control to look back as far as 1996. The most recent month available is shown under the title.

Permits are an early sign of new construction, so a change in this trend usually shows up in new home closings some months later. Hover over a bar to see its value.

Single-Family Permits – Year to Date

About this chart

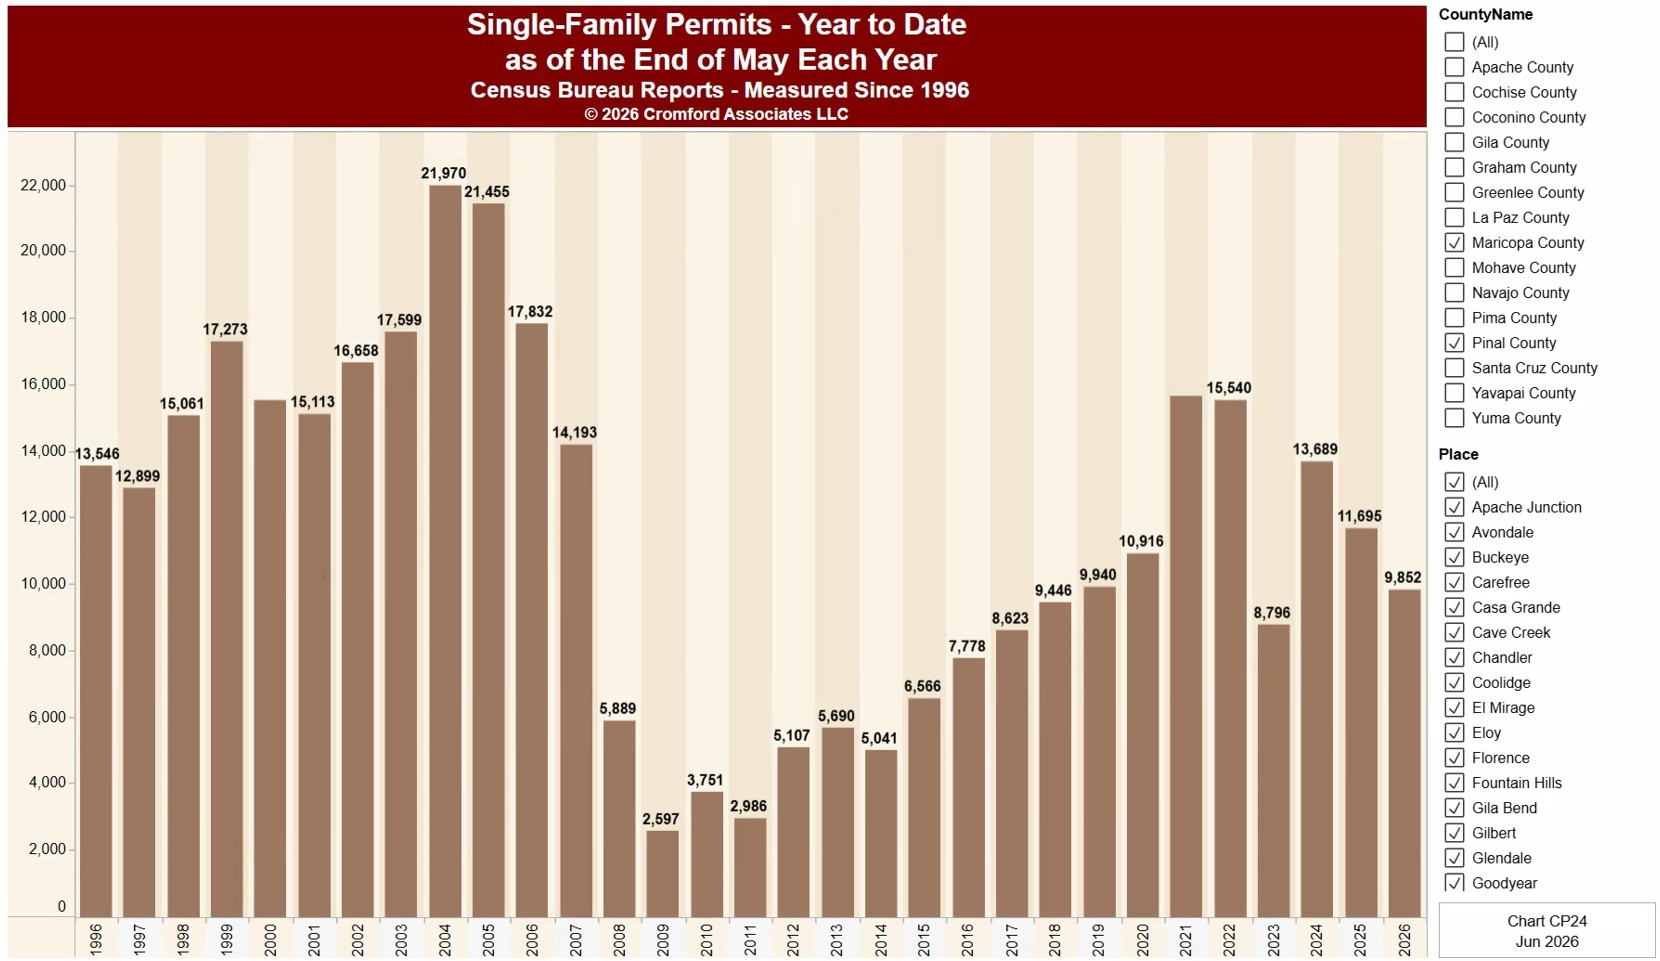
This chart shows the number of single-family homes authorized by building permits, from the US Census Bureau’s Building Permits Survey. Each bar is one year’s total from January to the latest month published, with every year cut to the same months, so the current year can be compared fairly with earlier ones.

It opens on Arizona with Maricopa and Pinal Counties and every city and town in them, from 2017 onwards. Choose any US state from the State list, pick counties and places, and use the Date range control to look back as far as 1996. The most recent month available is shown under the title.

Permits are an early sign of new construction, so a change in this trend usually shows up in new home closings some months later. Hover over a bar to see its value.

Single-Family Permits – Monthly Counts

About this chart

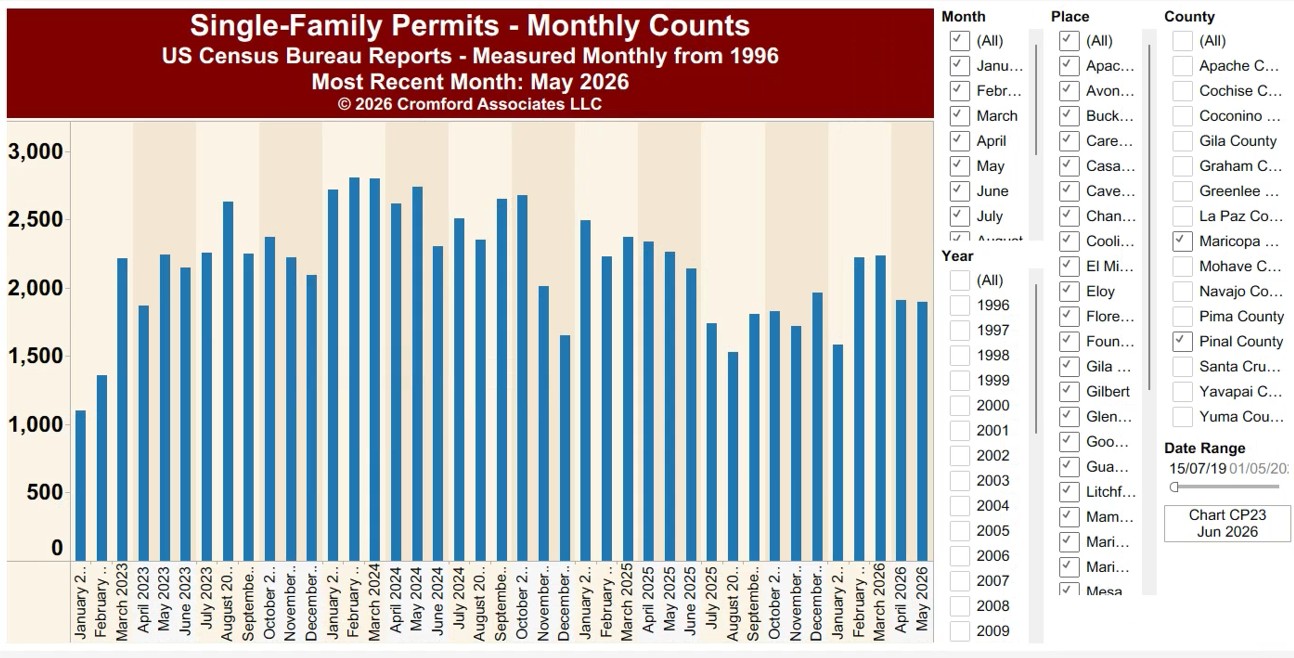
This chart shows the number of single-family homes authorized by building permits, from the US Census Bureau’s Building Permits Survey. Each bar is the total for one month.

It opens on Arizona with Maricopa and Pinal Counties and every city and town in them, from 2017 onwards. Choose any US state from the State list, pick counties and places, and use the Date range control to look back as far as 1996. The most recent month available is shown under the title.

Permits are an early sign of new construction, so a change in this trend usually shows up in new home closings some months later. Hover over a bar to see its value.

Single-Family Permits – Annual Counts

About this chart

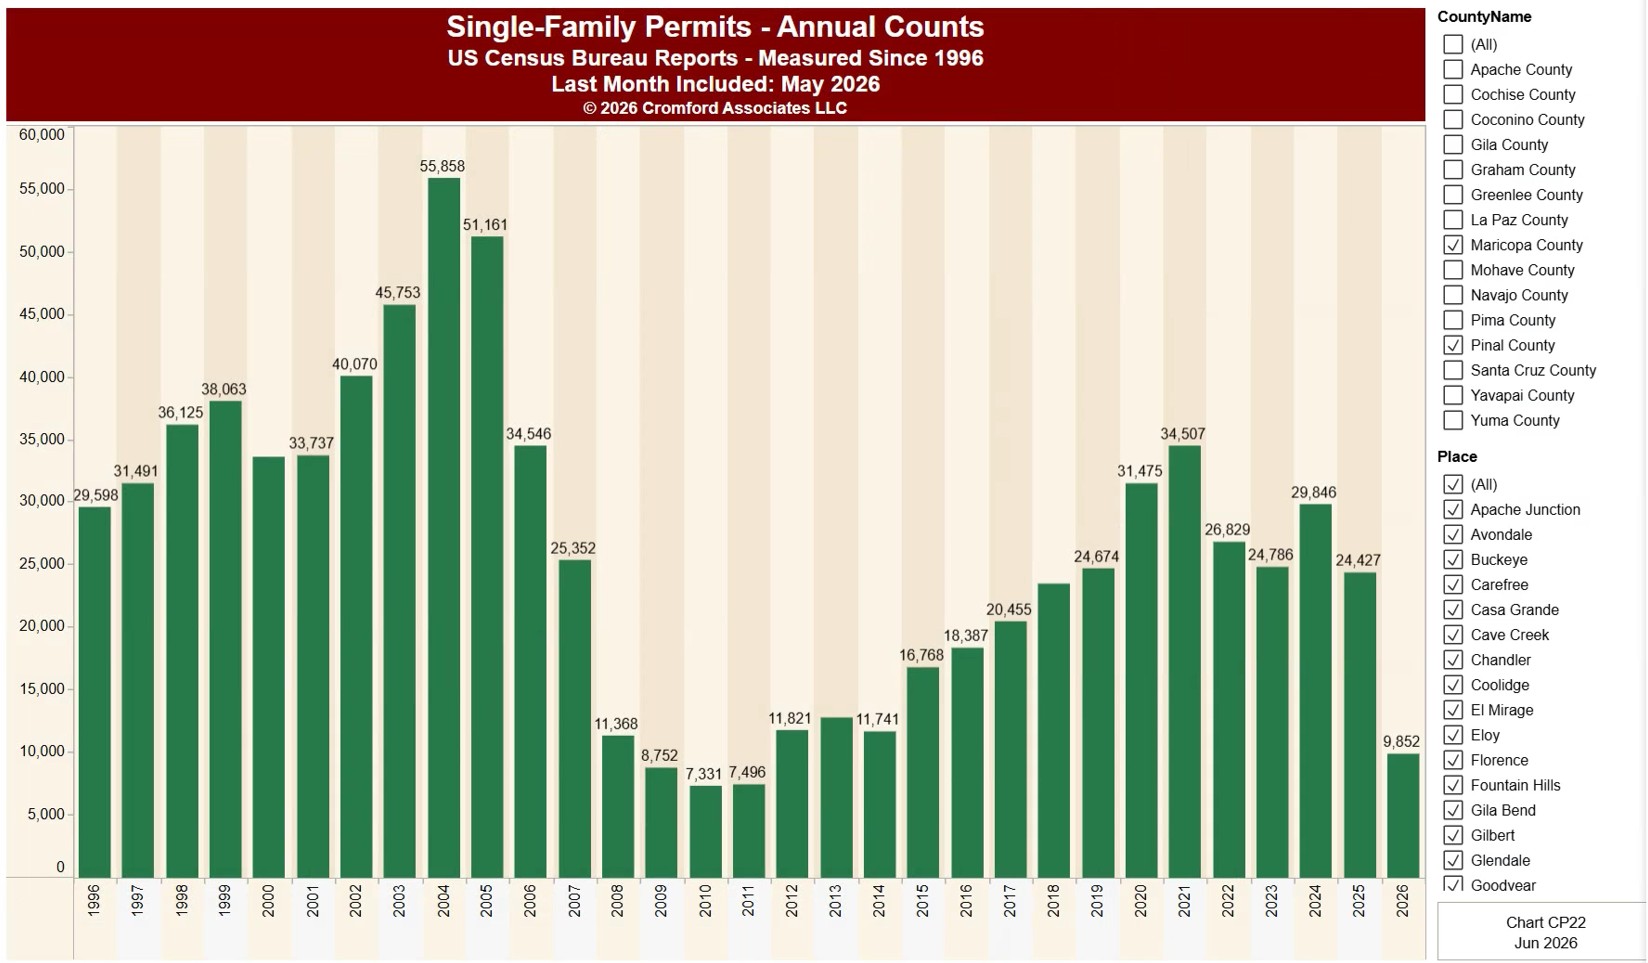
This chart shows the number of single-family homes authorized by building permits, from the US Census Bureau’s Building Permits Survey. Each bar is the total for one calendar year. The current year’s bar covers only the months published so far.

It opens on Arizona with Maricopa and Pinal Counties and every city and town in them, from 2017 onwards. Choose any US state from the State list, pick counties and places, and use the Date range control to look back as far as 1996. The most recent month available is shown under the title.

Permits are an early sign of new construction, so a change in this trend usually shows up in new home closings some months later. Hover over a bar to see its value.