
About this chart
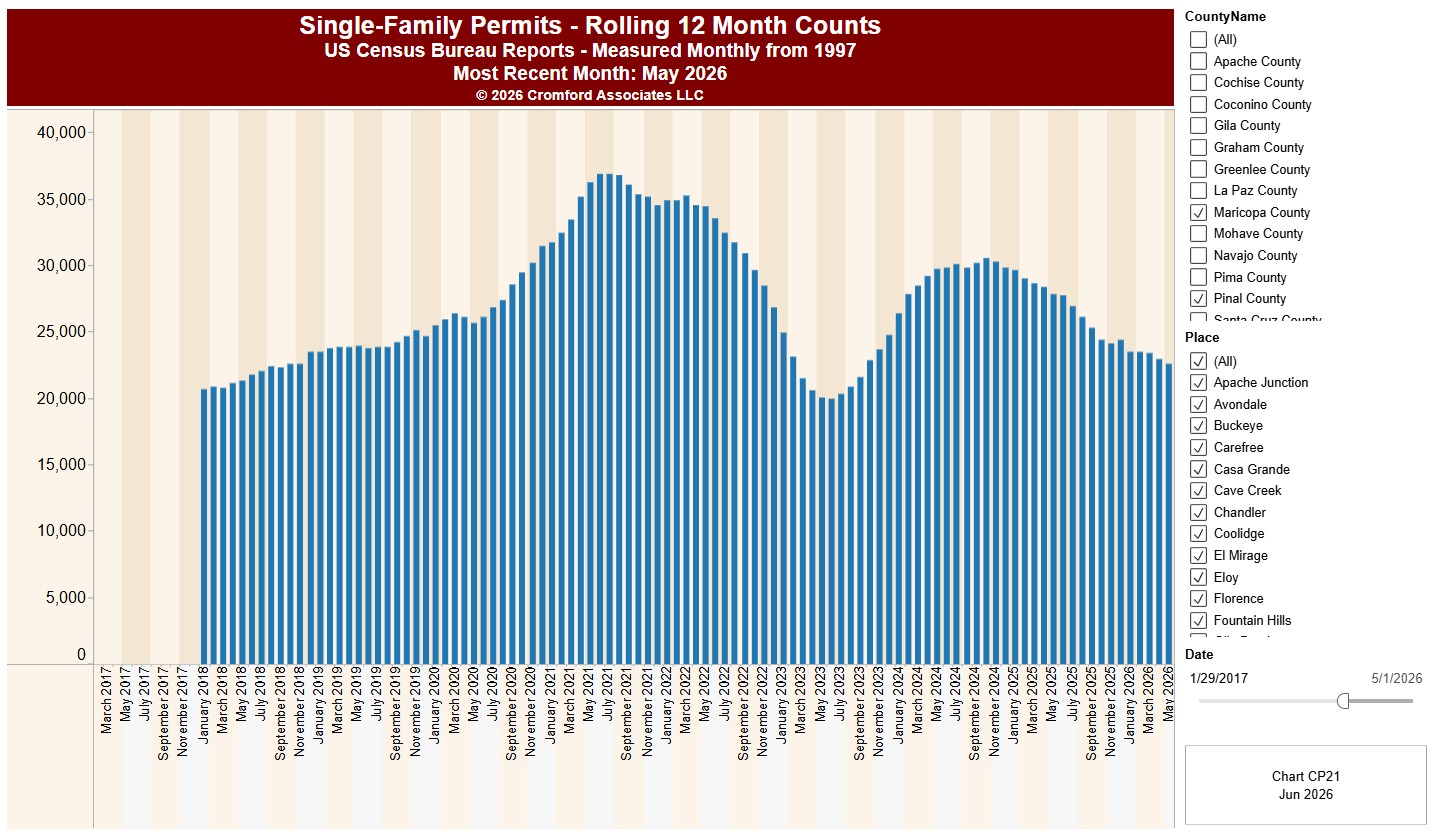
This chart shows the number of single-family homes authorized by building permits, from the US Census Bureau’s Building Permits Survey. Each bar is the total for the 12 months ending in that month, which smooths out seasonal swings and makes the underlying trend easy to see.
It opens on Arizona with Maricopa and Pinal Counties and every city and town in them, from 2017 onwards. Choose any US state from the State list, pick counties and places, and use the Date range control to look back as far as 1996. The most recent month available is shown under the title.
Permits are an early sign of new construction, so a change in this trend usually shows up in new home closings some months later. Hover over a bar to see its value.