Phoenix Urban Village Snapshot

About this chart

This table shows 38 measures of the market for single-family detached homes in each of 14 of the City of Phoenix’s urban villages, one village at a time. Pick the village from the box at the top. Rio Vista, the fifteenth village, has too few sales to include.

Each measure is shown today, a month ago, a quarter ago, a year ago, and two years ago, and earlier dates back to January 2018 can be chosen from the date box. The ST and LT marks compare today with last month and with last year, colored by whether the change favors sellers or buyers.

Urban villages are planning areas inside the City of Phoenix, so every home in them is also counted in Phoenix. Laveen Urban Village is not the same as the postal city of Laveen, and Paradise Valley Urban Village is not the Town of Paradise Valley.
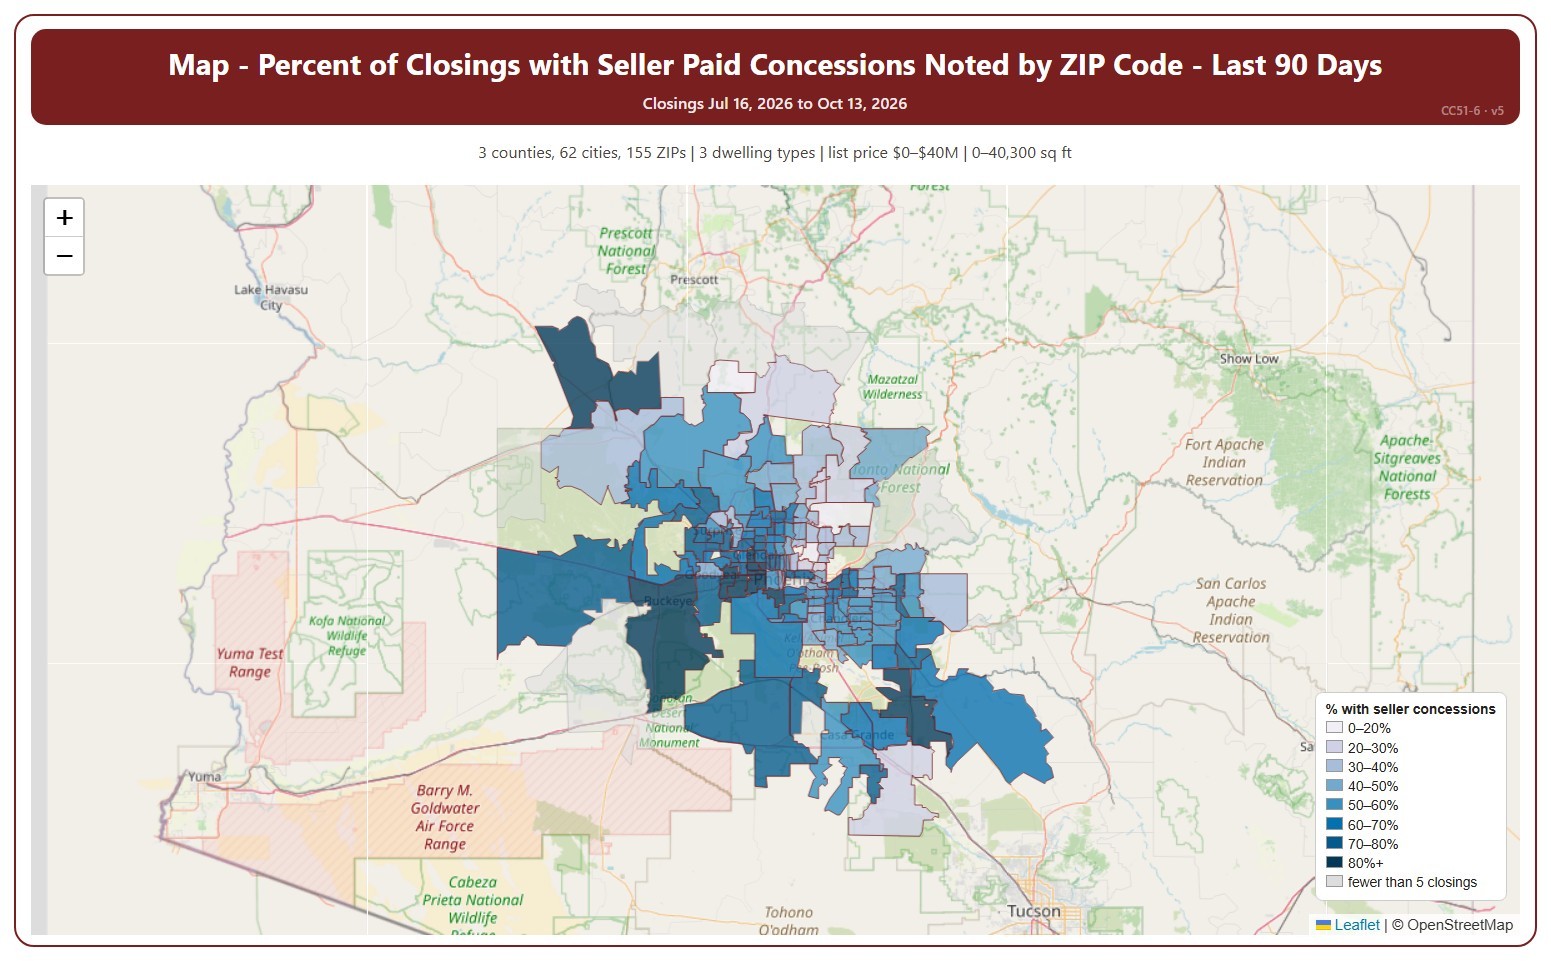
Map – Percent of Closings with Seller Paid Concessions Noted by ZIP Code

About this chart

This map shades each ZIP code by the percentage of recent closings that had a seller-paid concession noted, darker for a higher share. A seller-paid concession is money the seller agrees to pay toward the buyer’s closing costs or other expenses, as noted on the ARMLS listing when it closes.

It opens on the last 90 days. Use the Period panel to switch between the last 30 and the last 90 days. The heading shows the exact dates covered. The chart is updated every day. ZIP codes with fewer than 5 closings in the period are shown in grey without a percentage.

It opens on the Greater Phoenix area: the counties, cities, and ZIP codes that make it up are ticked to start with. Tick or untick any of them to change the area, including counties beyond Greater Phoenix. Narrow it further with the Dwelling Type, Transaction Type, and New / Resale boxes and the list price, home size, and year built sliders.

Hover over a ZIP code to see its figures.

Percent of Closings with Seller Paid Concessions Noted by ZIP Code

About this chart

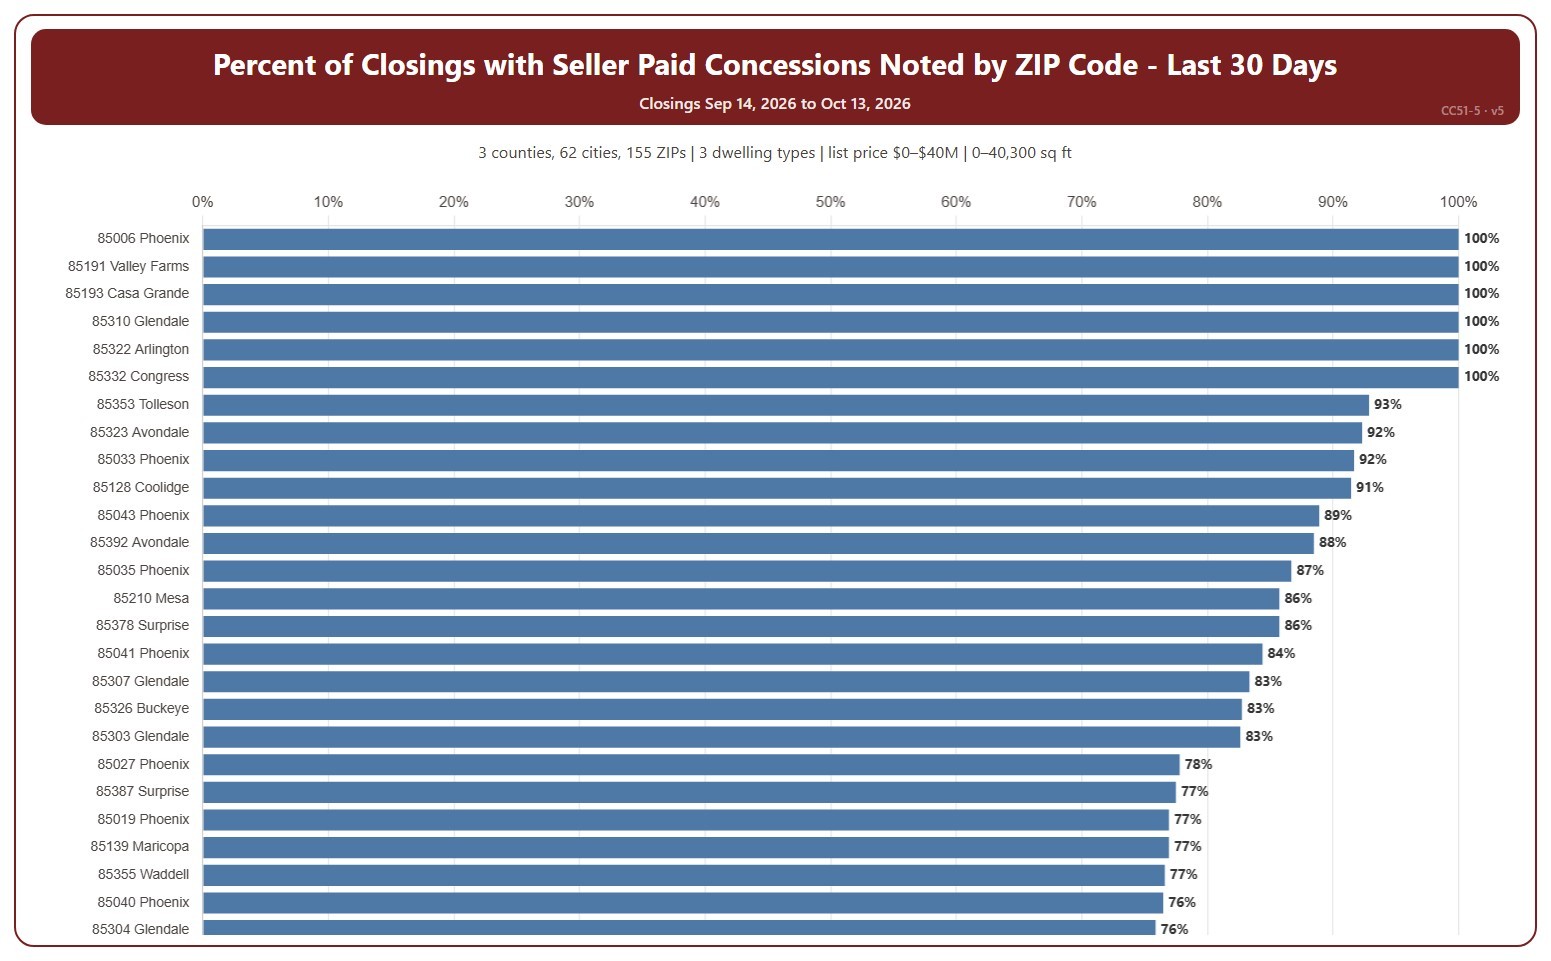
This chart ranks ZIP codes by the percentage of recent closings that had a seller-paid concession noted, highest first. A seller-paid concession is money the seller agrees to pay toward the buyer’s closing costs or other expenses, as noted on the ARMLS listing when it closes.

It opens on the last 30 days. Use the Period panel to switch between the last 30 and the last 90 days. The heading shows the exact dates covered. The chart is updated every day. A ZIP code with only a few closings can show 0% or 100%; the tooltip gives the count. Scroll inside the chart to see every ZIP code.

It opens on the Greater Phoenix area: the counties, cities, and ZIP codes that make it up are ticked to start with. Tick or untick any of them to change the area, including counties beyond Greater Phoenix. Narrow it further with the Dwelling Type, Transaction Type, and New / Resale boxes and the list price, home size, and year built sliders.

Hover over a bar to see the closings with a concession, the total, and the median concession.

Percent of Closings with Seller Paid Concessions Noted by City

About this chart

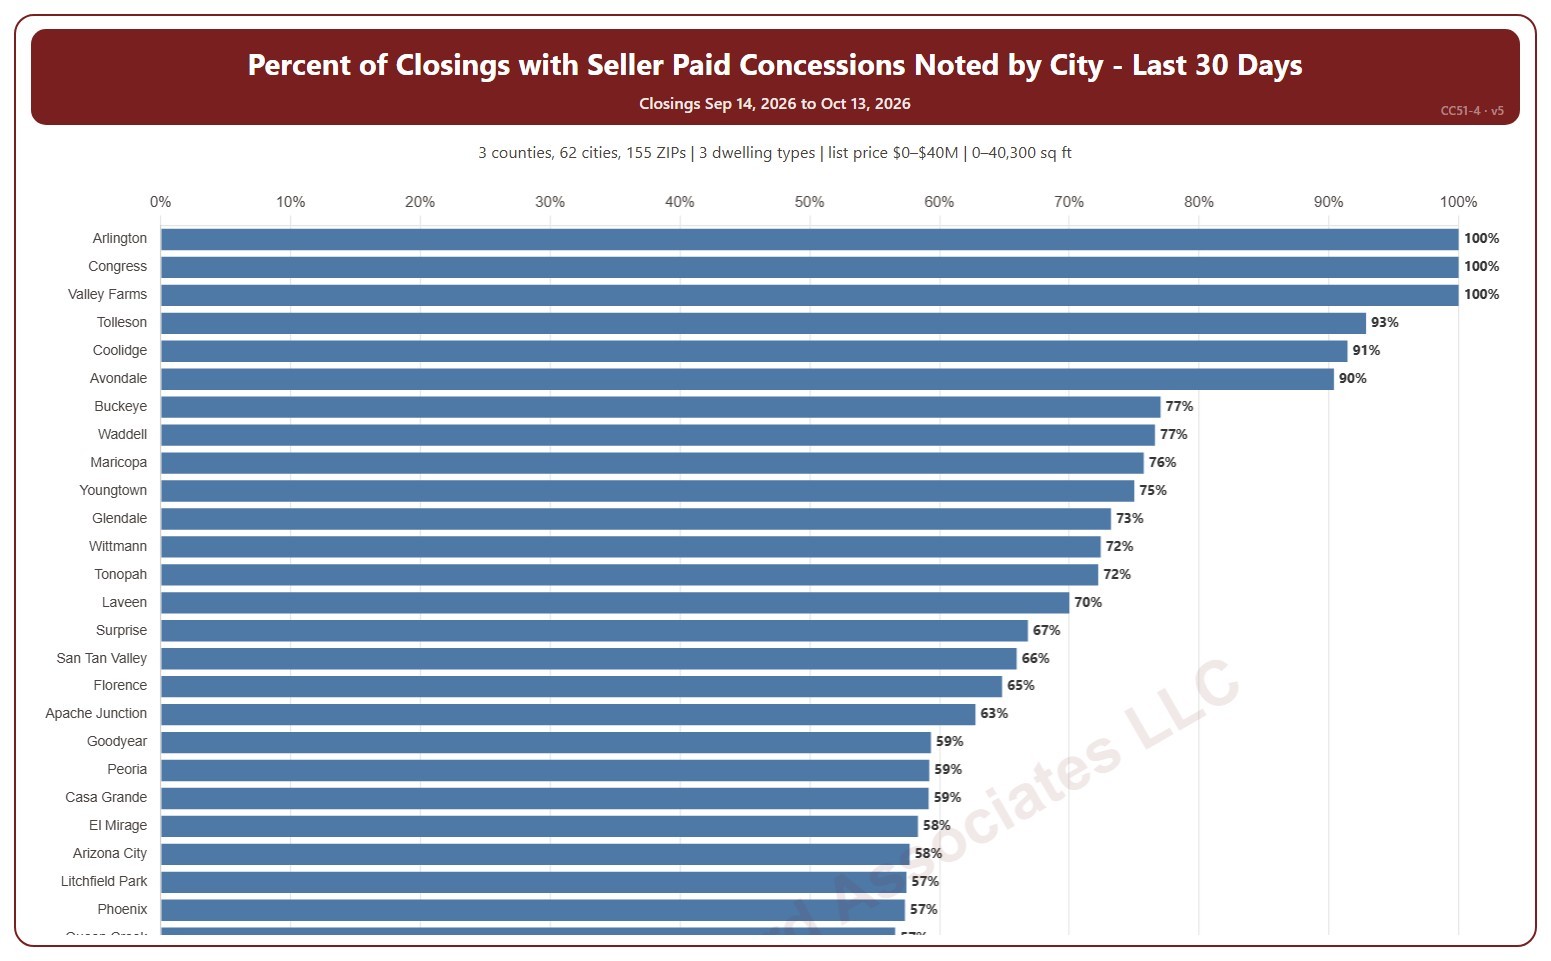
This chart ranks cities by the percentage of recent closings that had a seller-paid concession noted, highest first. A seller-paid concession is money the seller agrees to pay toward the buyer’s closing costs or other expenses, as noted on the ARMLS listing when it closes.

It opens on the last 30 days. Use the Period panel to switch between the last 30 and the last 90 days. The heading shows the exact dates covered. The chart is updated every day. A city with only a few closings can show 0% or 100%; the tooltip gives the count. Scroll inside the chart to see every city.

It opens on the Greater Phoenix area: the counties, cities, and ZIP codes that make it up are ticked to start with. Tick or untick any of them to change the area, including counties beyond Greater Phoenix. Narrow it further with the Dwelling Type, Transaction Type, and New / Resale boxes and the list price, home size, and year built sliders.

Hover over a bar to see the closings with a concession, the total, and the median concession.

Percent of Closings with Seller Paid Concessions Noted by List Price Range

About this chart

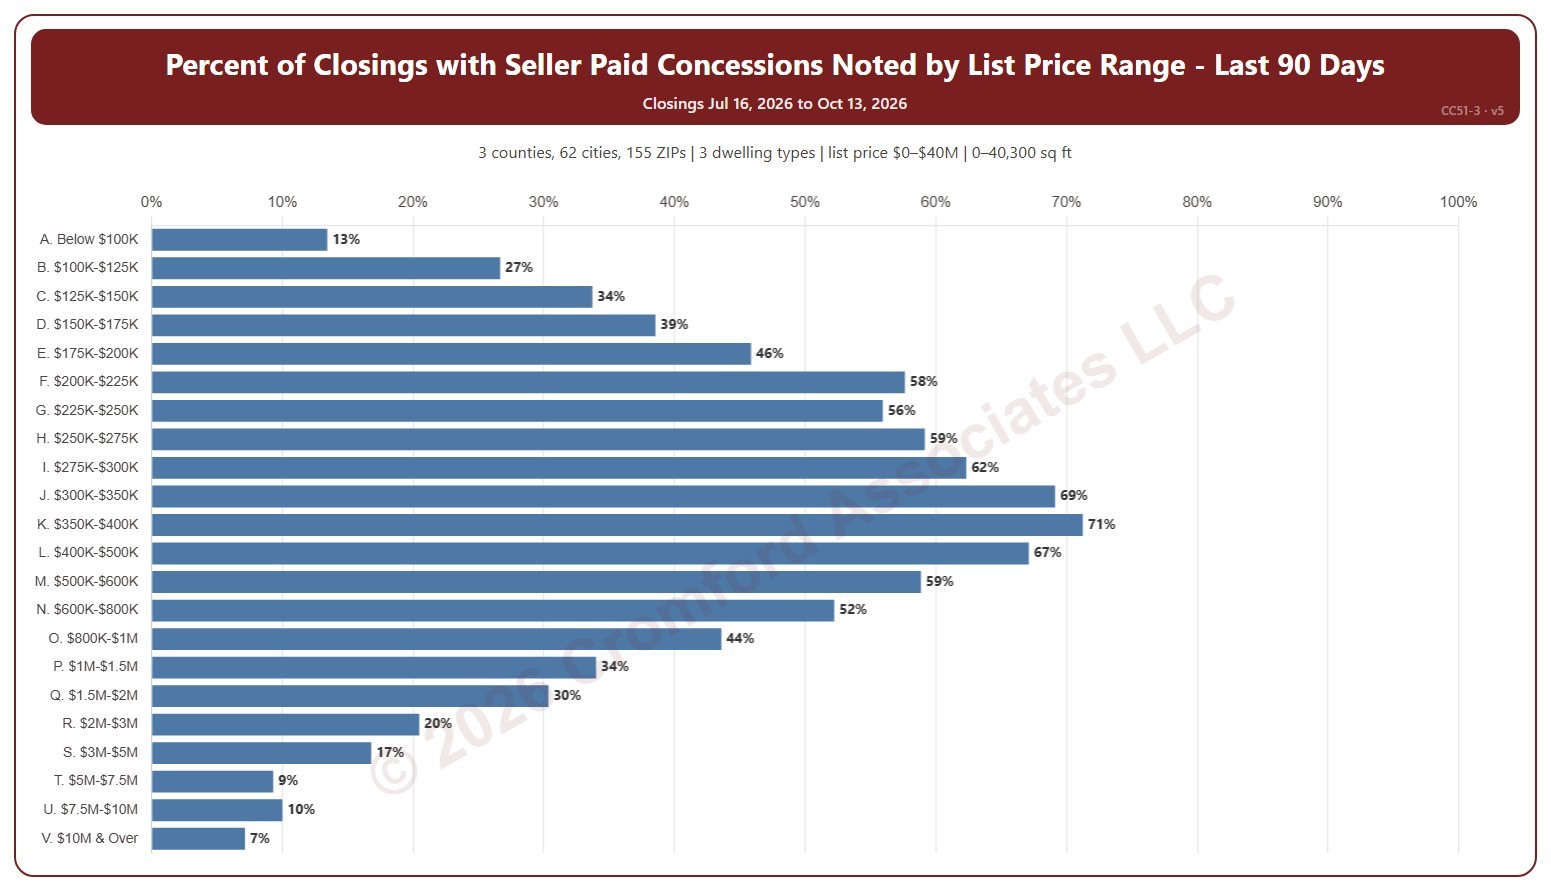
This chart shows the percentage of recent closings that had a seller-paid concession noted, for each of 22 list price ranges from below $100K to $10M and over. A seller-paid concession is money the seller agrees to pay toward the buyer’s closing costs or other expenses, as noted on the ARMLS listing when it closes.

It opens on the last 90 days. Use the Period panel to switch between the last 30 and the last 90 days. The heading shows the exact dates covered. The chart is updated every day.

It opens on the Greater Phoenix area: the counties, cities, and ZIP codes that make it up are ticked to start with. Tick or untick any of them to change the area, including counties beyond Greater Phoenix. Narrow it further with the Dwelling Type, Transaction Type, and New / Resale boxes and the list price, home size, and year built sliders.

Hover over a bar to see the closings with a concession, the total, and the median concession.

Extreme Statistics

About this chart

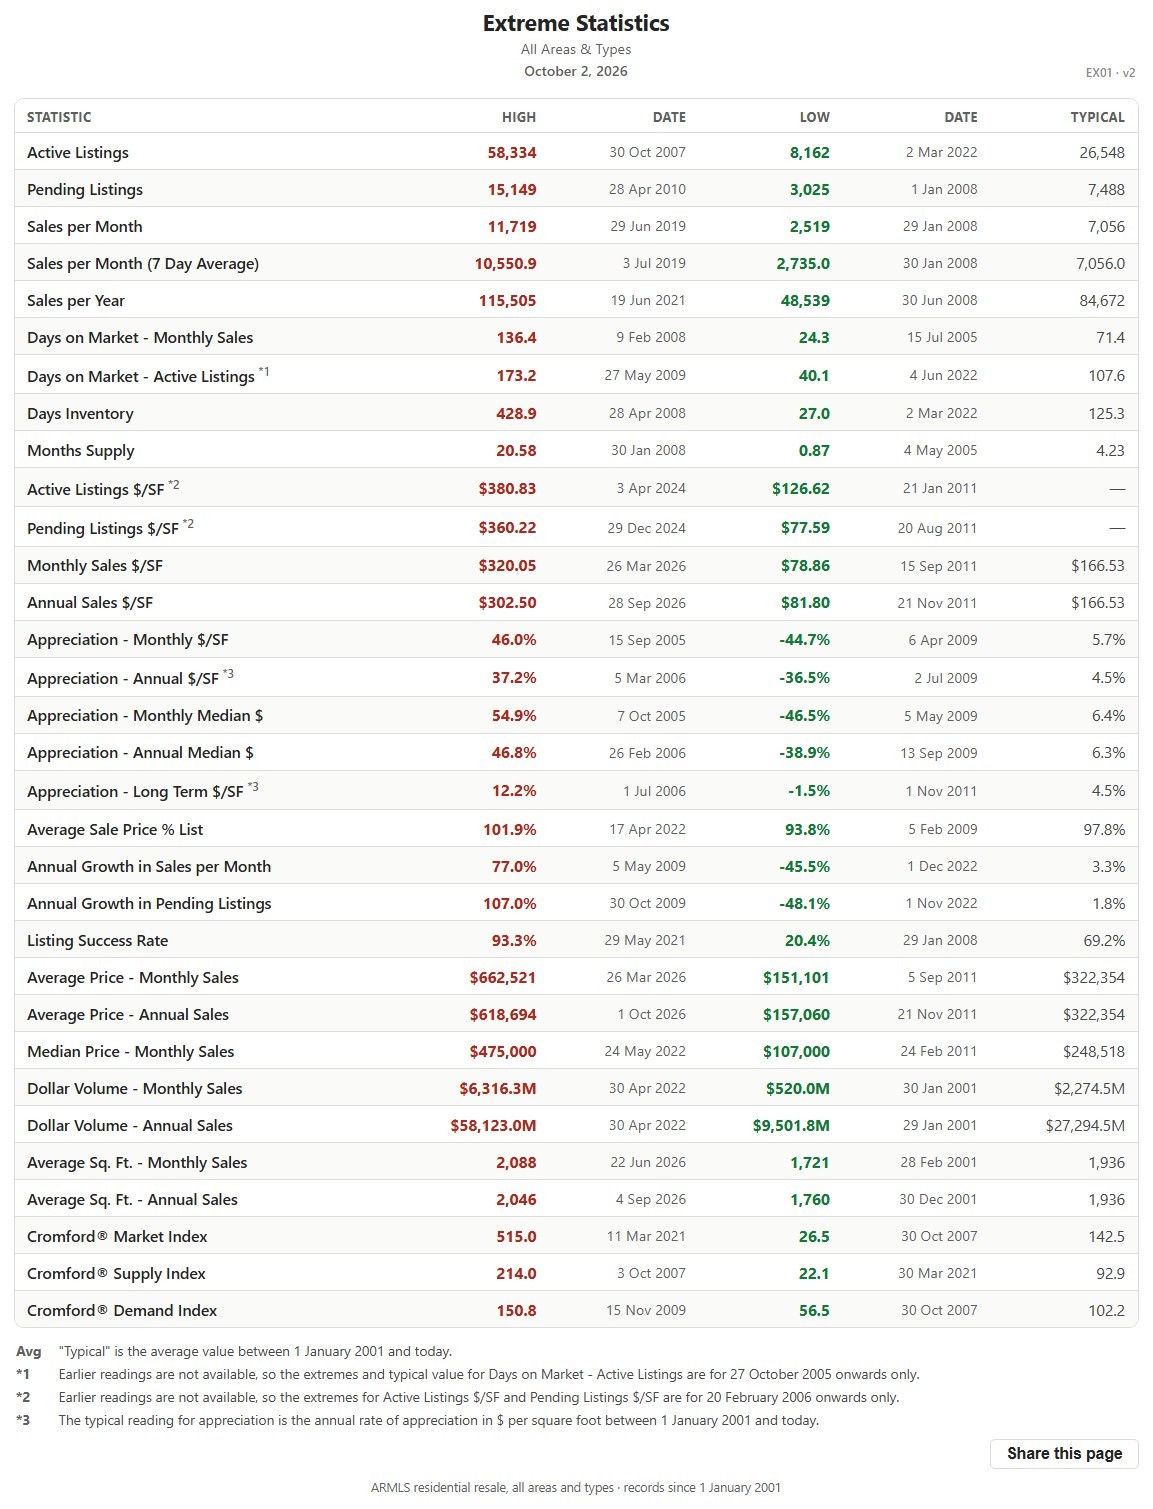
This table lists the record high and record low of more than 30 market measures for the whole ARMLS market, all areas and all dwelling types, each with the date it happened, since January 1, 2001, together with a typical value for comparison.

It shows how extreme past markets have been and what a typical reading looks like, a yardstick for the current figures on the other charts. The numbered notes under the table explain the few measures that are counted differently.

Cromford® Market Index by City – Gauges

About this chart

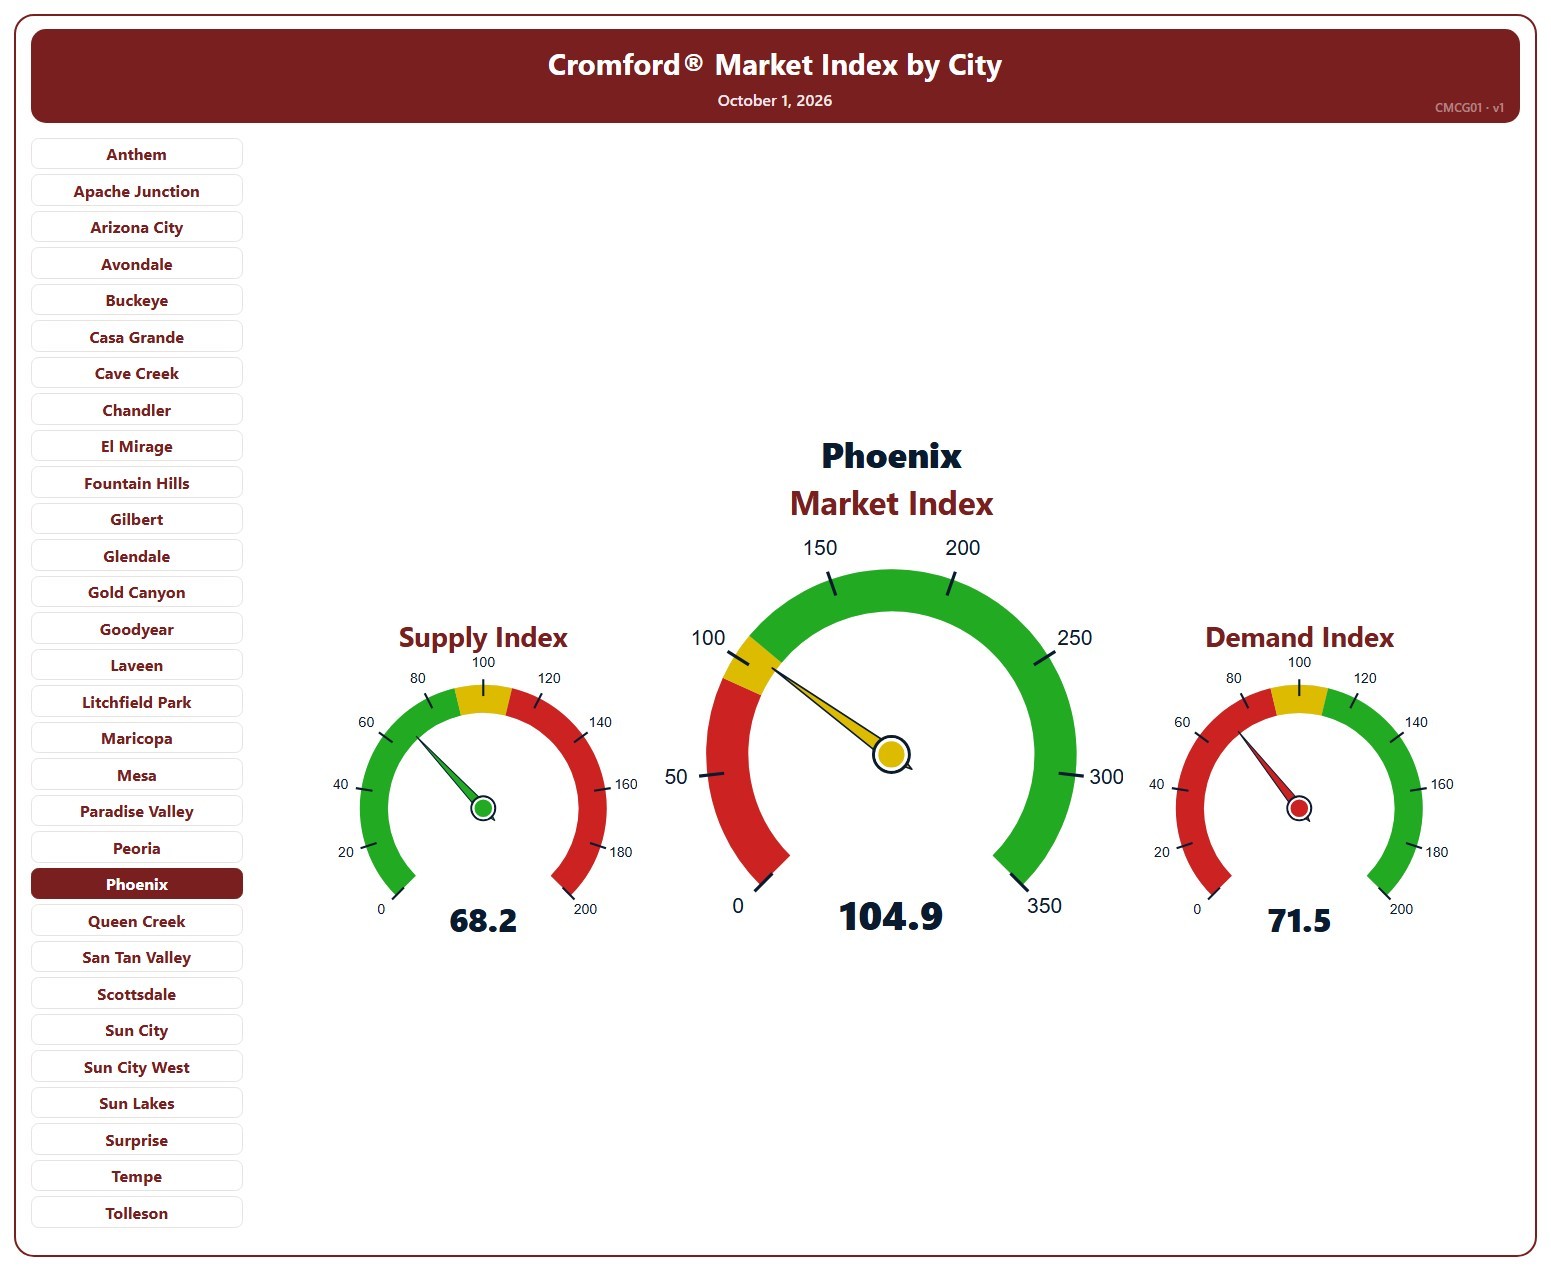
This page shows three gauges for one city: the Cromford® Supply Index, Market Index, and Demand Index at their latest reading, for single-family detached resale homes on ARMLS. It opens on Phoenix; pick any of the 34 cities from the list.

Each dial has three bands, below 90, 90 to 110, and above 110, and the needle takes the color of the band it points into. On the Market and Demand dials green is above 110 and red below 90; on the Supply dial the colors are reversed, because low supply favors sellers.

A Market Index below 90 indicates a buyer’s market, above 110 a seller’s market, and between 90 and 110 a balanced market.

Cromford® Market Index – Last 6 Months

About this chart

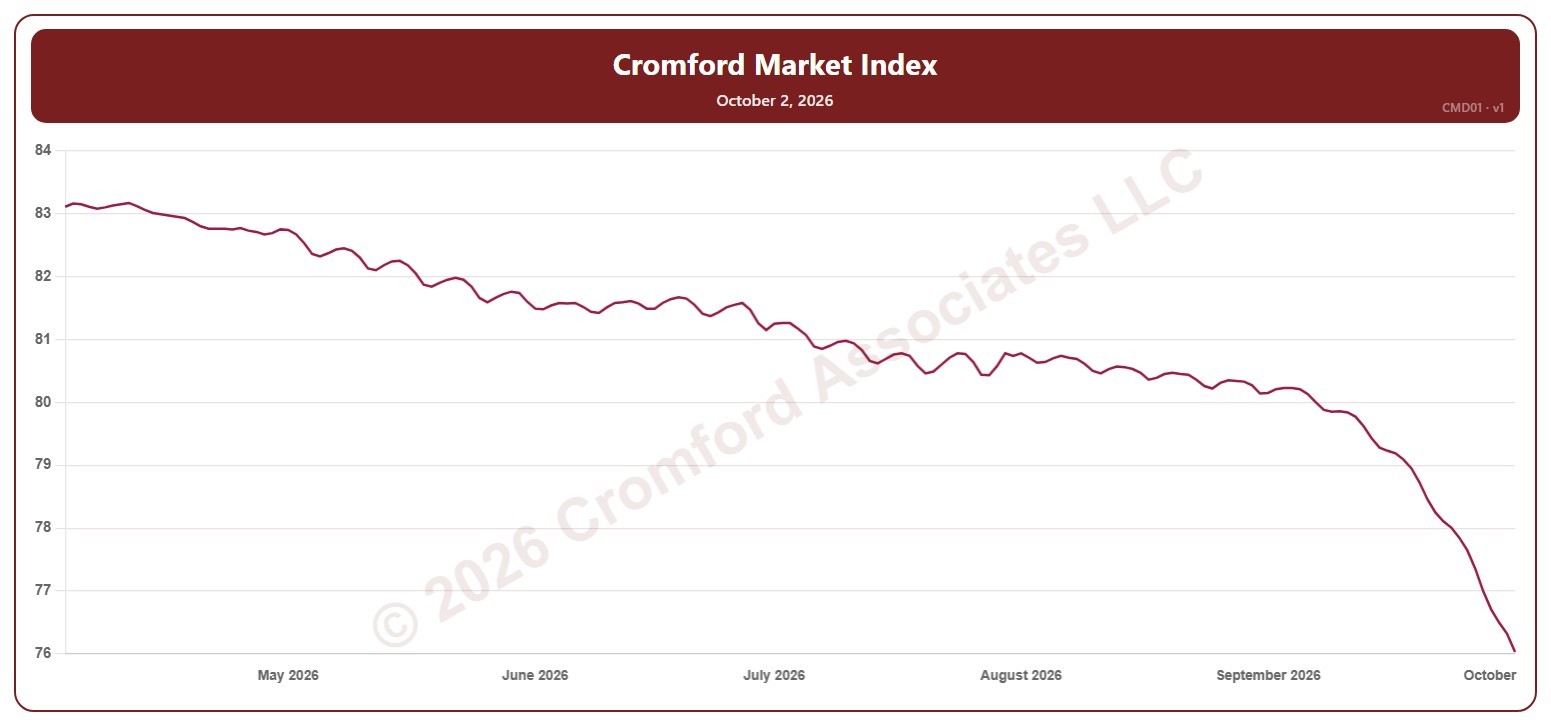
This chart shows the Cromford® Market Index for the whole ARMLS market, all areas and all dwelling types, every day over the last six months. A reading below 90 indicates a buyer’s market, above 110 a seller’s market, and between 90 and 110 a balanced market.

Hover over the line to see the exact figure for that day.

Average List Price per Square Foot – Two Month View – Daily

About this chart

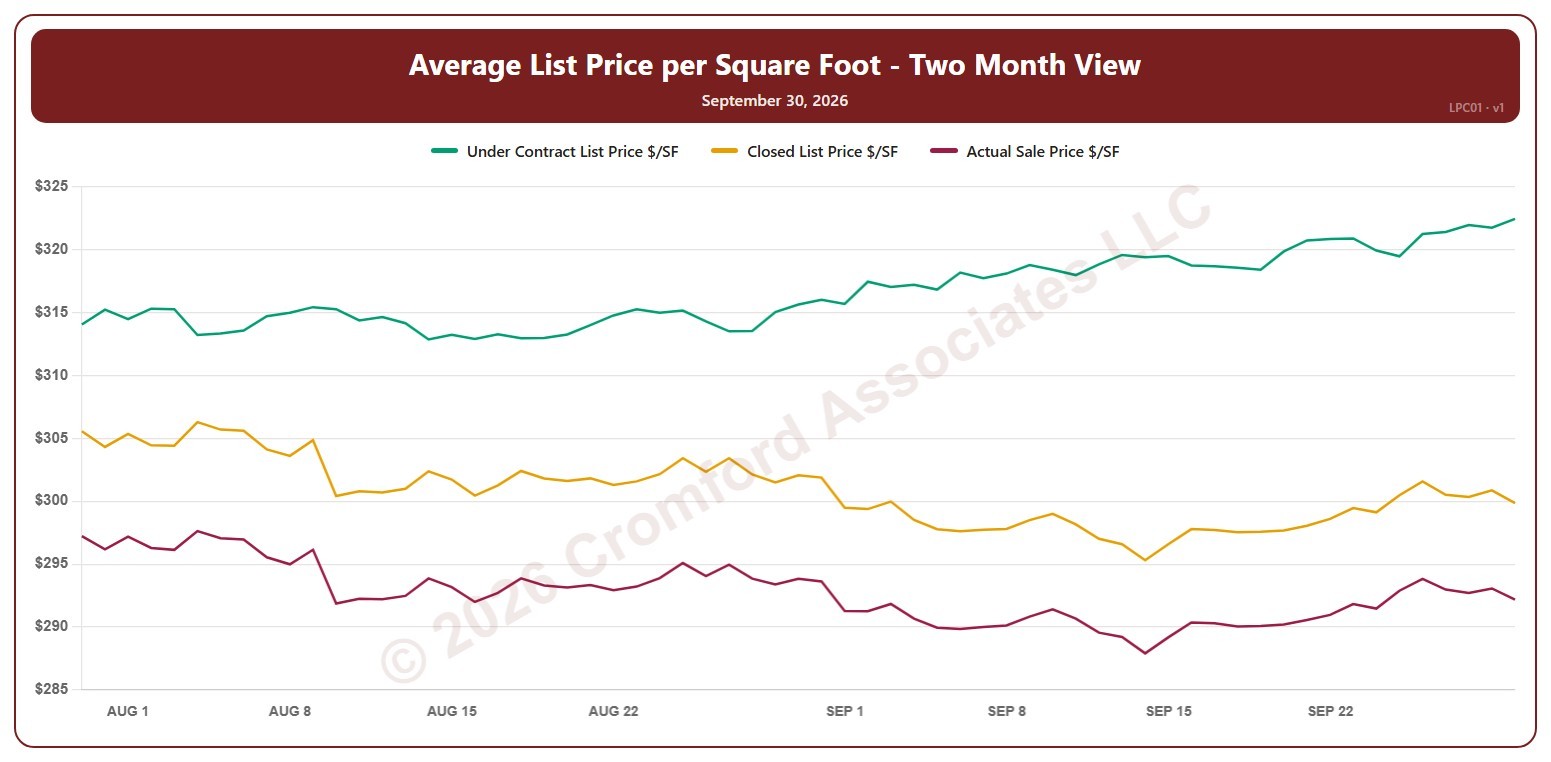
This chart shows three average prices per square foot for the whole ARMLS market, all areas and all dwelling types, every day over the last two months: the list price of listings under contract, the final list price of the homes that closed in the month up to that day, and the price those homes actually sold for. The gap between the lines shows how far buyers are paying above or below the asking price.

Click the buttons above the chart to show or hide each line. Hover over the chart to see each figure for that day.

Average List Price per Square Foot – Last 6 Months

About this chart

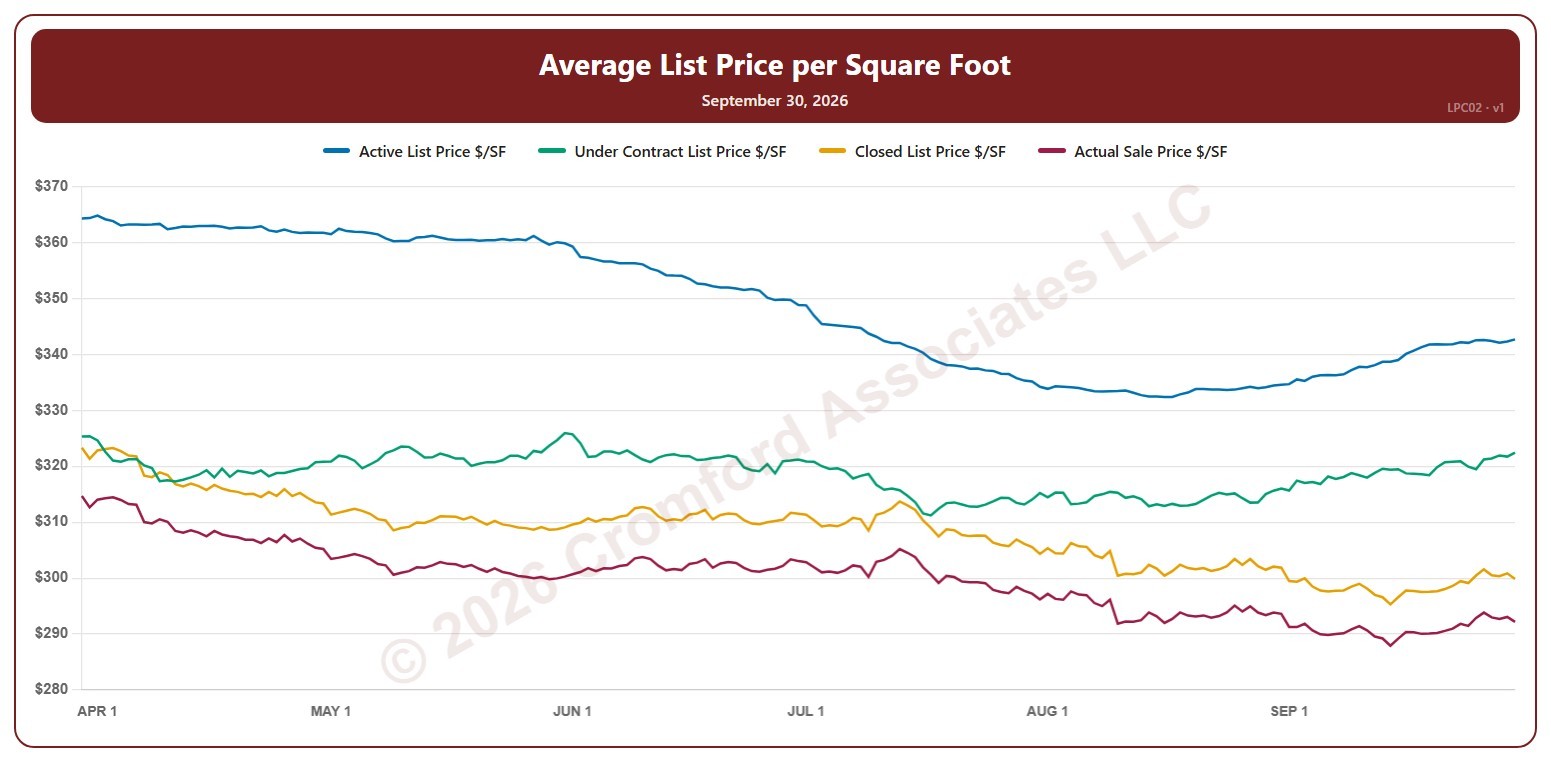
This chart shows four average prices per square foot for the whole ARMLS market, all areas and all dwelling types, every day over the last six months: the list price of active listings, the list price of listings under contract, the final list price of the homes that closed in the month up to that day, and the price those homes actually sold for. Reading them together shows the path from what sellers ask to what buyers pay.

Click the buttons above the chart to show or hide each line. Hover over the chart to see each figure for that day.