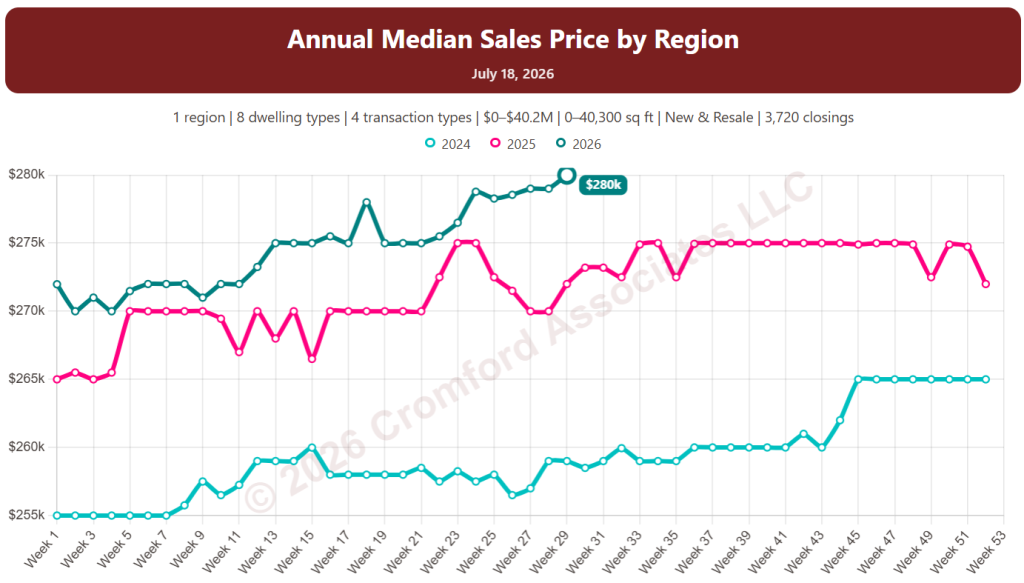
If we look at the annual median sales price across Greater Phoenix, we can see that it has been close to $450,000 for a very long time. However, it just reached a high of $454,000 on July 18, suggesting that homes are getting slightly more expensive. This is because the chart (and most people) ignore the falling buying power of the US currency. Doing otherwise can make you miserable and worried.
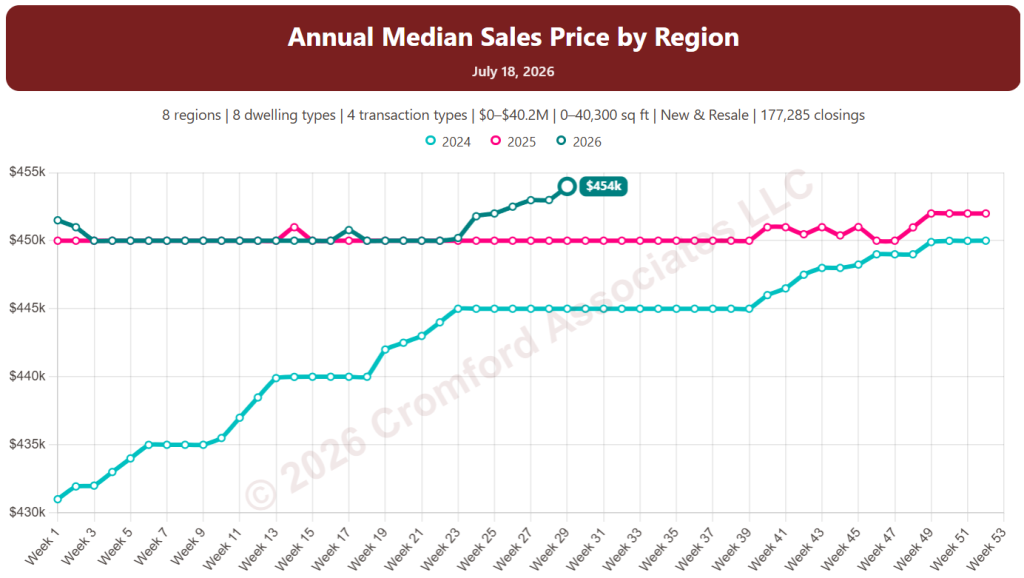
I fearlessly converted the nominal dollars in the chart to inflation-adjusted dollars, based on the Phoenix Consumer Price Index, with June 2026 as the base reading.
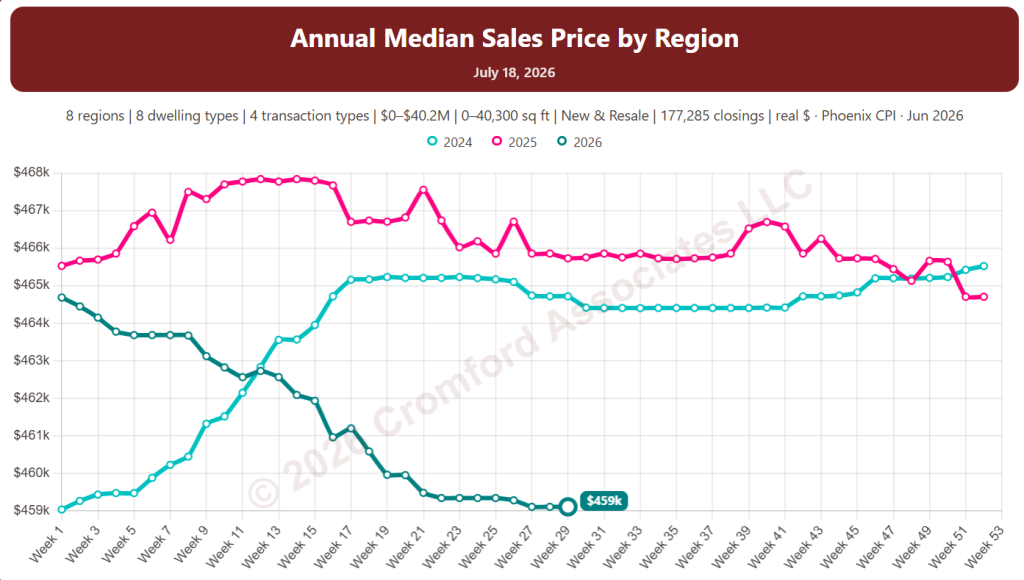
This puts the price into more realistic context. The typical home is cheaper now than at any time since the beginning of 2024, after adjusting for inflation. This chart represents a combination of all dwelling types, all price ranges, and all home sizes across Greater Phoenix. Things can look very different if you look at smaller segments of the market. Here is one example among many:
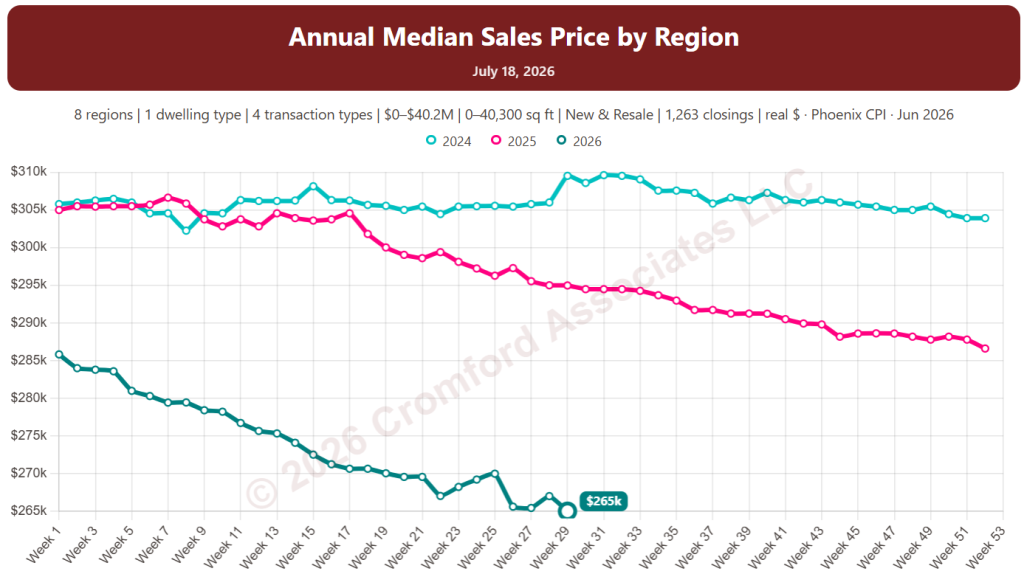
The chart above is for Gemini / Twin homes only. They tend to be a lot cheaper than single-family detached homes and are primarily concentrated in less expensive parts of the West Valley. As such, they have come down hard in price when adjusted for inflation, almost 14% cheaper than at the start of 2024.
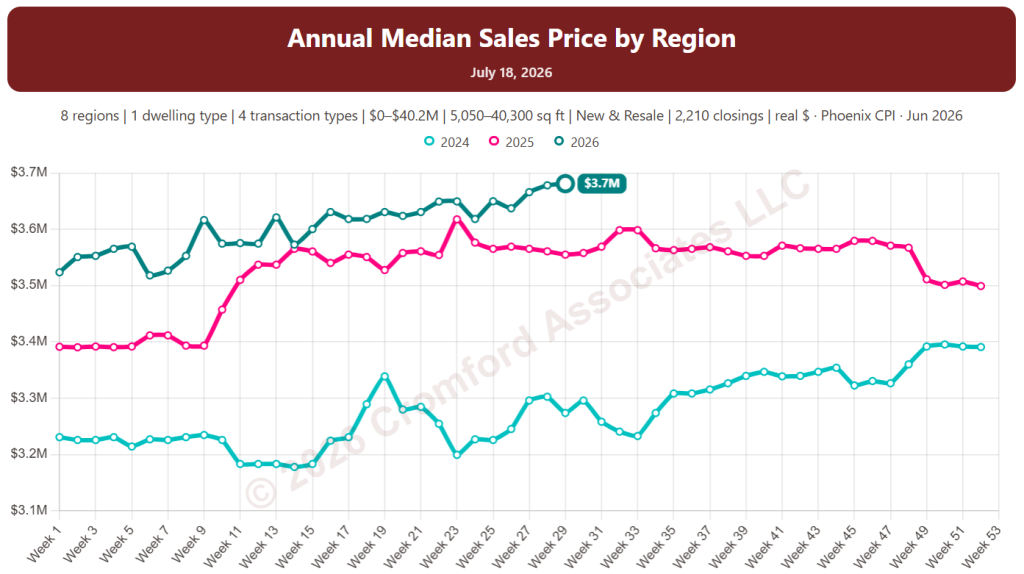
You probably guessed which homes have actually become more expensive – single-family detached homes over 5,000 square feet are in the above chart, and even allowing for inflation, they are up to a median of $3.7M, with a much lower price of $3.2M at the start of 2024.
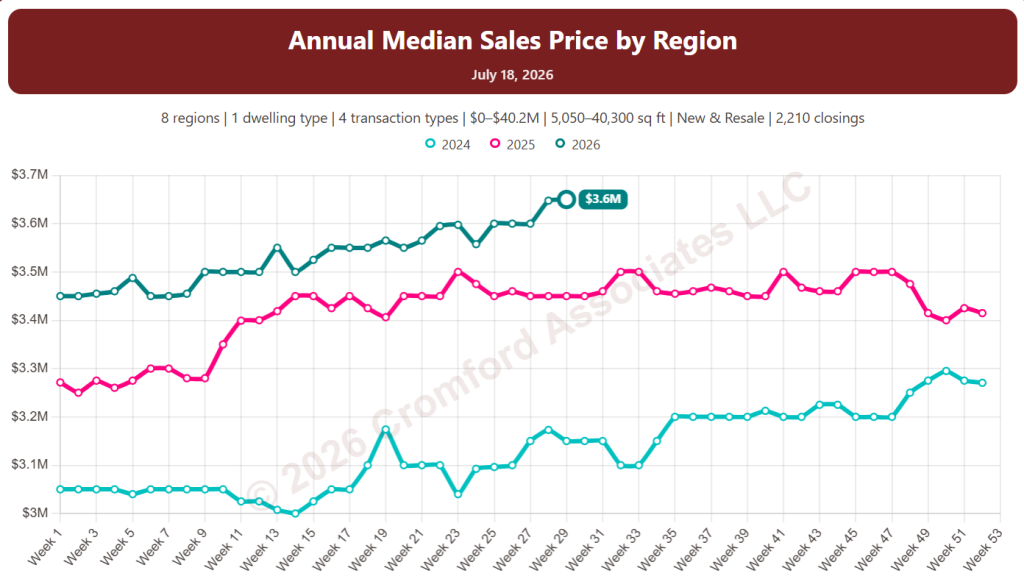
Taking out the inflation adjustment, we see nominal prices for these high-end homes are up 18% since the beginning of 2024. This is a completely different trajectory than for smaller and less expensive homes.
In most sectors, homes are cheaper relative to earnings and other things you might buy. However, large, expensive homes, especially in the Northeast Valley, have continued to rise in price even faster than inflation.
If you are wondering where these charts come from, they are extracted from the new website that we are preparing for launch later this year. They are not yet available for general use, as they are undergoing extensive testing, but if you are interested in becoming an early tester of the new site, drop me an email. In exchange for helping us with the testing, you will get early views of the new website’s features.
Incidentally, the new website will cover the whole of Arizona, although our data feed still comes from ARMLS rather than all the other Multiple Listing Services. Locations like Sedona / Verde Valley and Southeast Arizona have now joined ARMLS, and their data is available to us and will be shown in full on the new website when it launches. Our intent is to gradually expand Cromford Public to include county records from the other 13 counties, not just Maricopa and Pinal, but this will take longer because a lot of work needs to be done on data cleanup.
As a teaser, here is the same chart with the filter set for Southeast Arizona only: