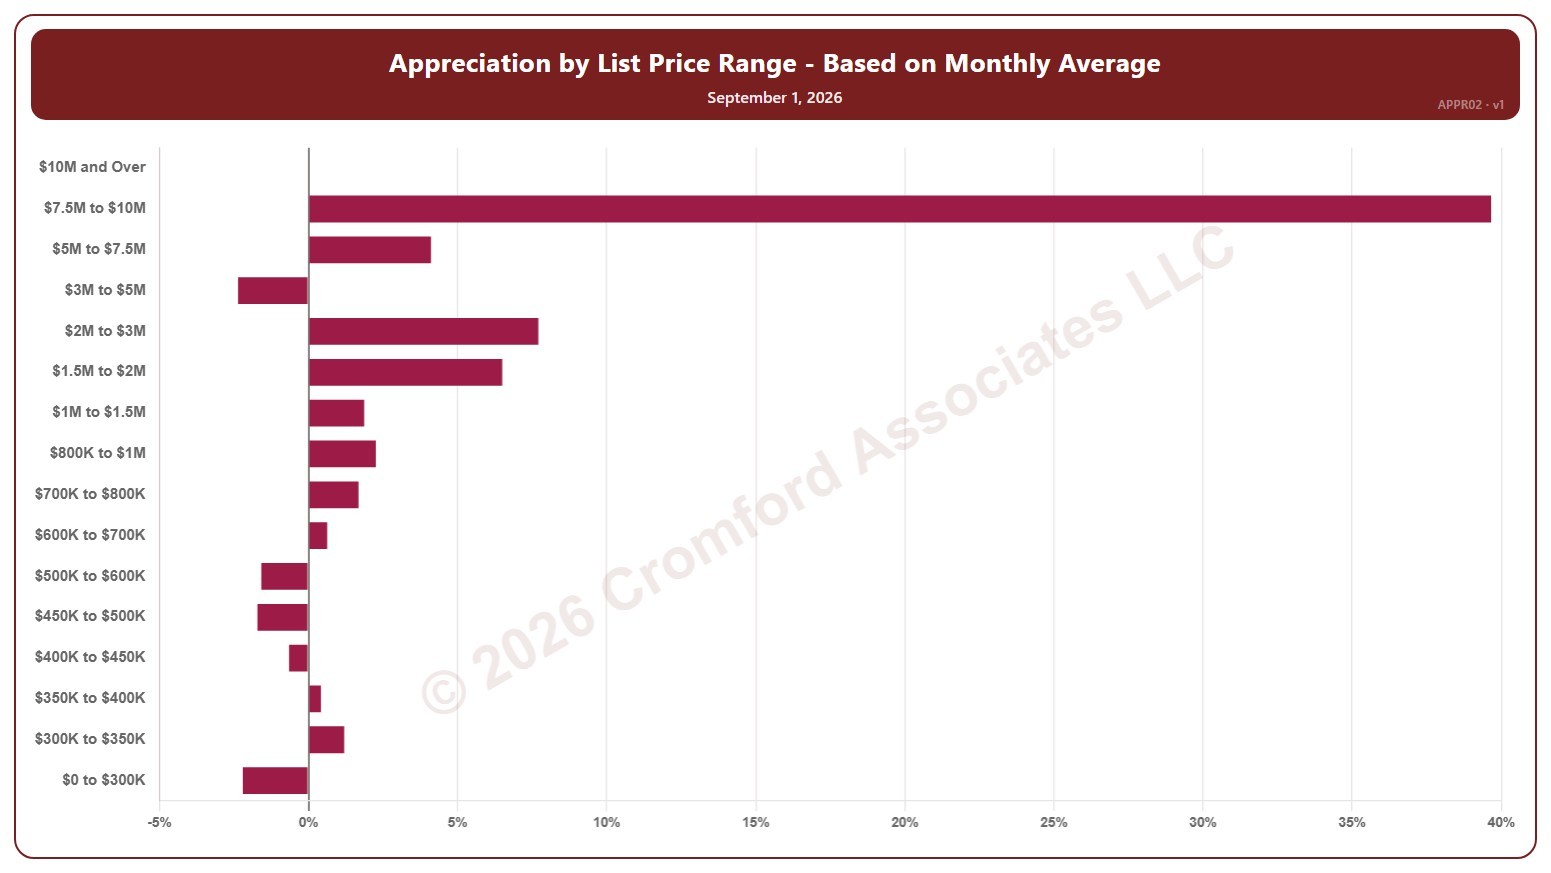
Appreciation by List Price Range – Based on Monthly Average – Monthly

About this chart

This chart shows annual appreciation for single-family detached homes in Greater Phoenix, one bar for each of 16 list price bands from $0 to $300K up to $10M and over. Each bar is the change in the average sales price per square foot over the last month, compared with the same period a year earlier, measured at the start of each month.

It shows which parts of the market are gaining or losing ground. A band with no closings in the period keeps its label but shows no bar.

Hover over a bar to see the exact figure for that band.

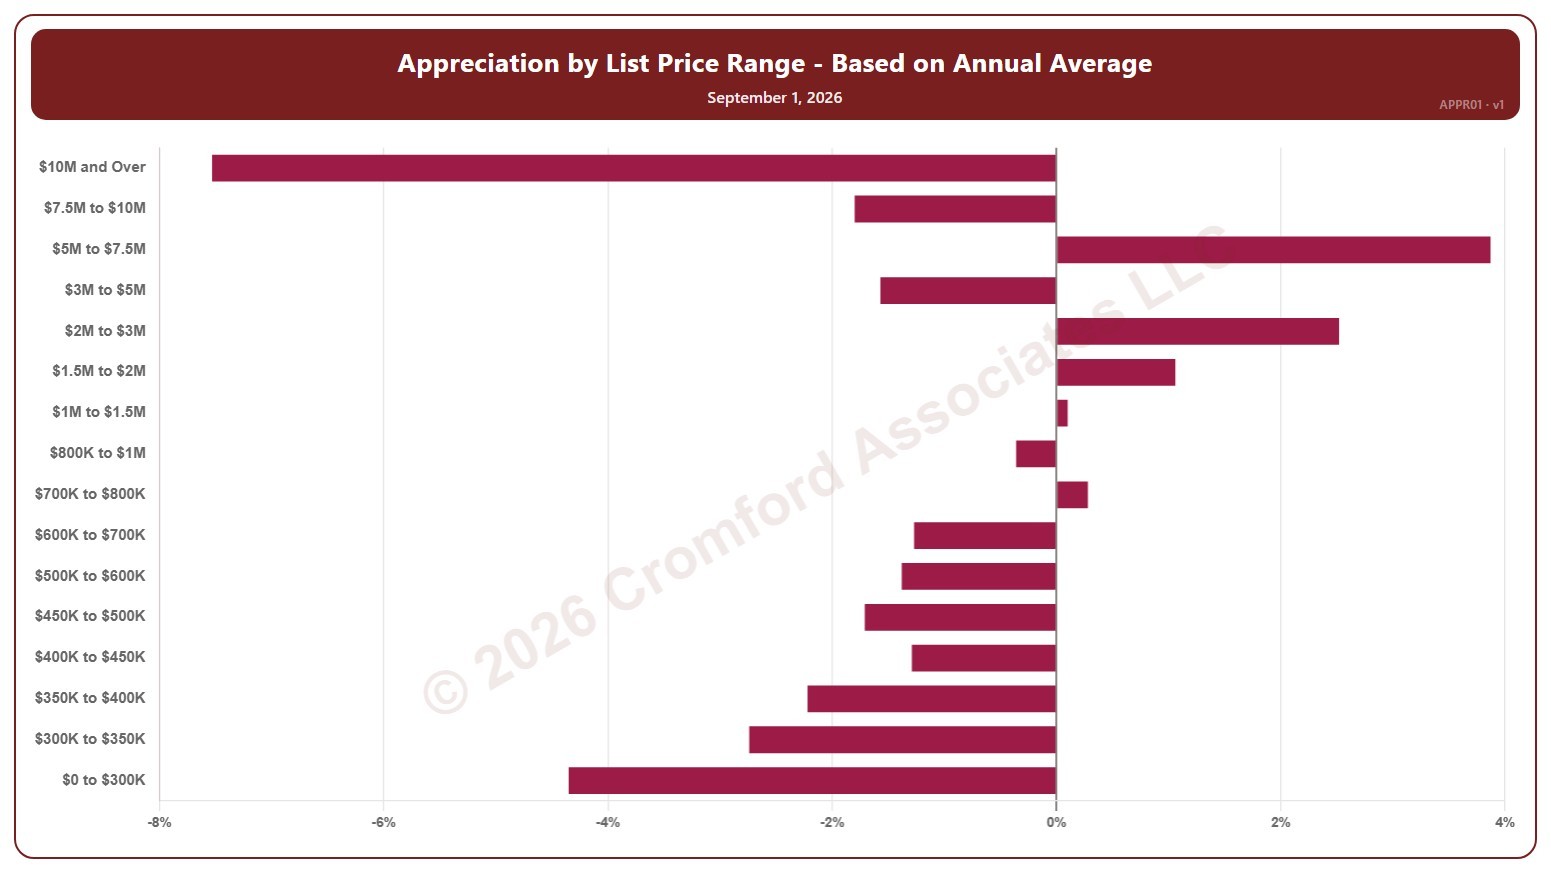
Appreciation by List Price Range – Based on Annual Average – Monthly

About this chart

This chart shows annual appreciation for single-family detached homes in Greater Phoenix, one bar for each of 16 list price bands from $0 to $300K up to $10M and over. Each bar is the change in the average sales price per square foot over the last 12 months, compared with the same period a year earlier, measured at the start of each month.

It shows which parts of the market are gaining or losing ground. A band with no closings in the period keeps its label but shows no bar.

Hover over a bar to see the exact figure for that band.

Contract Ratio

About this chart

This chart shows the contract ratio for the whole ARMLS market, all areas and all dwelling types, as one bar per month since November 2005, each the reading on the 1st of the month. It compares the listings under contract (Pending plus UCB / CCBS) with the active listings available: the higher the ratio, the stronger buying activity is relative to supply. The value axis is logarithmic, so equal steps up the axis are equal percentage changes; this keeps both the extreme years and today readable.

Hover over a bar to see the exact figure for that month.

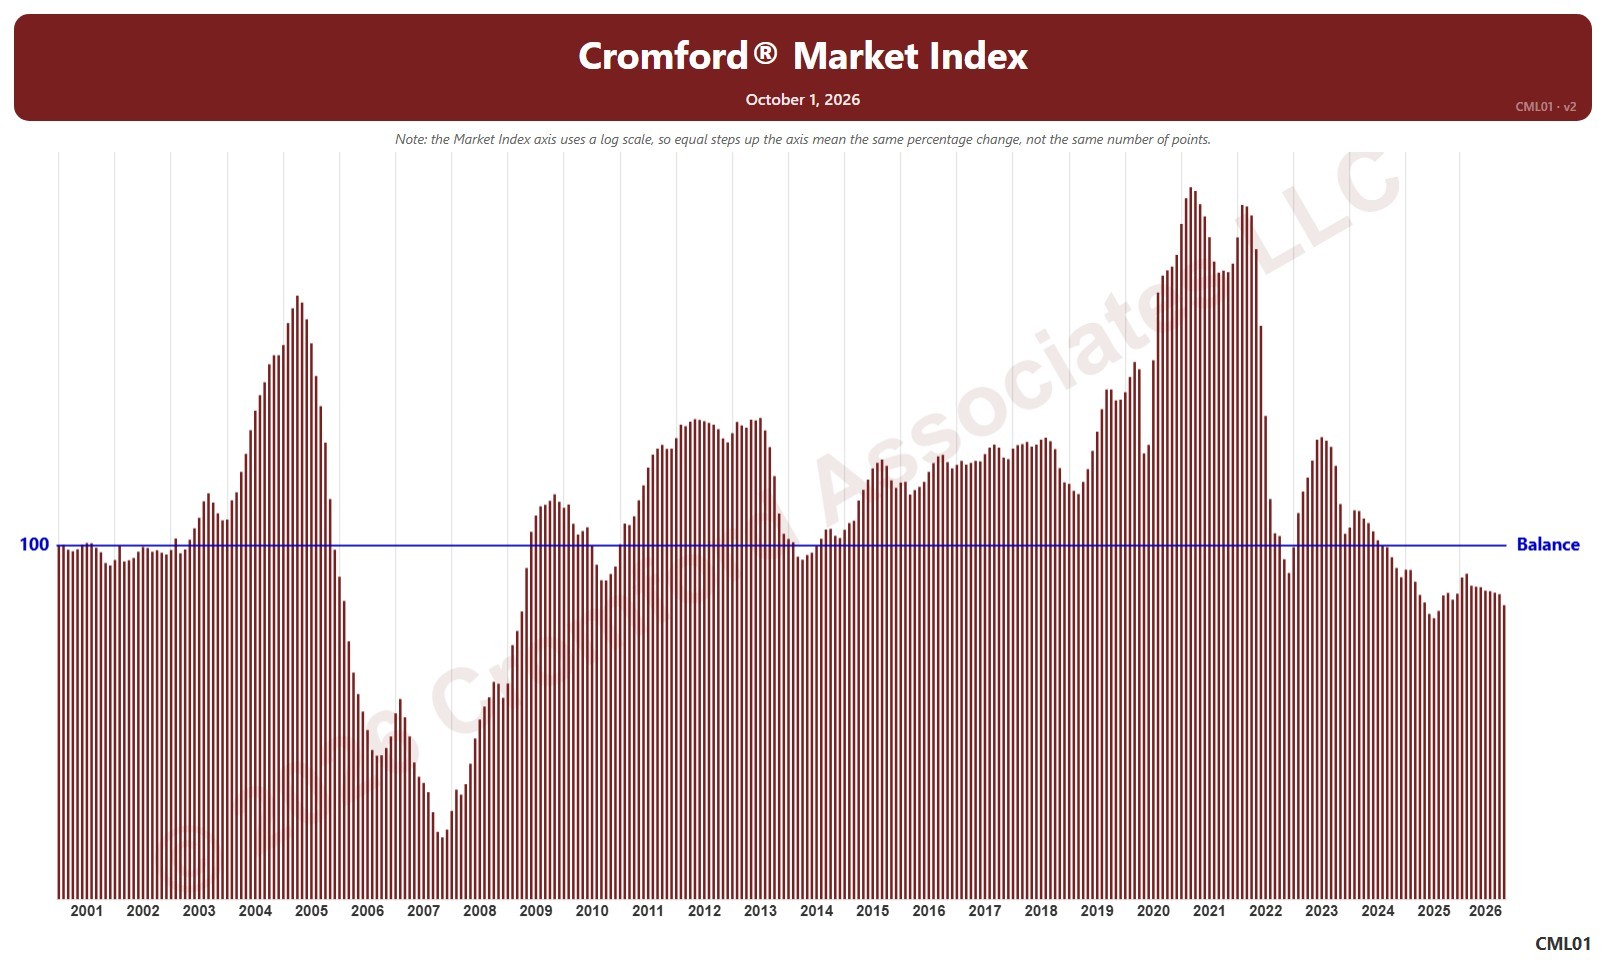
Cromford® Market Index

About this chart

This chart shows the Cromford® Market Index for the whole ARMLS market, all areas and all dwelling types, as one bar per month since January 2001, each the reading on the 1st of the month. A reading below 90 indicates a buyer’s market, above 110 a seller’s market, and between 90 and 110 a balanced market. The value axis is logarithmic, so equal steps up the axis are equal percentage changes; this keeps both the extreme years and today readable.

Hover over a bar to see the exact figure for that month.

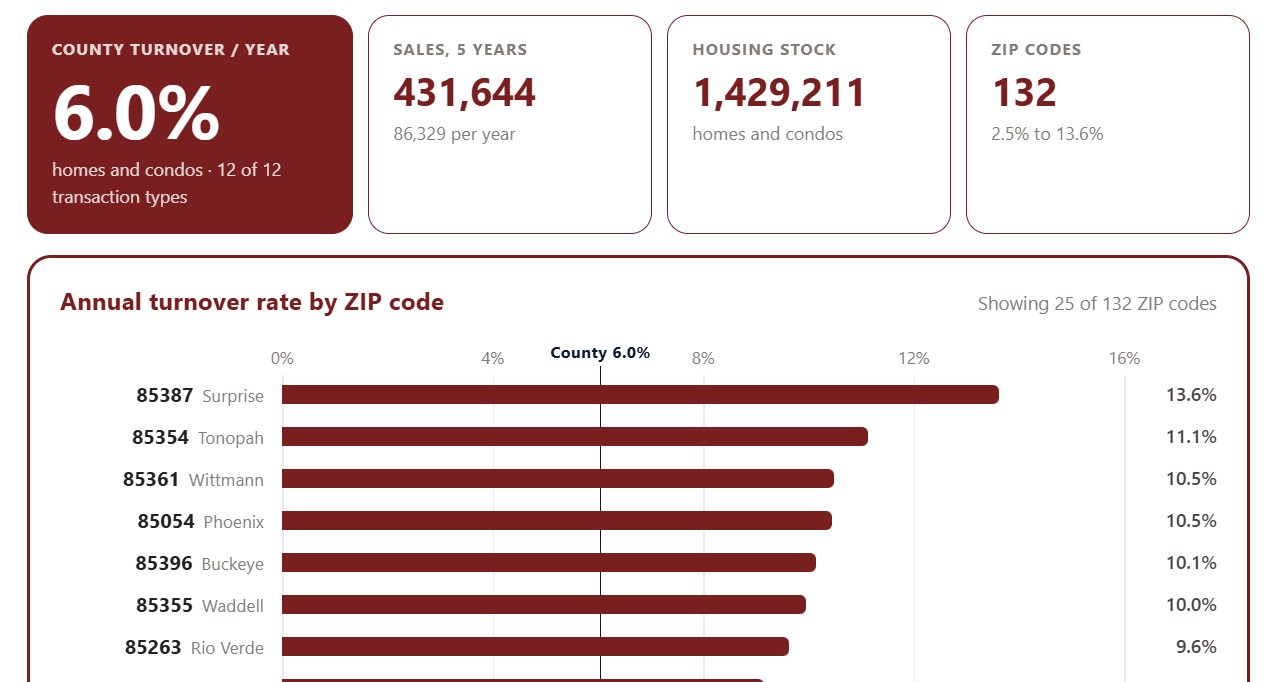
Turnover by ZIP Code

About this chart

This chart ranks Maricopa County ZIP codes by turnover: the share of each ZIP code’s homes that change hands in a typical year, averaged over the last five years. High turnover marks an active market where homes come up for sale often; low turnover means owners tend to stay put.

It opens on the top 25 ZIP codes. Show switches to the top 50 or all ZIP codes, Sort ranks them by turnover, sales volume, housing stock, or ZIP code, and All, Homes, and Condos choose the property type. The transaction type boxes narrow the sales counted.

Chart and Table switch between the ranked bars and the same figures as a table.

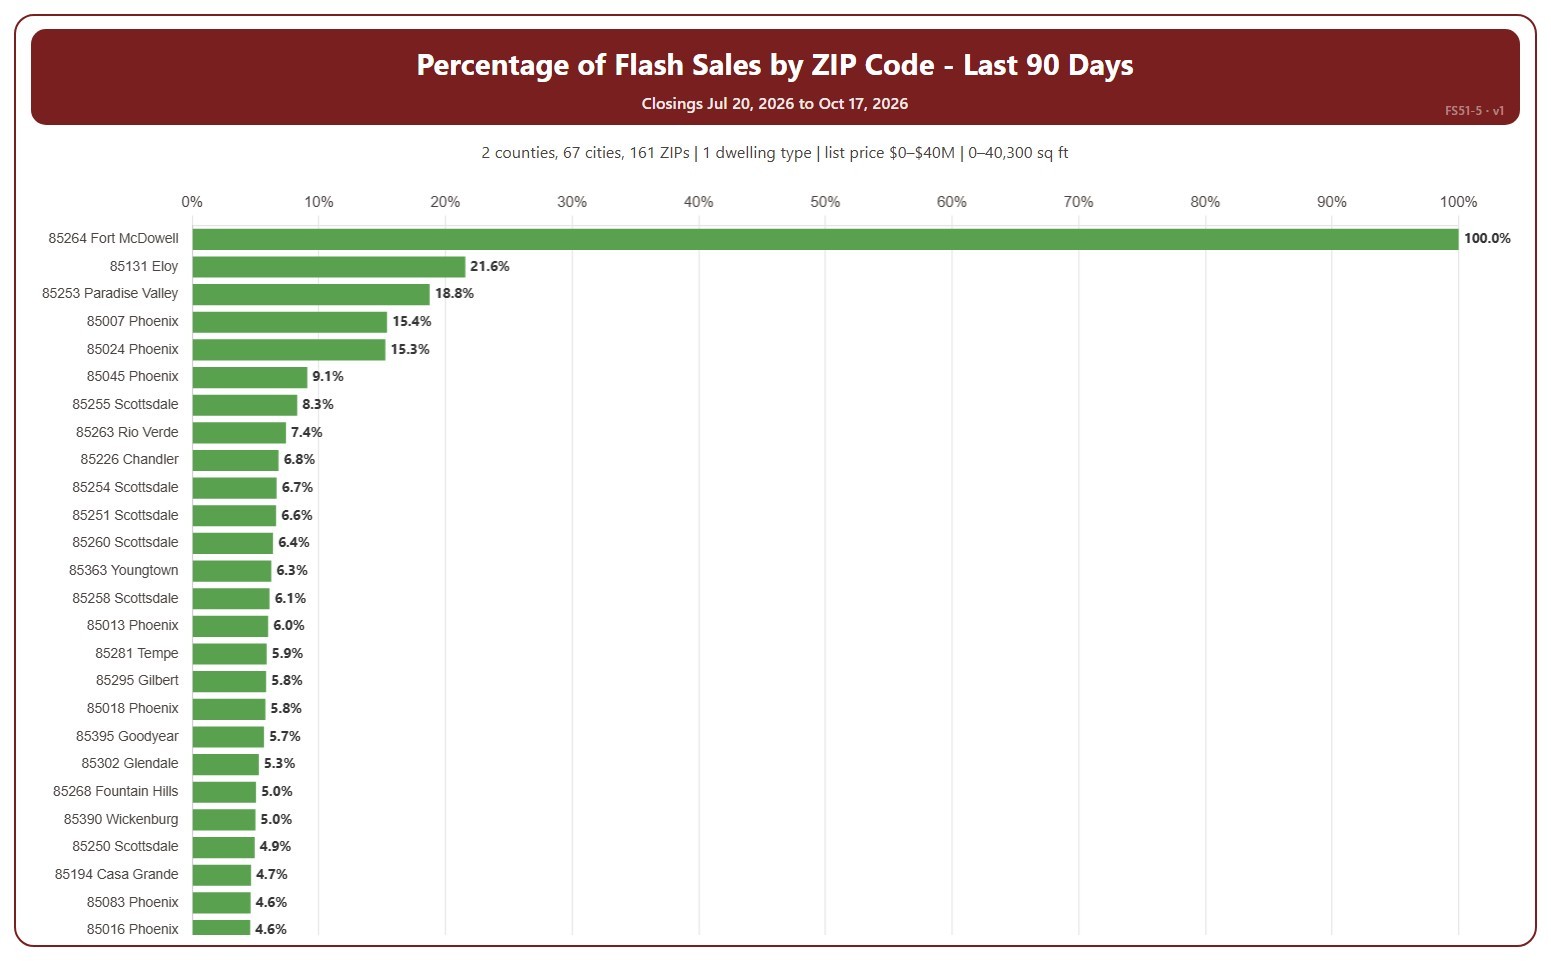
Percentage Flash Sales by ZIP Code

About this chart

This chart shows flash sales as a percentage of all closings in each ZIP code, highest first. A ZIP code with only a few closings can show 0% or 100%. A flash sale is a closing that spent 1 day or less in the MLS (0 or 1 days on market, cumulative), usually a home that sold as soon as it was listed or was listed only to record a sale already agreed.

It covers the last 90 days to today; choose the last 30 days in the Period box instead. The chart is updated every day.

It opens on Maricopa and Pinal counties and single-family detached homes, as the original chart did. Use the County, City, and ZIP Code boxes to change the area, and narrow it further with the Dwelling Type and New / Resale boxes and the list price, home size, and year built sliders.

Hover over a bar to see the flash sales and all closings in the ZIP code.

Percentage Flash Sales by City

About this chart

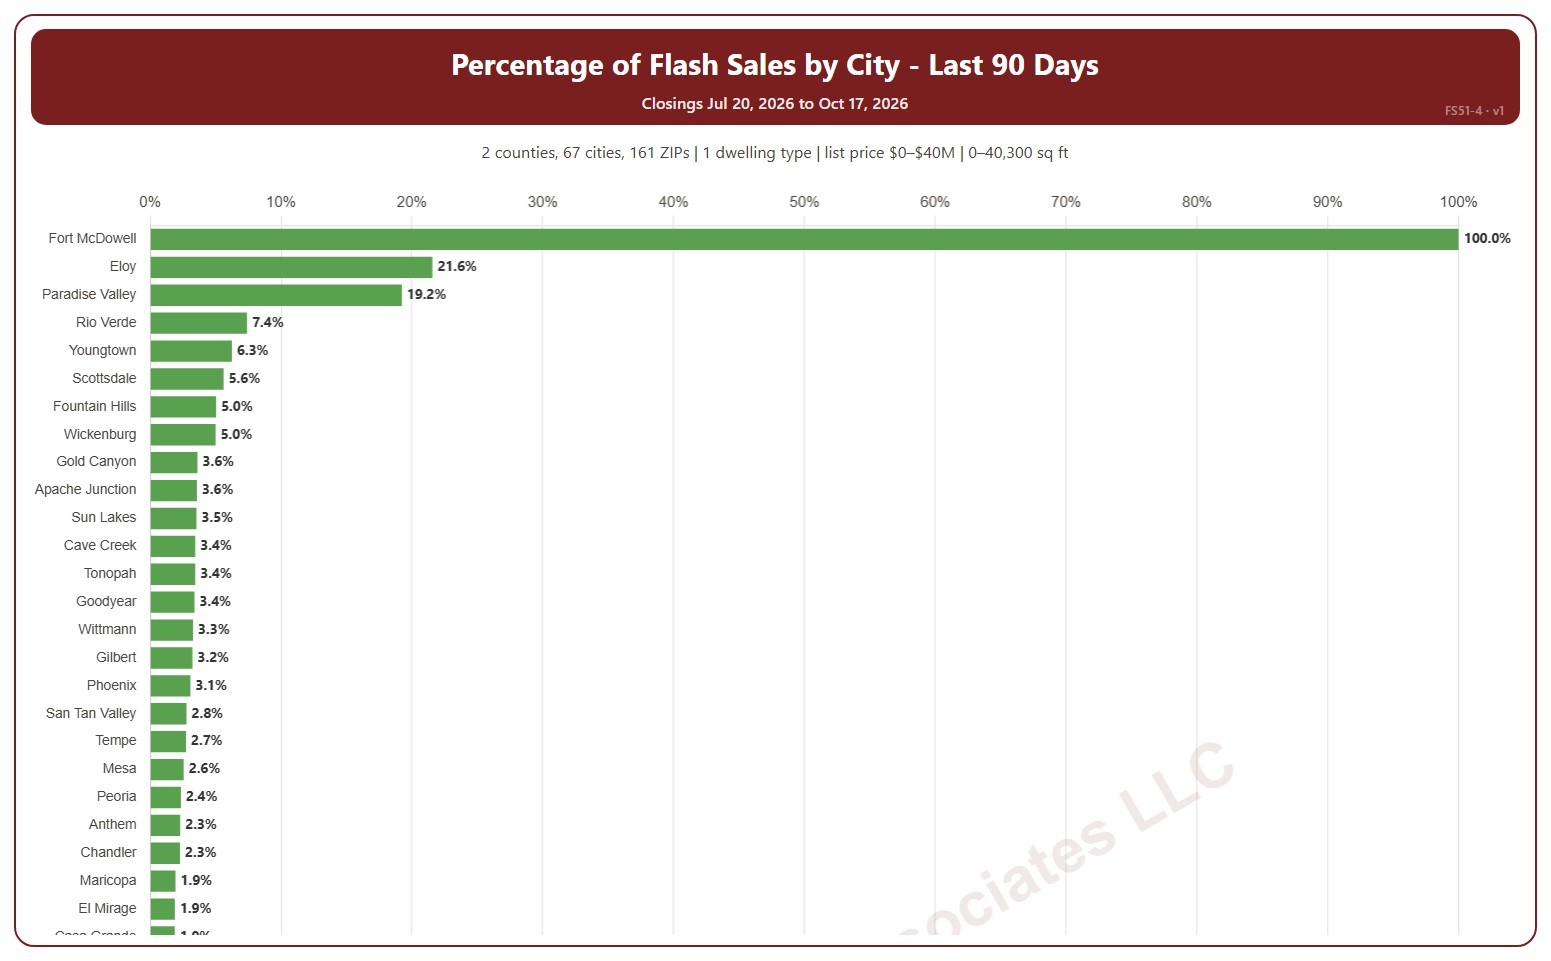
This chart shows flash sales as a percentage of all closings in each city, highest first. A city with only a few closings can show 0% or 100%. A flash sale is a closing that spent 1 day or less in the MLS (0 or 1 days on market, cumulative), usually a home that sold as soon as it was listed or was listed only to record a sale already agreed.

It covers the last 90 days to today; choose the last 30 days in the Period box instead. The chart is updated every day.

It opens on Maricopa and Pinal counties and single-family detached homes, as the original chart did. Use the County, City, and ZIP Code boxes to change the area, and narrow it further with the Dwelling Type and New / Resale boxes and the list price, home size, and year built sliders.

Hover over a bar to see the flash sales and all closings in the city.

Percentage of Flash Sales by Price Range

About this chart

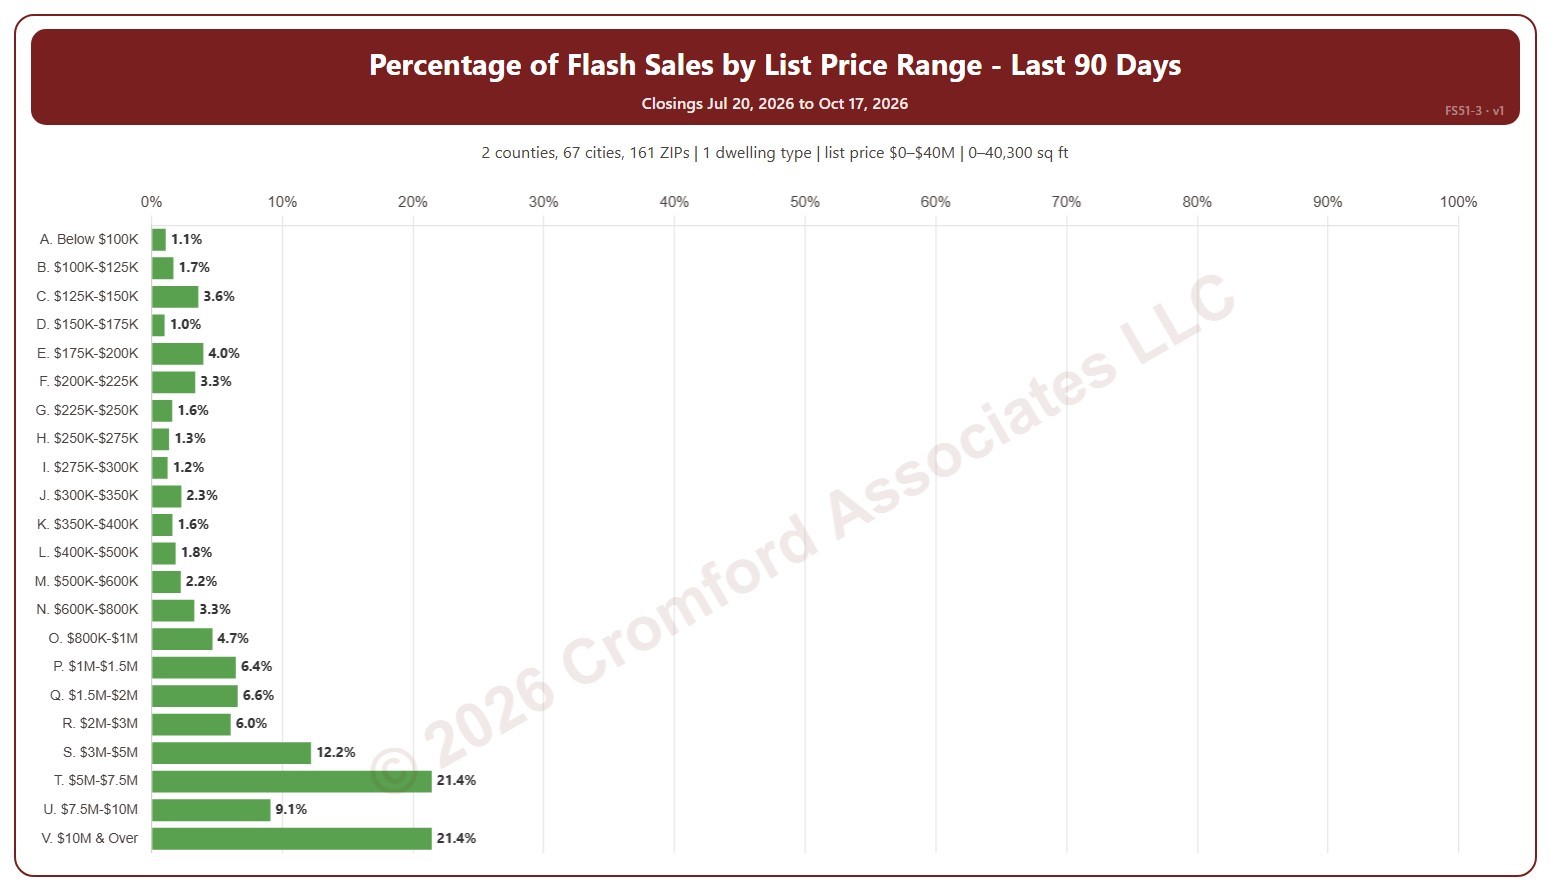
This chart shows flash sales as a percentage of all closings in each list price range. A flash sale is a closing that spent 1 day or less in the MLS (0 or 1 days on market, cumulative), usually a home that sold as soon as it was listed or was listed only to record a sale already agreed.

It covers the last 90 days to today; choose the last 30 days in the Period box instead. The chart is updated every day.

It opens on Maricopa and Pinal counties and single-family detached homes, as the original chart did. Use the County, City, and ZIP Code boxes to change the area, and narrow it further with the Dwelling Type and New / Resale boxes and the list price, home size, and year built sliders.

Hover over a bar to see the flash sales and all closings in the range.

Listing Success Rate by Transaction Type

About this chart

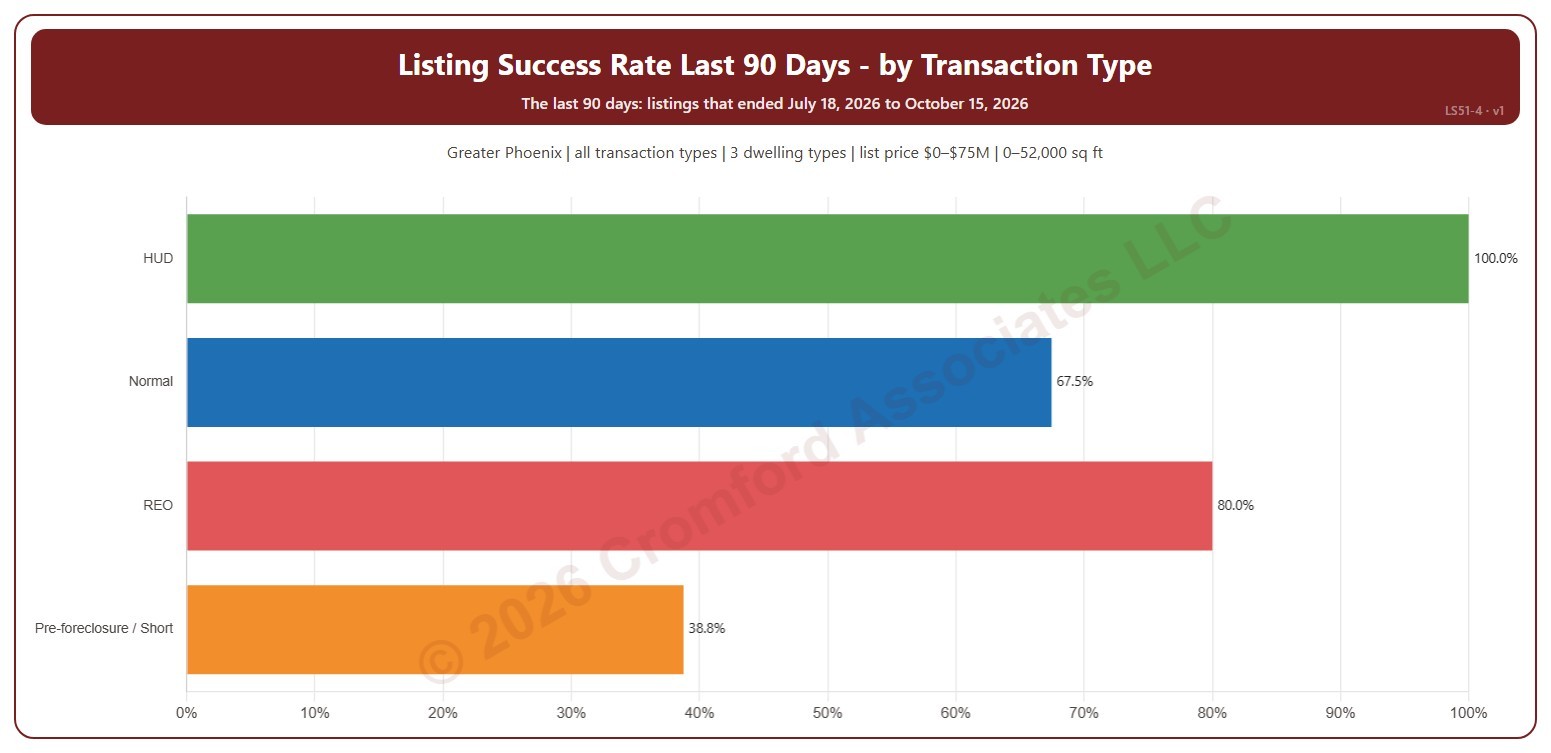
This chart shows the listing success rate over the last 90 days for each transaction type: normal sales, REO, pre-foreclosure / short sales, and HUD. The listing success rate is the share of listings that closed, out of all the listings that ended: closed, expired, or cancelled. Each listing counts once, in the month (or window) its listing ended: the closing date for a closing, the expiration for an expired listing, the cancellation for a cancelled one.

It covers the 90 days of listings that ended up to the newest one; the heading shows the exact dates. The chart is updated every day.

It opens on the Greater Phoenix area: the counties, cities, and ZIP codes that make it up are ticked to start with. Tick or untick any of them to change the area, including counties beyond Greater Phoenix. It opens on all four transaction types; untick any to leave them out. Narrow it further with the Dwelling Type and New / Resale boxes and the list price, home size, and year built sliders.

Hover over a bar to see the rate, the listings that closed, and those that expired or were cancelled.

Listing Success Rate Ranked by City

About this chart

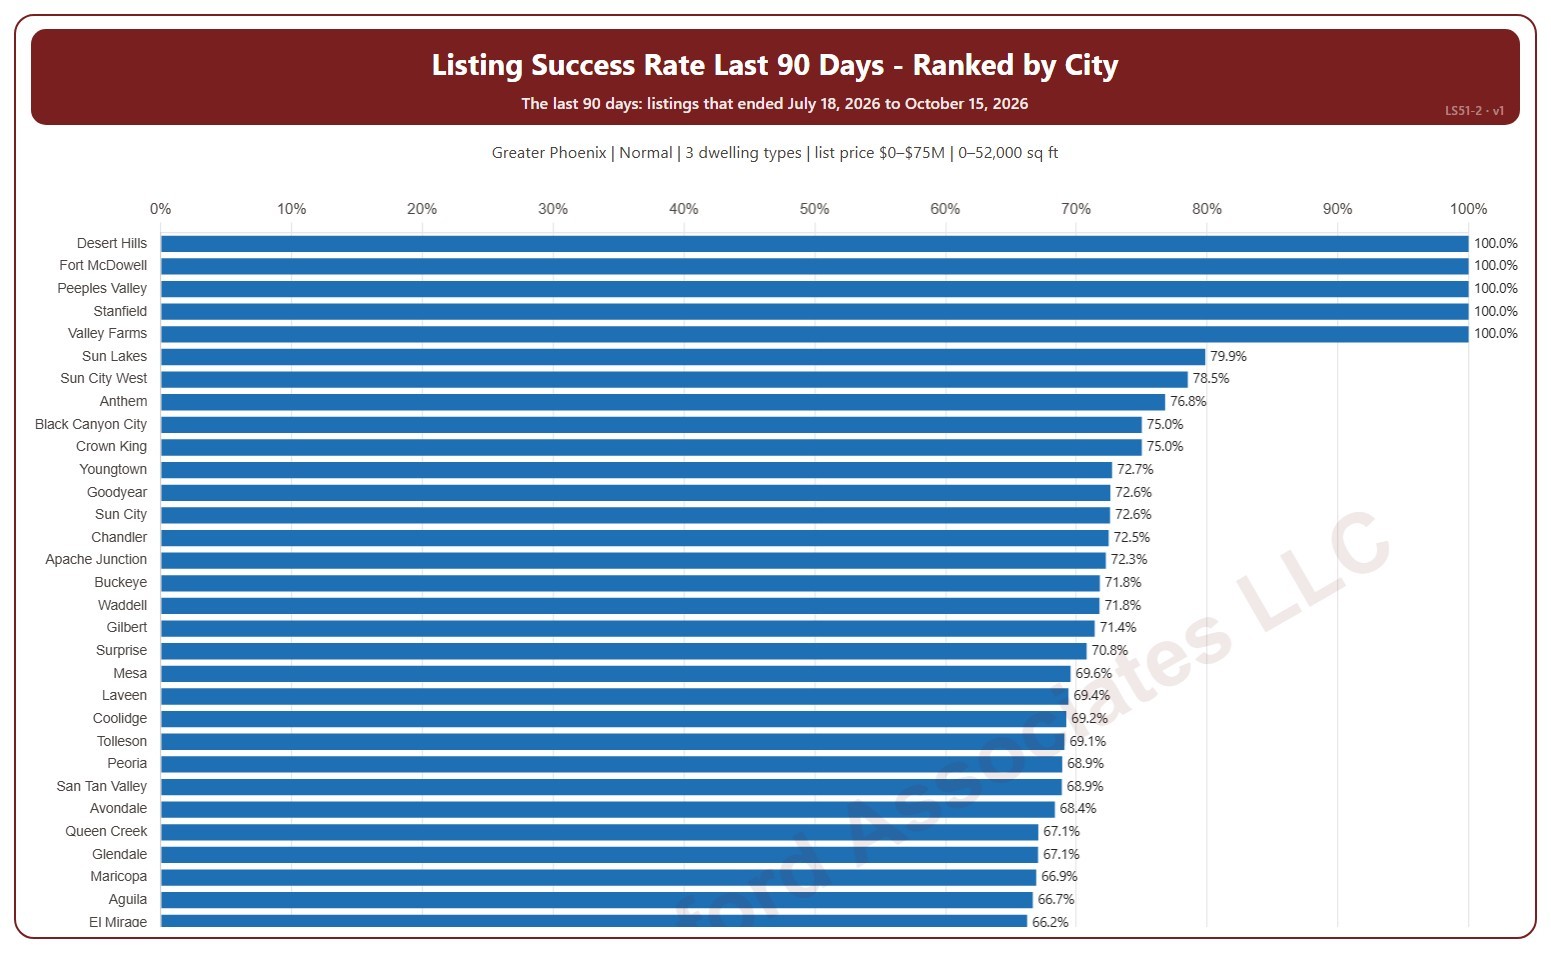
This chart ranks cities by their listing success rate over the last 90 days, highest first. The listing success rate is the share of listings that closed, out of all the listings that ended: closed, expired, or cancelled. Each listing counts once, in the month (or window) its listing ended: the closing date for a closing, the expiration for an expired listing, the cancellation for a cancelled one. A city with only a few listings can show 0% or 100%.

It covers the 90 days of listings that ended up to the newest one; the heading shows the exact dates. The chart is updated every day. Scroll inside the chart to see every city; a printed copy runs over as many pages as it needs.

It opens on the Greater Phoenix area: the counties, cities, and ZIP codes that make it up are ticked to start with. Tick or untick any of them to change the area, including counties beyond Greater Phoenix. It opens on normal sales; tick other transaction types to add them. Narrow it further with the Dwelling Type and New / Resale boxes and the list price, home size, and year built sliders.

Hover over a bar to see the rate, the listings that closed, and those that expired or were cancelled.