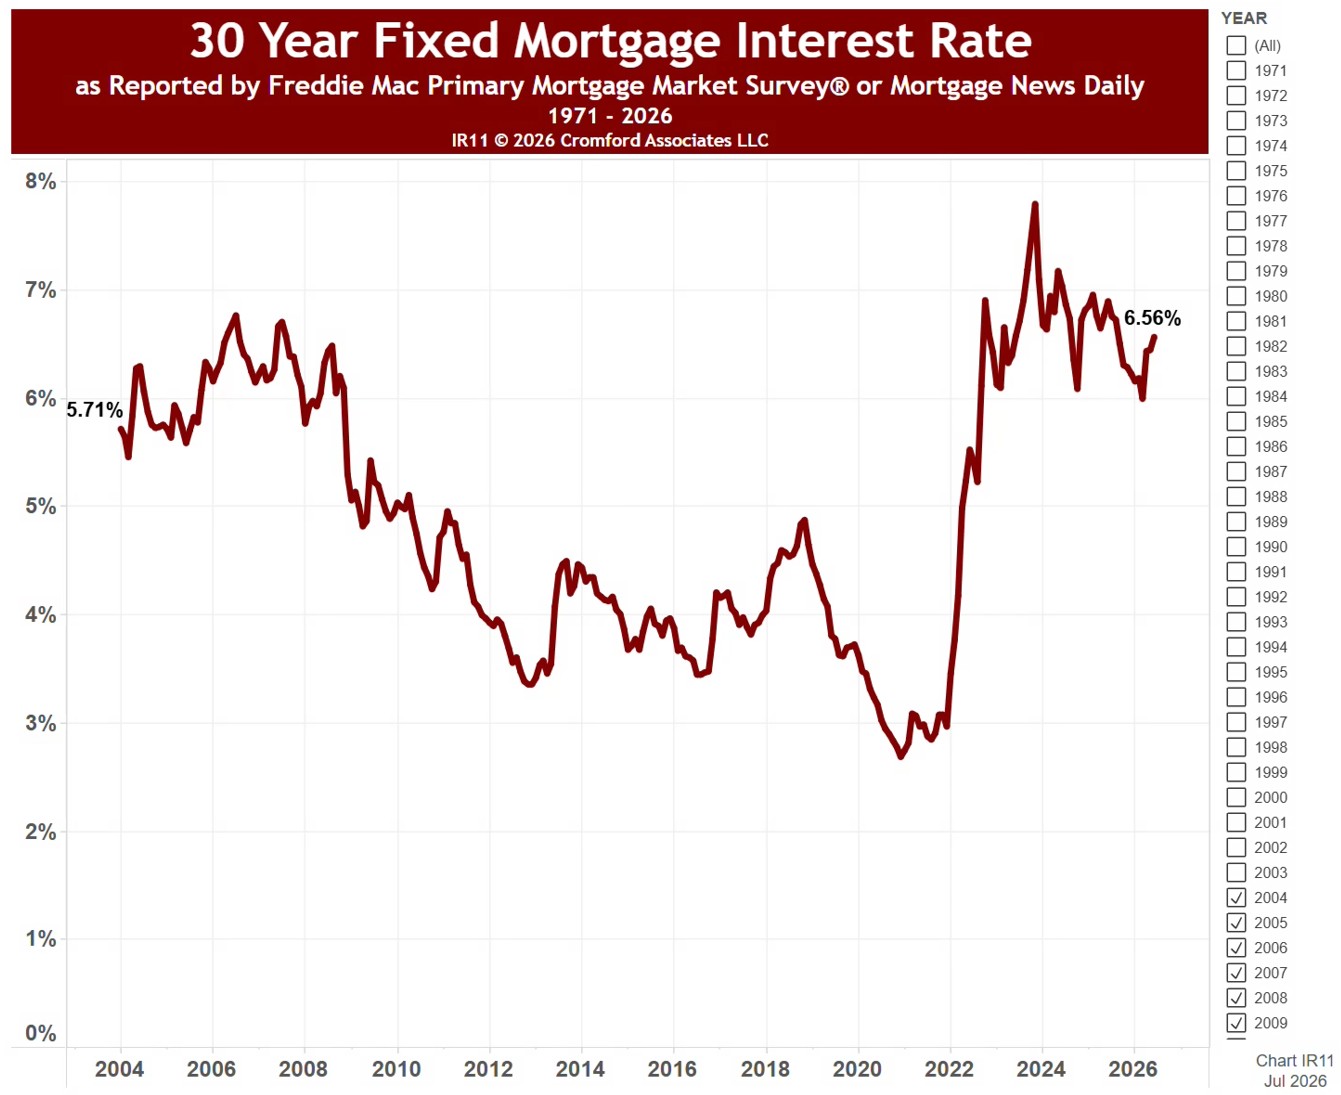
30 Year Fixed Mortgage Interest Rate

About this chart

This chart shows the average 30-year fixed mortgage rate each month since April 1971, as reported by the Freddie Mac Primary Mortgage Market Survey®. The line under the title gives the latest rate and the lowest and highest for the months shown.

It opens on the whole history; use the Recording Month range to zoom in on any stretch of months, and the line under the title updates to match.

Rates feed straight into what buyers can afford: on the same budget, a higher rate means a smaller loan. Hover over the line to see the rate for any month.
Monthly Average Home Size in Square Feet

About this chart

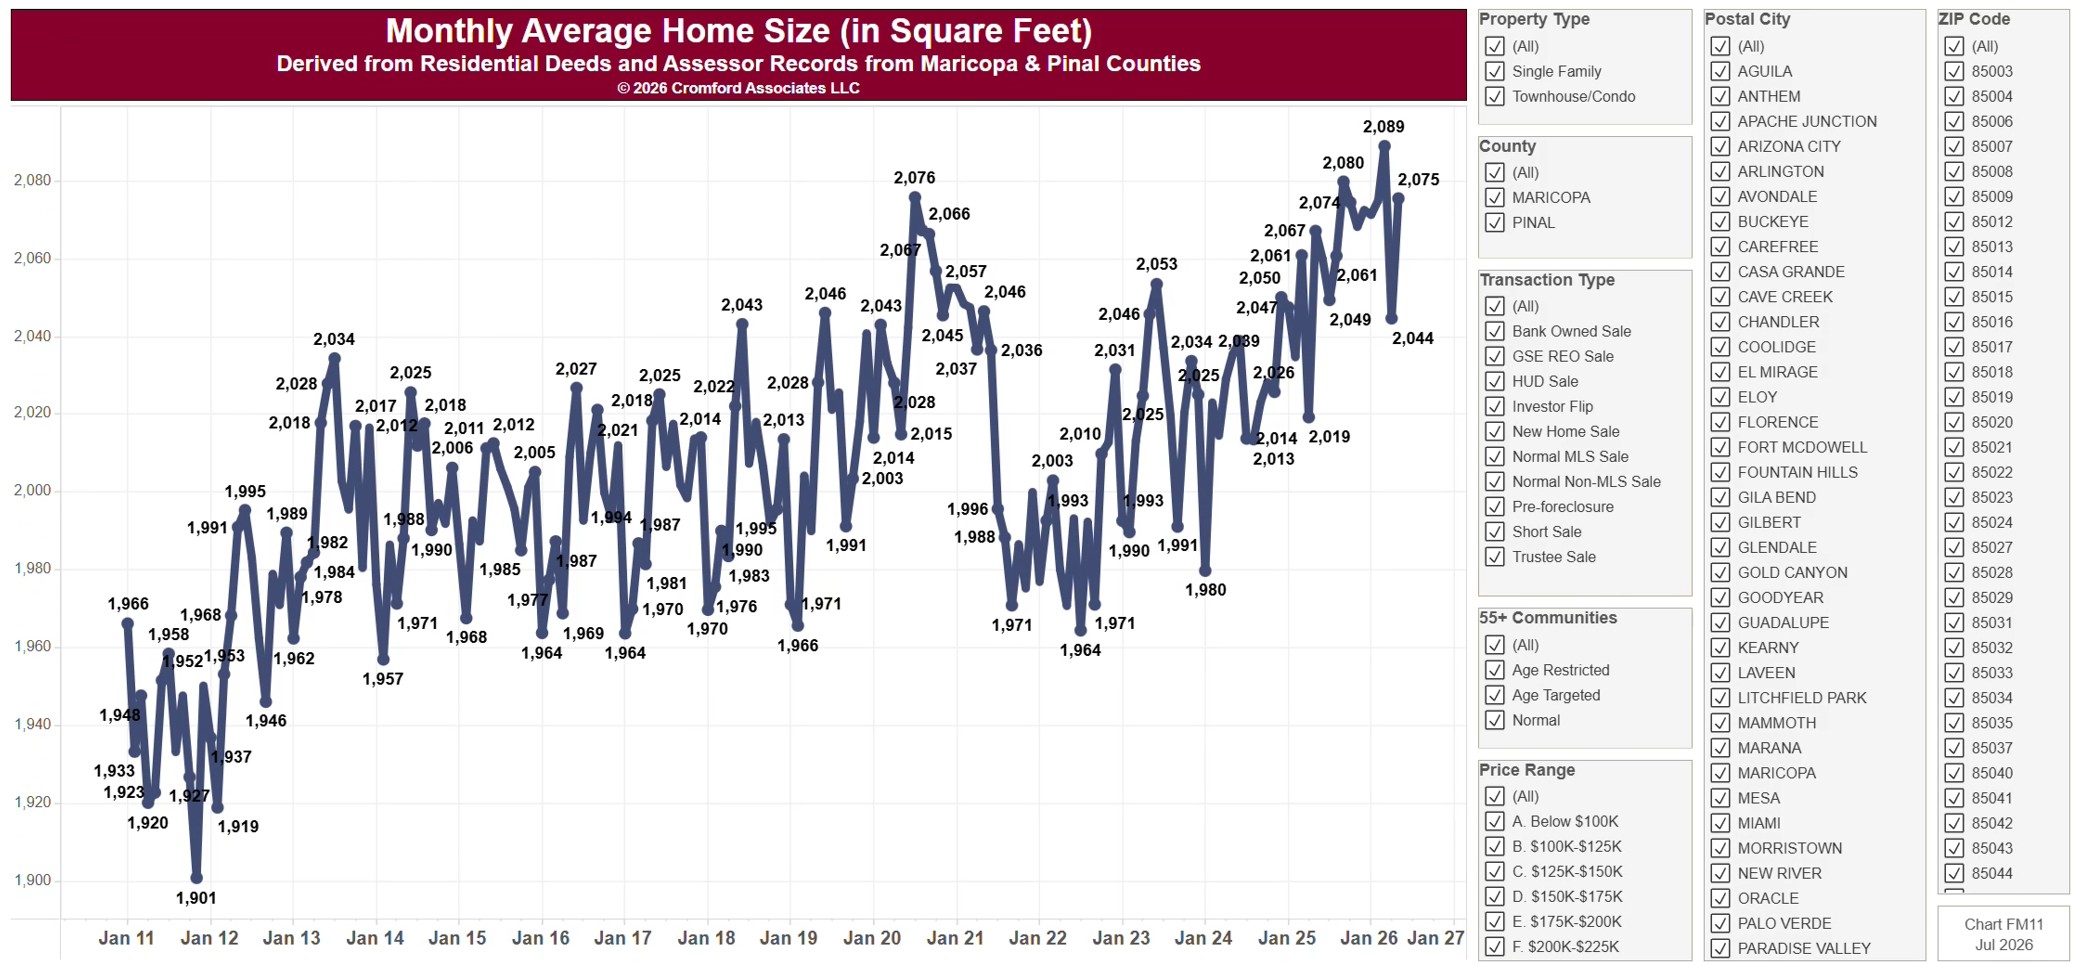
This chart shows the average size, in square feet, of the homes sold each calendar month since January 2011, from residential deeds recorded by Maricopa and Pinal Counties. The square footage is the county assessor’s figure; a single month moves around more than the 12-month average in FA11. Because it is built from recorded deeds, it covers every recorded sale, not just homes listed on ARMLS: new homes, private sales, and investor deals are all included.

It opens on Maricopa and Pinal Counties with everything included. Narrow it with the County, City, and ZIP panels, the Transaction Type, Property Type, and 55+ Communities boxes, and the sale price slider.

The records run to the end of last month and are updated monthly. Hover over the line to see the exact figure for that month.

Flip Sales – Median Acquisition and Sales Prices

About this chart

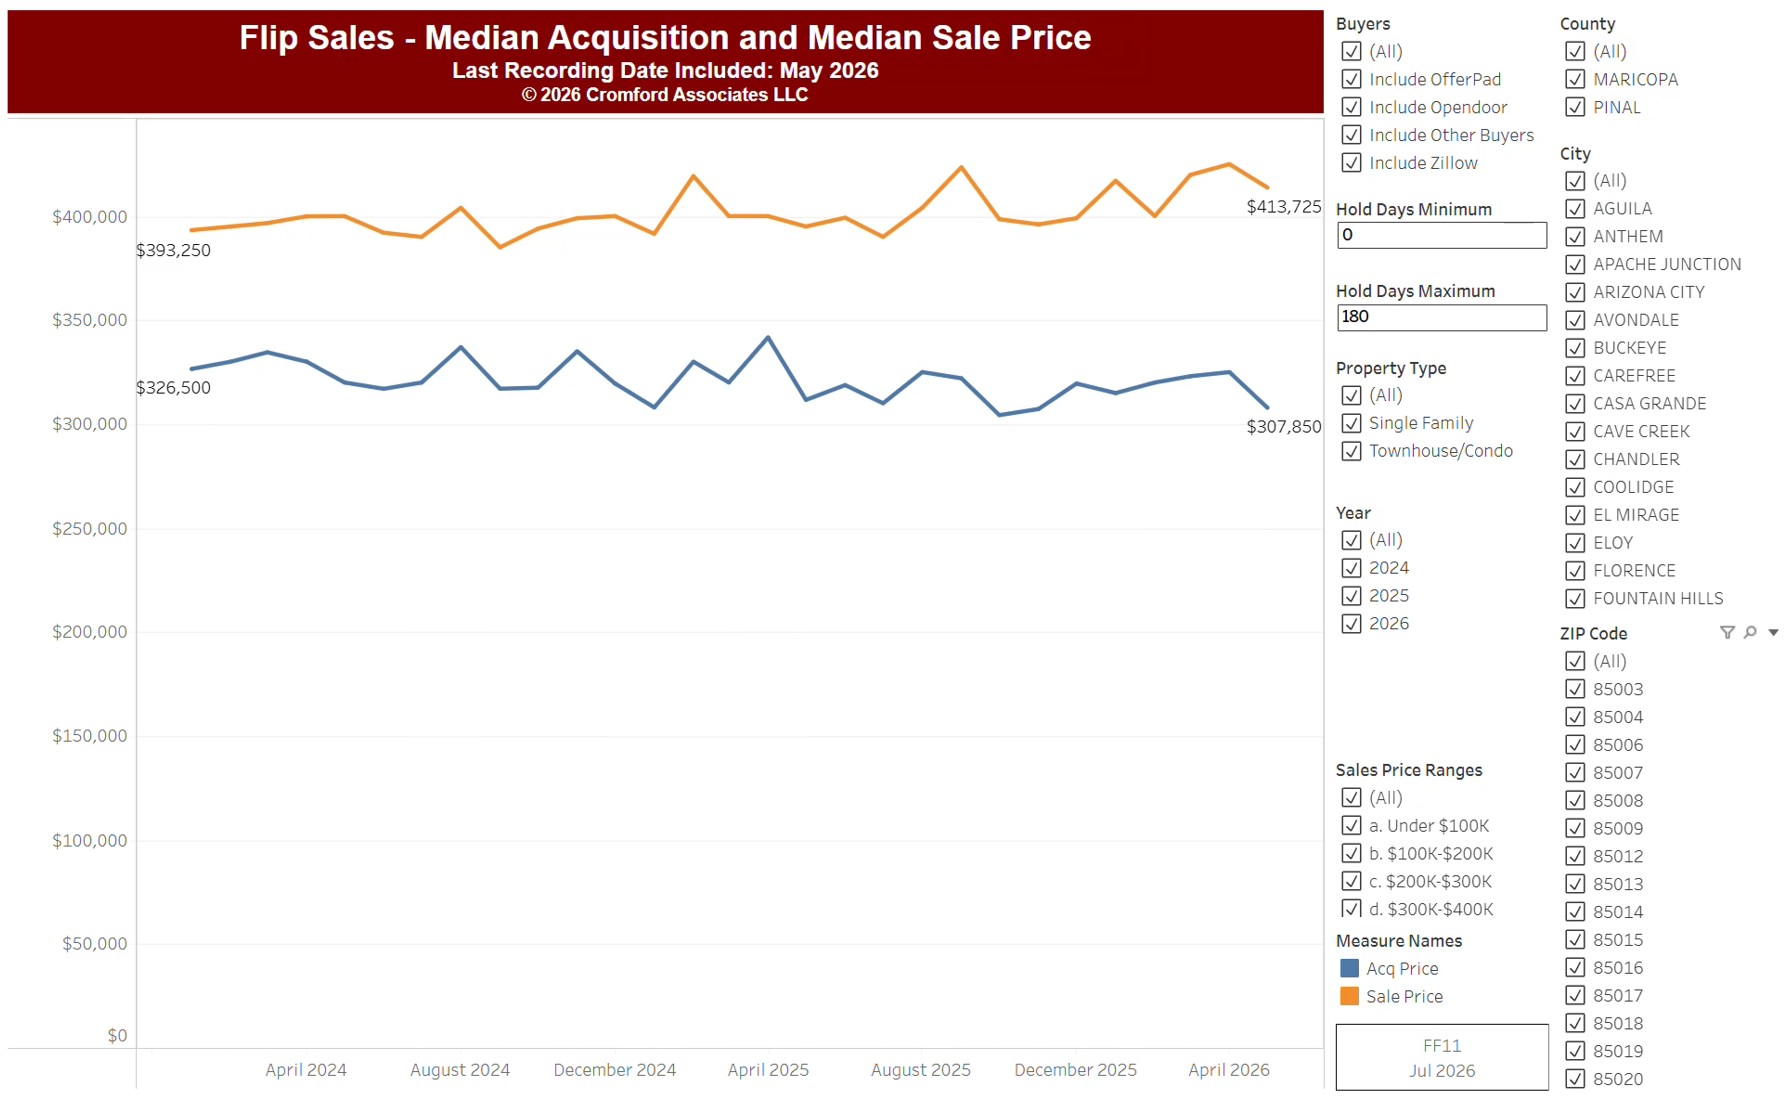
This chart follows fix-and-flip sales, from residential deeds recorded by Maricopa and Pinal Counties: homes bought and resold by an investor. Its two lines show, by calendar month since January 2014, the median price flippers paid and the median price they resold for. The gap between the lines is the typical gross margin on a flip, before renovation and selling costs.

It opens on every month since January 2014, with Maricopa and Pinal Counties and all buyers included, Opendoor, OfferPad, Zillow, and Homes2X among them; untick them under Buyers to leave them out. Choose the period with the Recording Month slider, and narrow it with the County, City, and ZIP panels, the Property Type boxes, and the sale price and hold days sliders.

The records run to the end of last month and are updated monthly. Hover over the chart to see the figures for that month.

Annual Average Home Size (in Square Feet)

About this chart

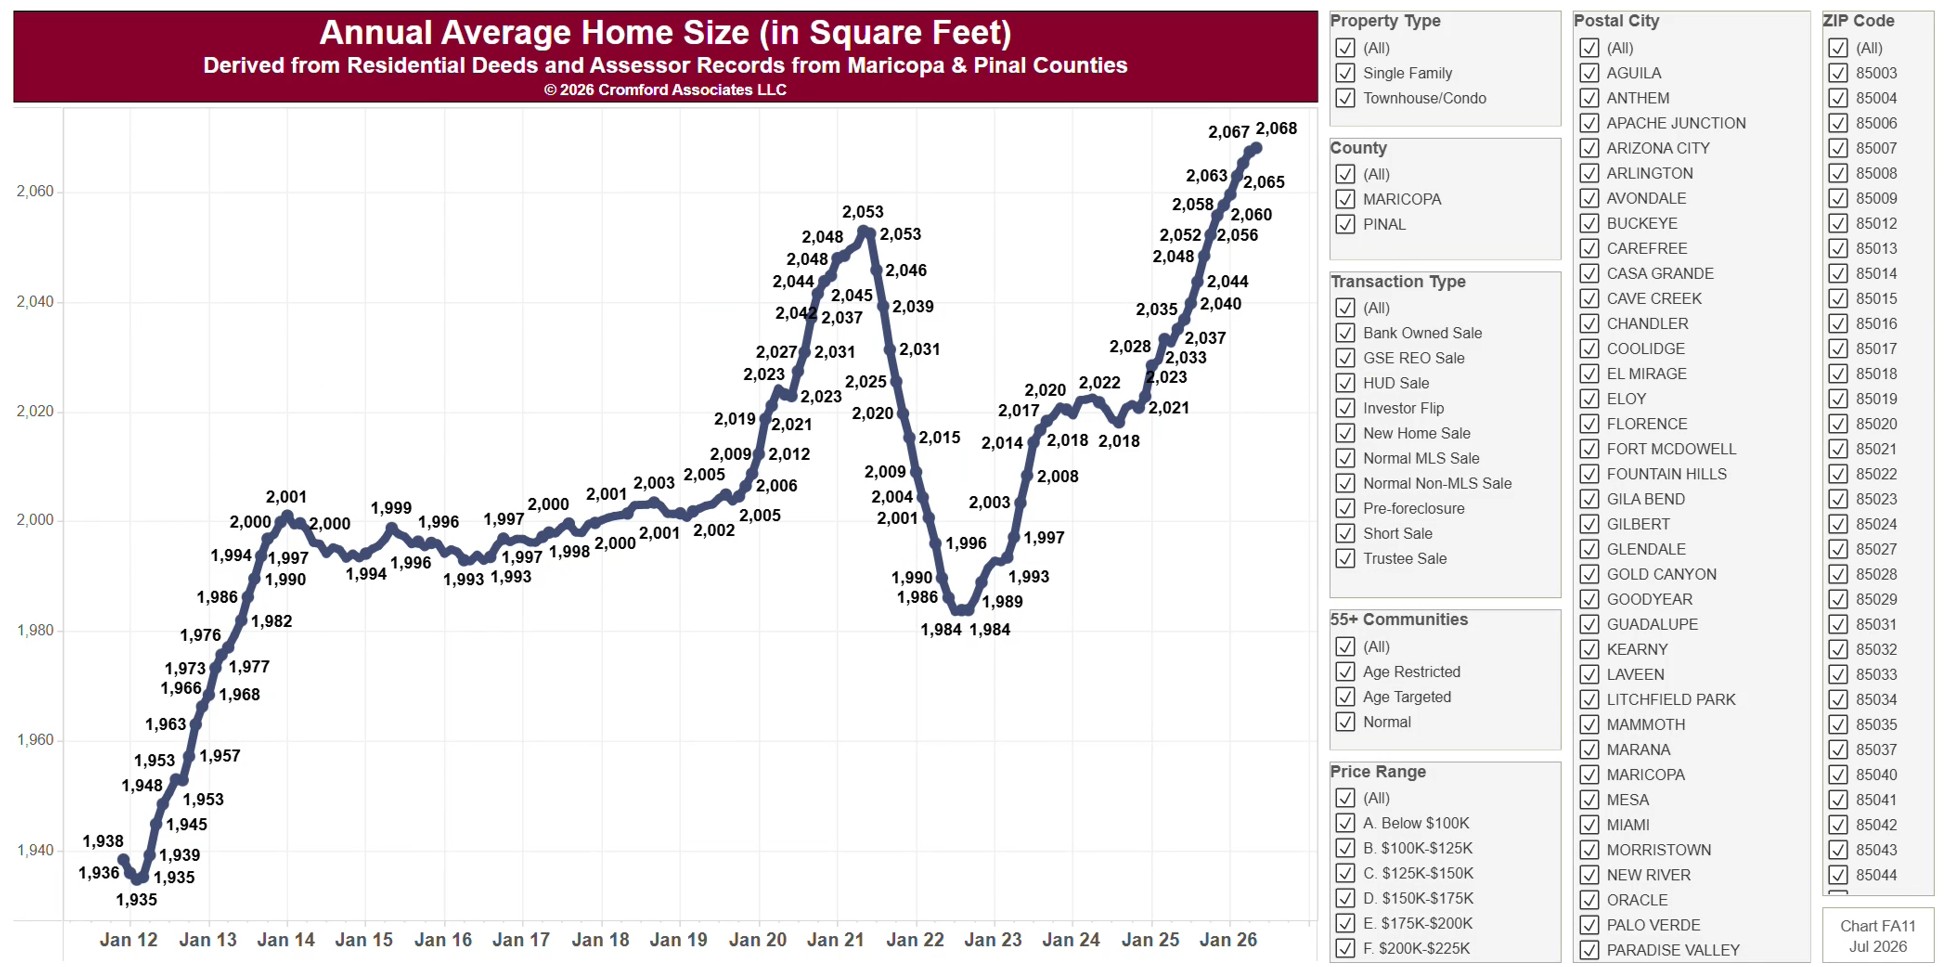
This chart shows the 12-month moving average size, in square feet, of the homes sold, by month since 2011, from residential deeds recorded by Maricopa and Pinal Counties. The square footage is the county assessor’s figure. Because it is built from recorded deeds, it covers every recorded sale, not just homes listed on ARMLS: new homes, private sales, and investor deals are all included.

It opens on Maricopa and Pinal Counties with everything included. Narrow it with the County, City, and ZIP panels, the Transaction Type, Property Type, and 55+ Communities boxes, and the sale price slider.

The records run to the end of last month and are updated monthly. Hover over the line to see the exact figure for that month.

Monthly Median Sales Price

About this chart

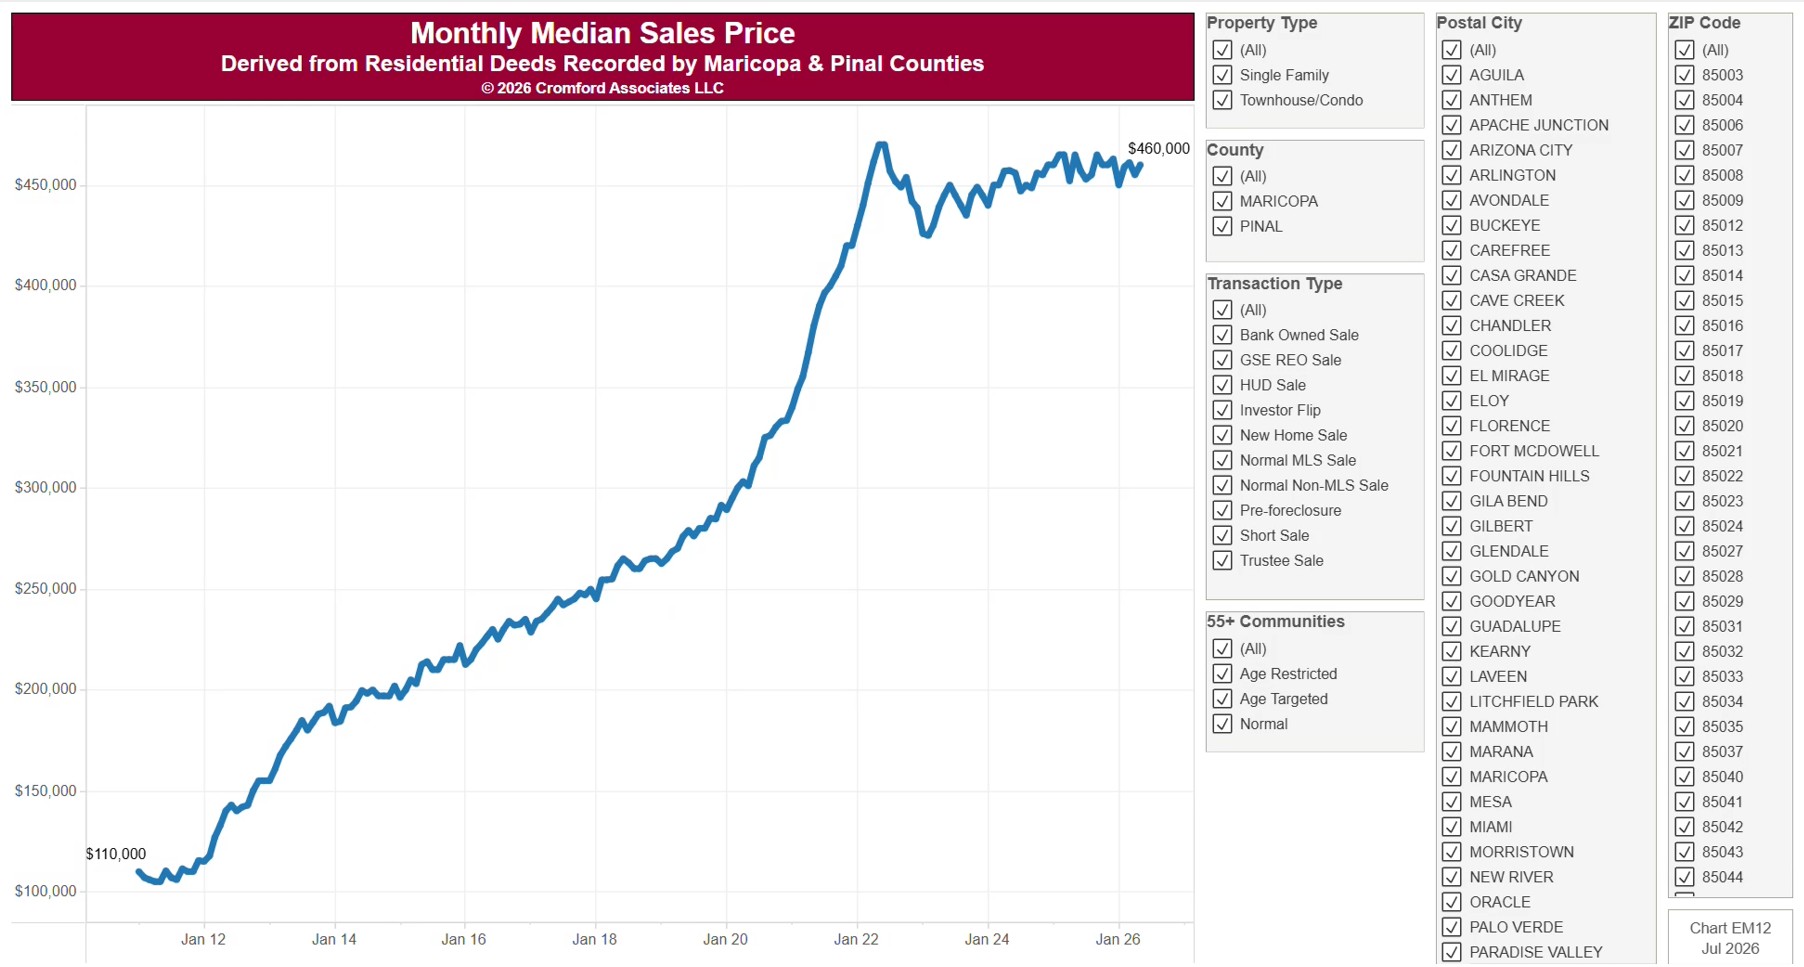
This chart shows the median sale price of homes as a line by calendar month since January 2011, from residential deeds recorded by Maricopa and Pinal Counties. It is the same series as EM11, drawn as a line to show the trend. The median is the price in the middle: half sold for more and half for less. Because it is built from recorded deeds, it covers every recorded sale, not just homes listed on ARMLS: new homes, private sales, and investor deals are all included.

It opens on Maricopa and Pinal Counties with everything included. Narrow it with the County, City, and ZIP panels, the Transaction Type, Property Type, and 55+ Communities boxes, and the sale price and home size sliders.

The records run to the end of last month and are updated monthly. Hover over the line to see the exact figure for that month.

Accepted Contracts vs. Back on Market

About this chart

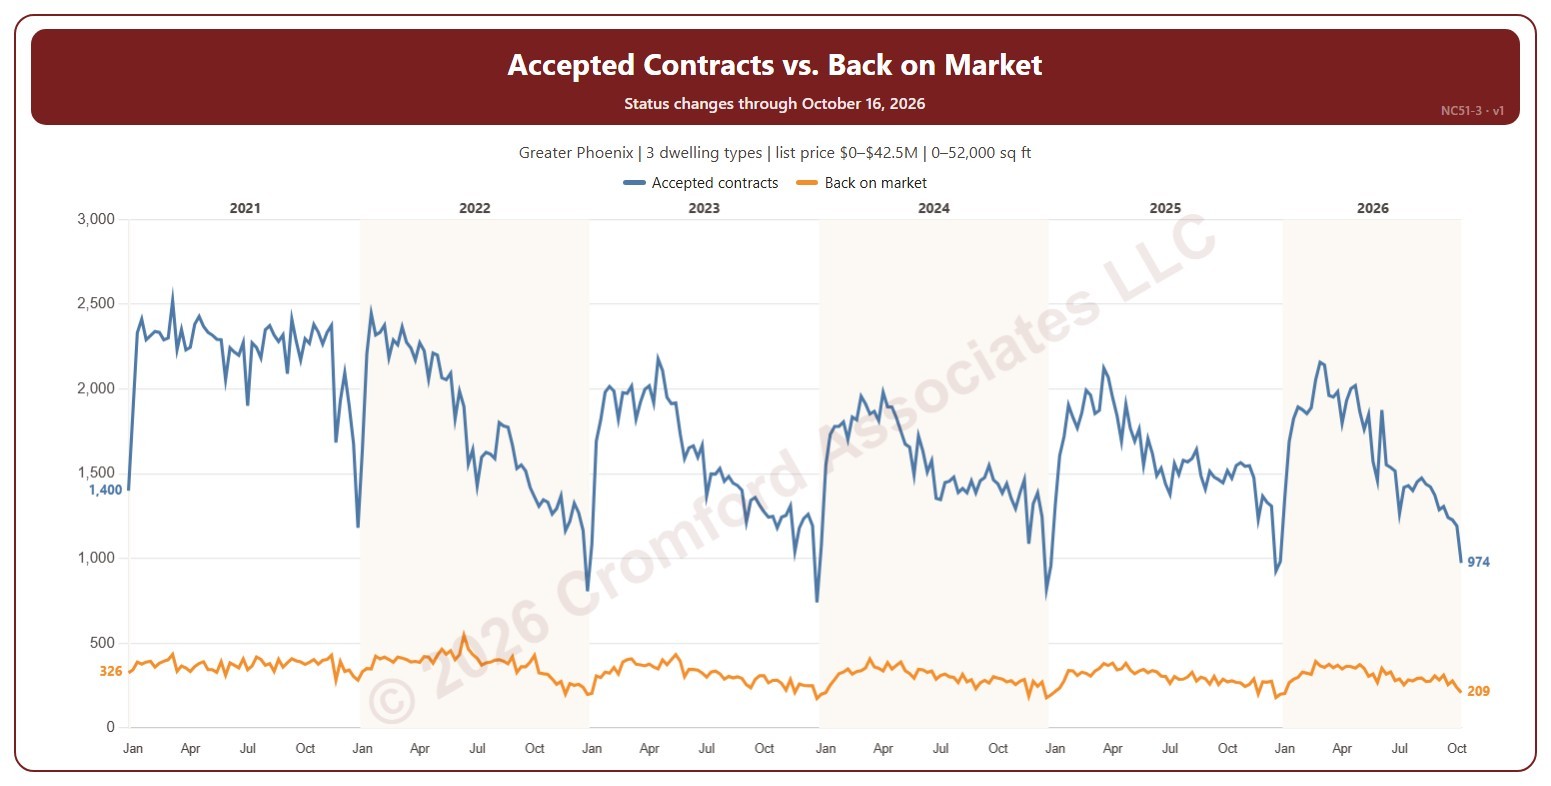
This chart compares, each week, the number of contracts accepted with the number of listings that came back on the market from pending or UCB / CCBS (contracts that fell through or were suspended). An accepted contract is a listing on ARMLS that went from active (or temporarily off the market) to pending or UCB / CCBS, counted on the day the change appeared.

Weeks run Sunday to Saturday. It opens on January five years back to date; drag the handles of the date slider under the chart to choose the weeks shown, as far back as 2014. The chart is updated every week.

It opens on the Greater Phoenix area: the counties, cities, and ZIP codes that make it up are ticked to start with. Tick or untick any of them to change the area, including counties beyond Greater Phoenix. Narrow it further with the Dwelling Type, Transaction Type, and New / Resale boxes and the list price, home size, and year built sliders.

Hover over the chart to see both counts for that week.

Accepted Contracts Weekly by Year

About this chart

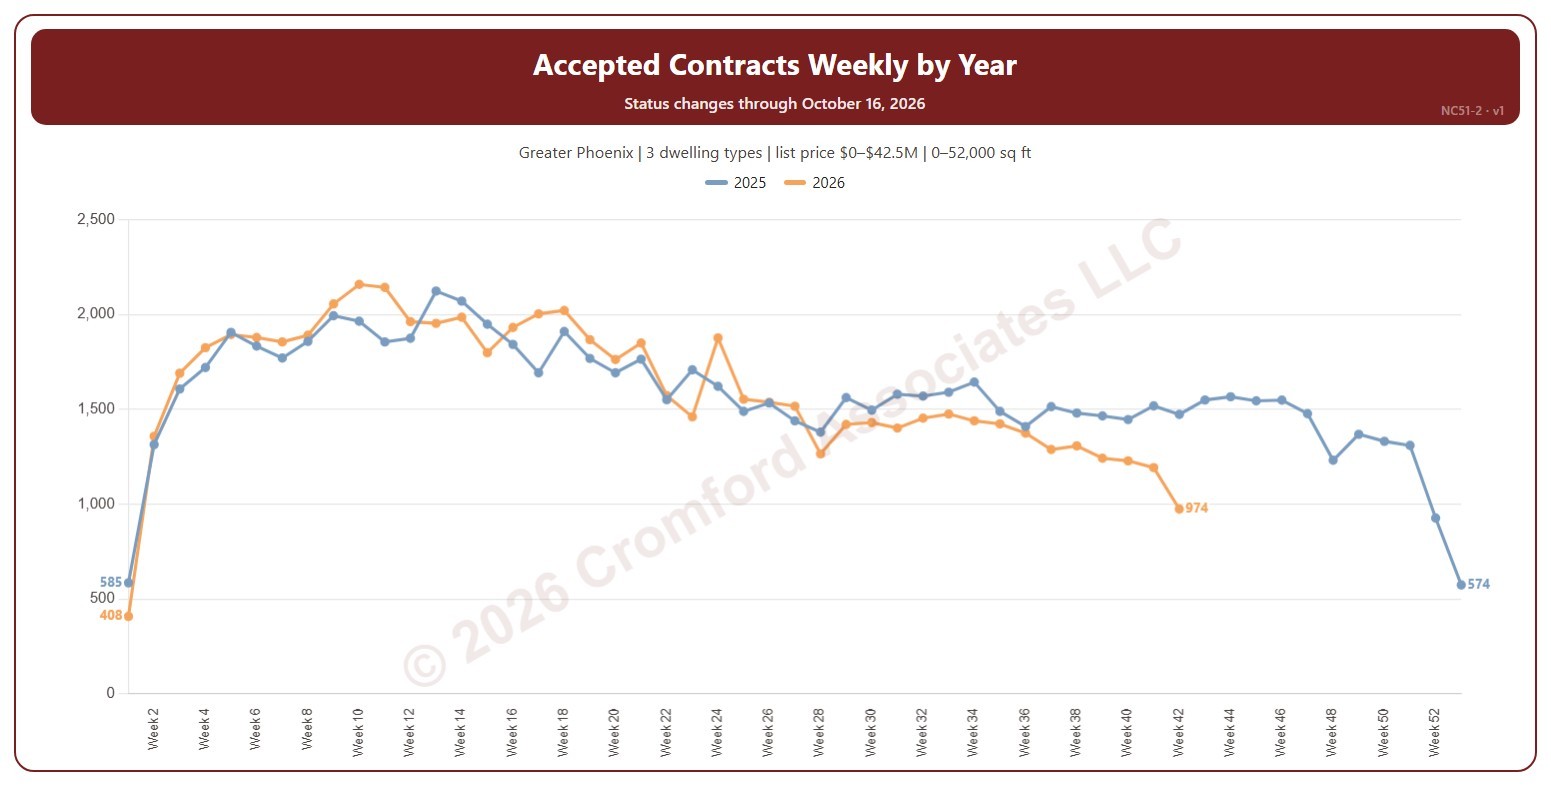
This chart shows the number of contracts accepted each week, a line per year by week number, so this year can be read against earlier years. An accepted contract is a listing on ARMLS that went from active (or temporarily off the market) to pending or UCB / CCBS, counted on the day the change appeared.

Weeks run Sunday to Saturday. Week 1 of each year starts on 1 January, so the first and last weeks of a year can be short. It opens on the latest 2 years; tick other years in the Year box to go back as far as 2014. The chart is updated every week.

It opens on the Greater Phoenix area: the counties, cities, and ZIP codes that make it up are ticked to start with. Tick or untick any of them to change the area, including counties beyond Greater Phoenix. Narrow it further with the Dwelling Type, Transaction Type, and New / Resale boxes and the list price, home size, and year built sliders.

Hover over the chart to see each year’s count for that week.

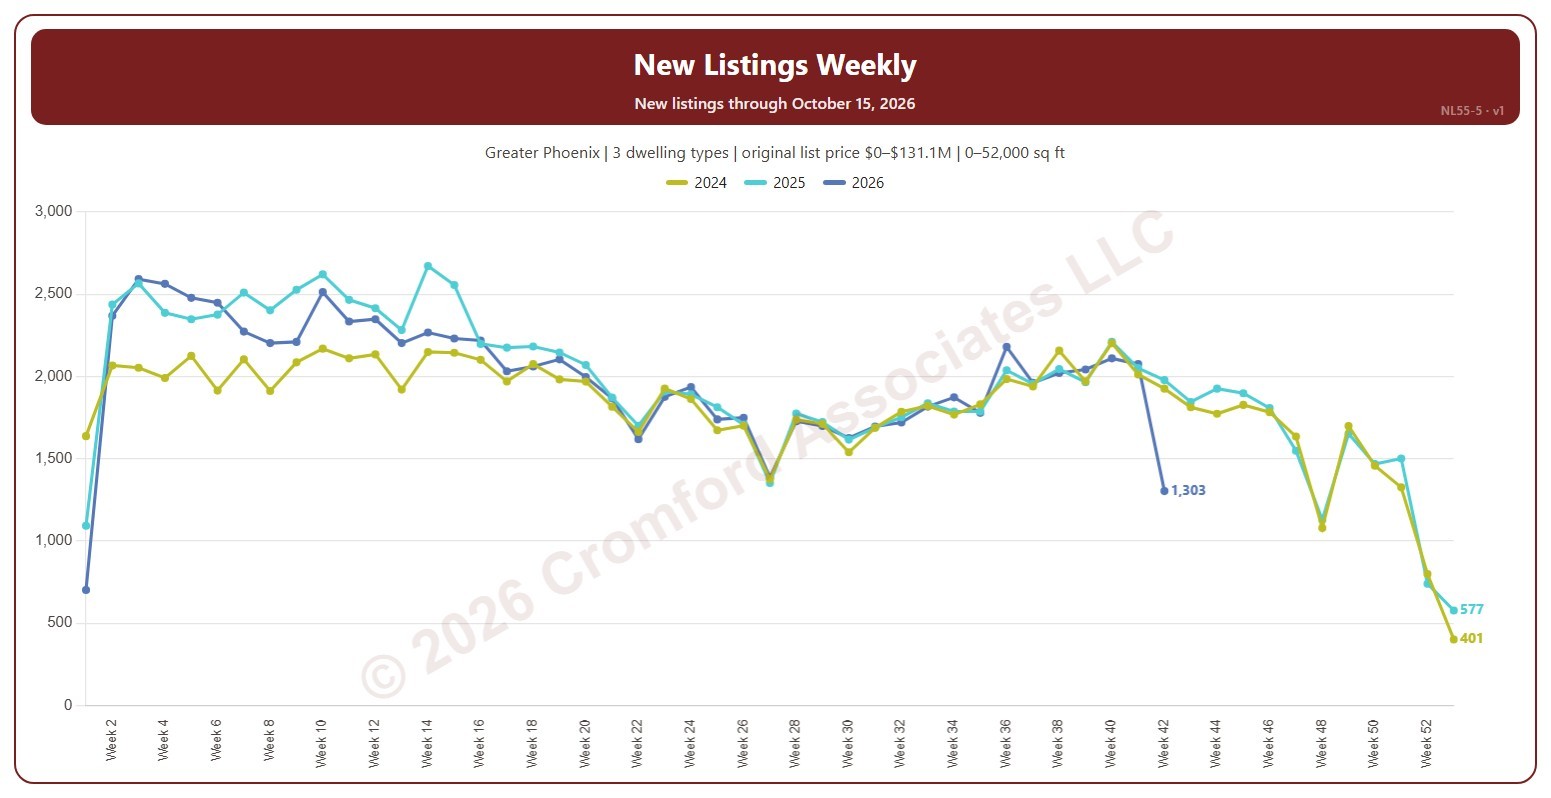
New Listings Weekly

About this chart

This chart shows the number of new listings each week, a line per year. Weeks run Sunday to Saturday and week 1 of each year starts on 1 January, so the first and last weeks of a year can be short. A new listing is any listing on ARMLS, counted on the date it was listed, whatever happened to it afterwards (sold, expired, cancelled, or still for sale).

It opens on the latest 3 years; tick other years in the Year box to go back as far as 2001. The newest week is the week so far. The chart is updated every day.

It opens on the Greater Phoenix area: the counties, cities, and ZIP codes that make it up are ticked to start with. Tick or untick any of them to change the area, including counties beyond Greater Phoenix. Narrow it further with the Dwelling Type, Transaction Type, and New / Resale boxes and the original list price, home size, and year built sliders.

Hover over the chart to see each year’s count for that week.

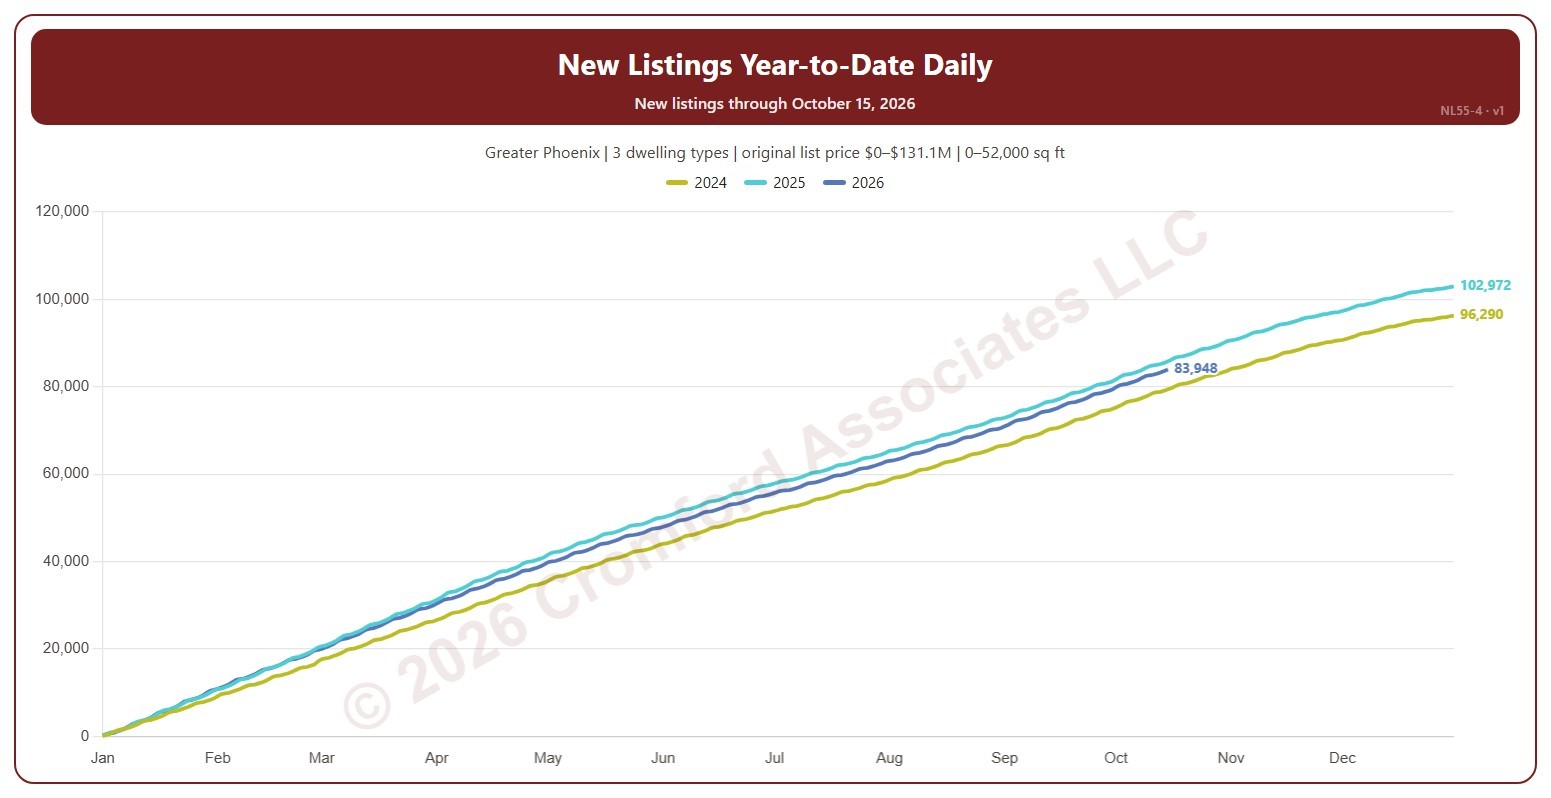
New Listings Year-to-Date Daily

About this chart

This chart shows the running total of new listings from 1 January to each day of the year, a line per year, so this year’s pace can be read against earlier years. Listings on 29 February are counted with 28 February. A new listing is any listing on ARMLS, counted on the date it was listed, whatever happened to it afterwards (sold, expired, cancelled, or still for sale).

It opens on the latest 3 years; tick other years in the Year box to go back as far as 2001. Use Zoom to latest to see the newest day and a month either side, with every year’s total on that date. The chart is updated every day.

It opens on the Greater Phoenix area: the counties, cities, and ZIP codes that make it up are ticked to start with. Tick or untick any of them to change the area, including counties beyond Greater Phoenix. Narrow it further with the Dwelling Type, Transaction Type, and New / Resale boxes and the original list price, home size, and year built sliders.

Hover over the chart to see each year’s total on that day.

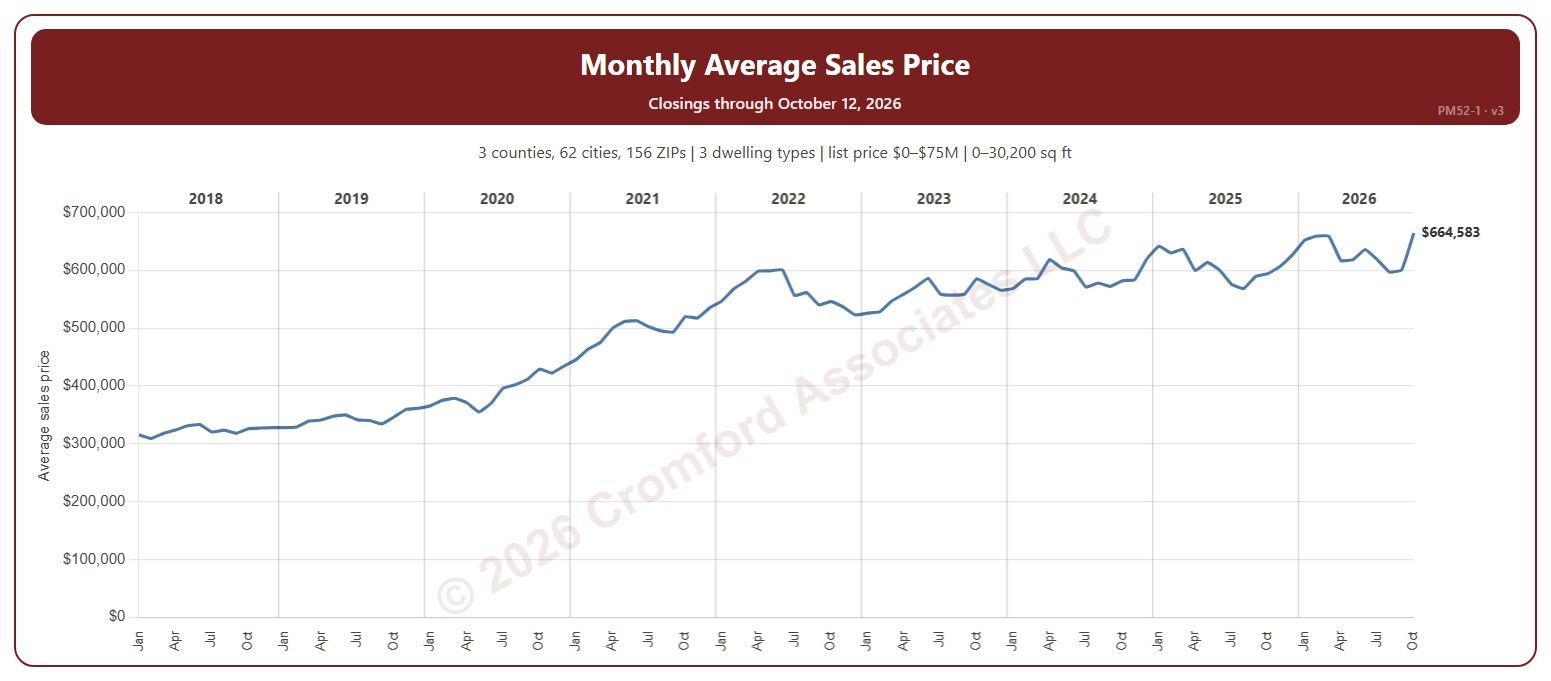
Monthly Average Sales Price

About this chart

This chart shows the average sale price of the homes that closed each month on ARMLS.

It opens on January 2018 to date; drag the handles of the date slider under the chart to choose the months shown. It goes back to January 2008. The list price slider runs up to $75 million. The newest month is the month so far.

It opens on the Greater Phoenix area: the counties, cities, and ZIP codes that make it up are ticked to start with. Tick or untick any of them to change the area, including counties beyond Greater Phoenix. Narrow it further with the Dwelling Type, Transaction Type, and New / Resale boxes and the list price, home size, and year built sliders.

Hover over the chart to see the figures for that month.