Monthly Median Sales Price by City – Weekly

About this chart

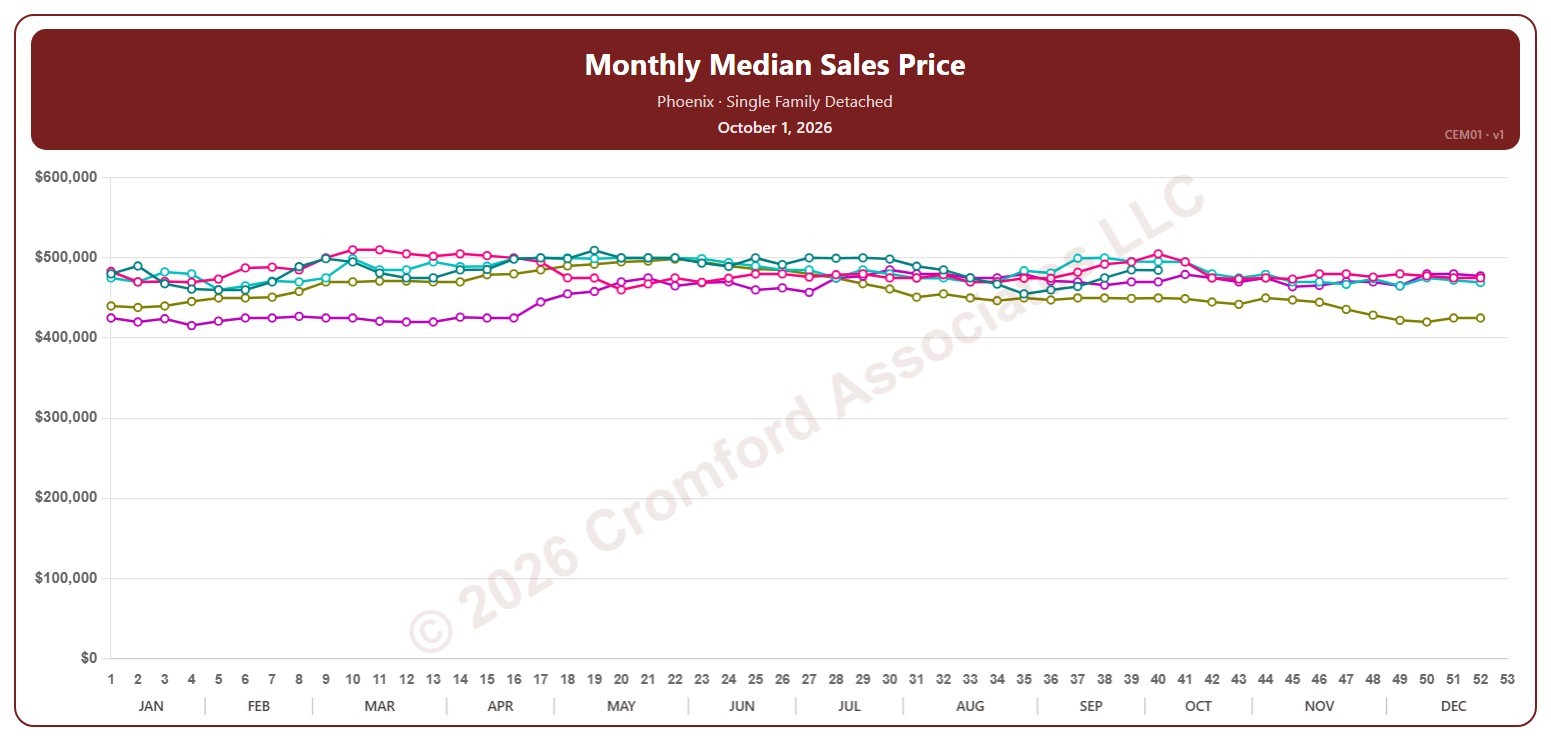
This chart shows the median sales price of single-family detached homes that closed through ARMLS in one city, measured every week on Thursdays. Each point covers the closings in the month up to that week; the median is the price in the middle, so half sold for more and half for less.

Each year has its own line, laid out by week of the year, so you can compare this year with earlier years at the same point in the season. It opens on Phoenix and the last five years. Pick any of the 34 cities (18 major and 16 secondary) from the City list, and tick any year back to 2001 in the Year panel.

Hover over a line to see the exact figure for that week.
Cromford® Market Index – Monthly

About this chart

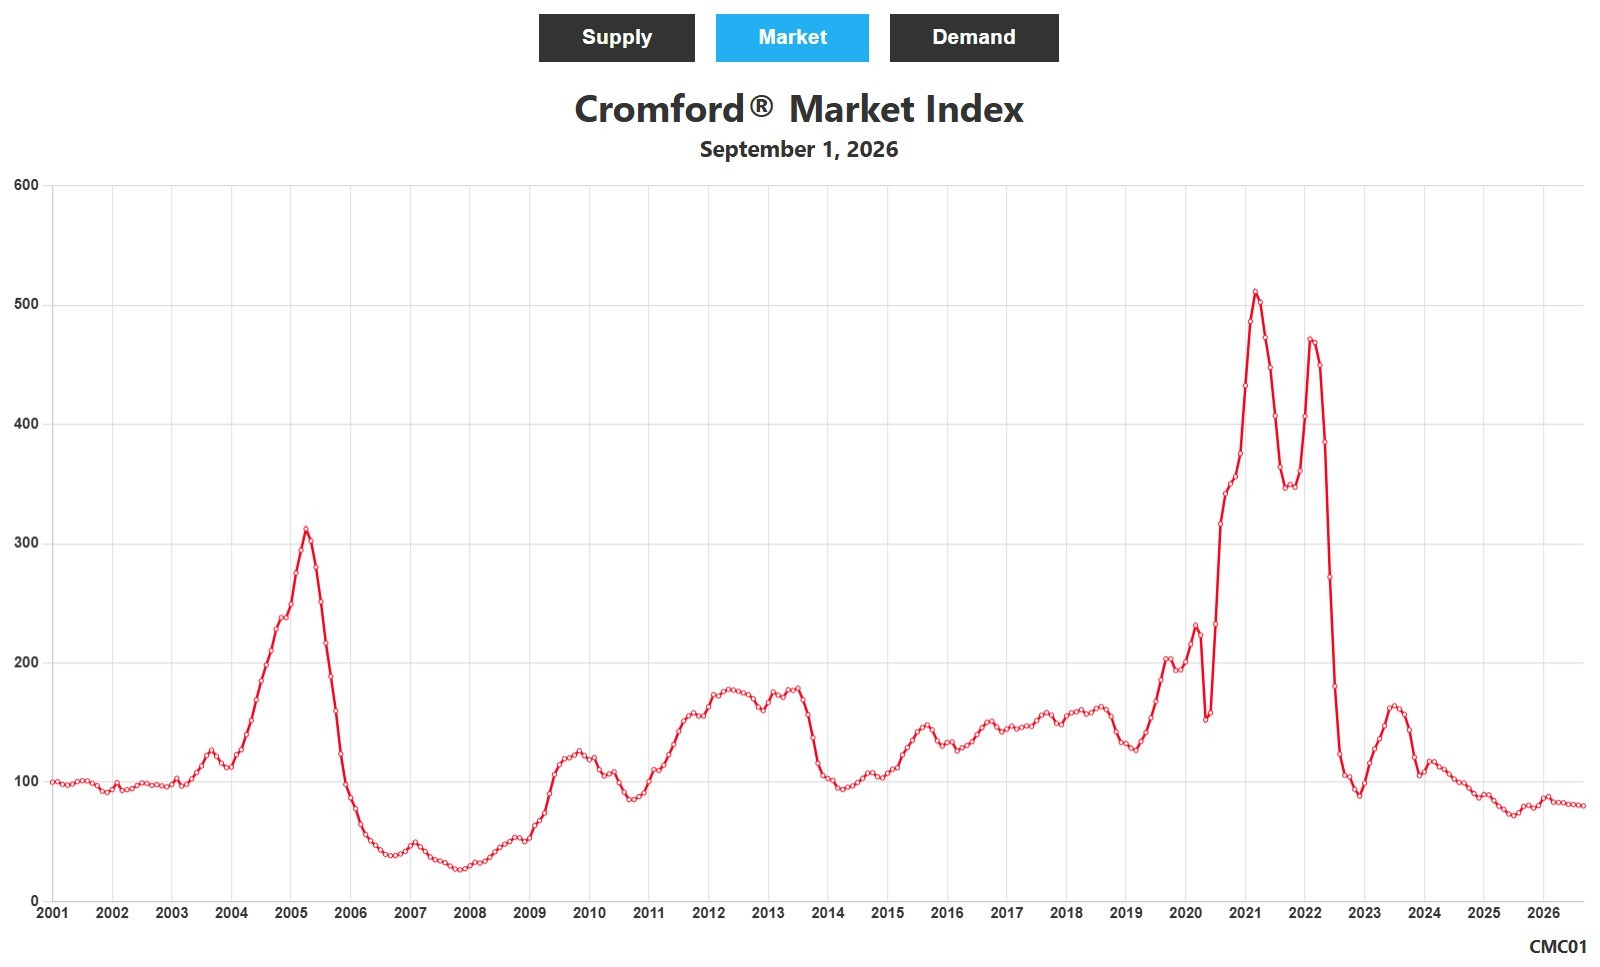
This chart shows the Cromford® Supply, Market, and Demand Indices for the whole ARMLS market, all areas and all dwelling types, one reading on the 1st of each month since January 2001. Use the Supply, Market, and Demand buttons to choose the index shown.

A reading below 90 indicates a buyer’s market, above 110 a seller’s market, and between 90 and 110 a balanced market. For Supply and Demand, above 100 means more than usual and below 100 less than usual; low supply and high demand favor sellers.

Hover over the line to see the exact reading for that month.

Months of Supply (including UCB & CCBS) by City – Weekly

About this chart

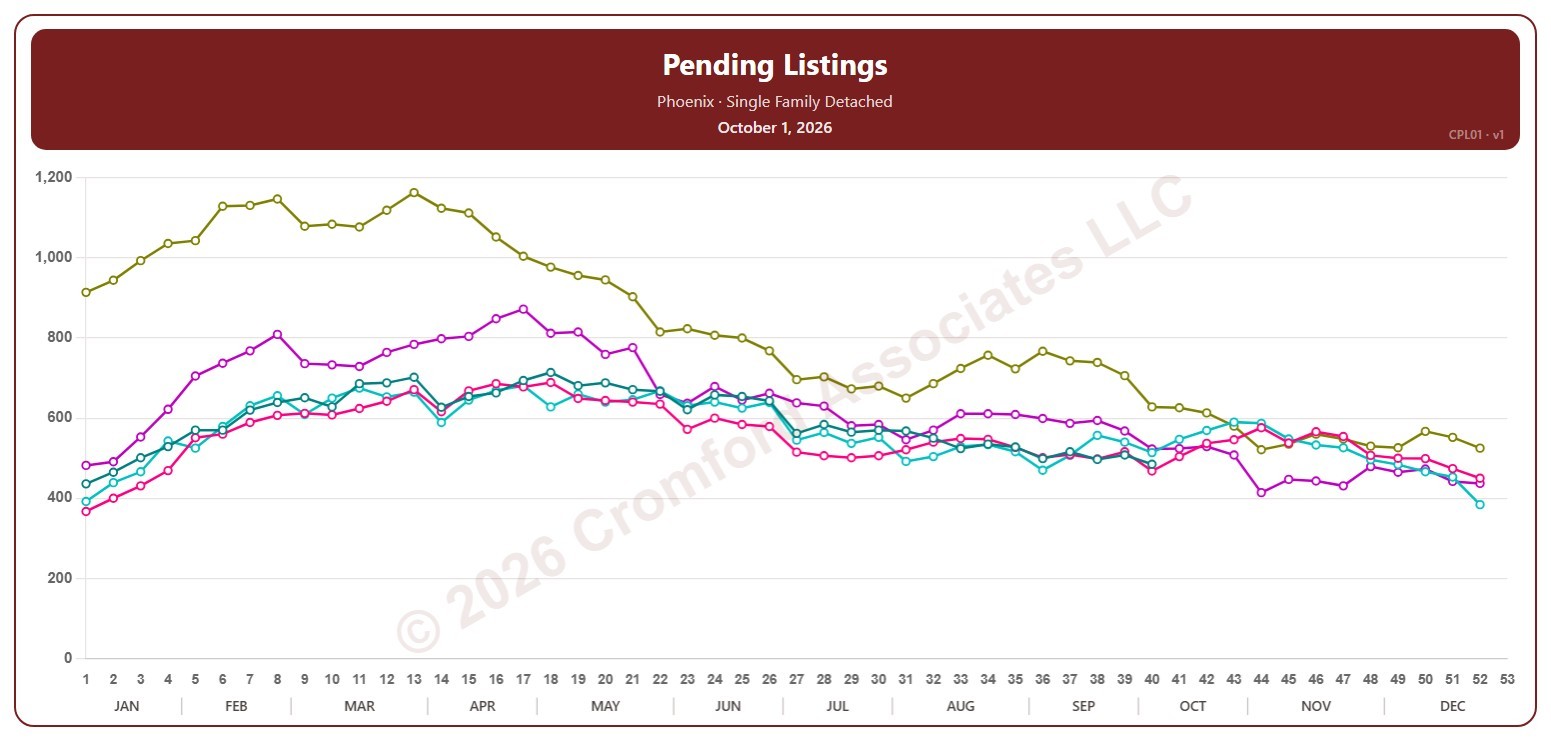
This chart shows months of supply for single-family detached homes on ARMLS in one city, measured every week on Thursdays: how many months it would take to sell all the active listings (including UCB / CCBS) at the rate homes sold over the last month, if no new listings came on. The lower the number, the tighter the supply.

Each year has its own line, laid out by week of the year, so you can compare this year with earlier years at the same point in the season. It opens on Phoenix and the last five years. Pick any of the 34 cities (18 major and 16 secondary) from the City list, and tick any year back to 2006 in the Year panel. Queen Creek and San Tan Valley start in 2010, and Coolidge, Florence, Waddell, and Wickenburg in 2011.

Hover over a line to see the exact figure for that week.

Cromford® Market Index – Weekly

About this chart

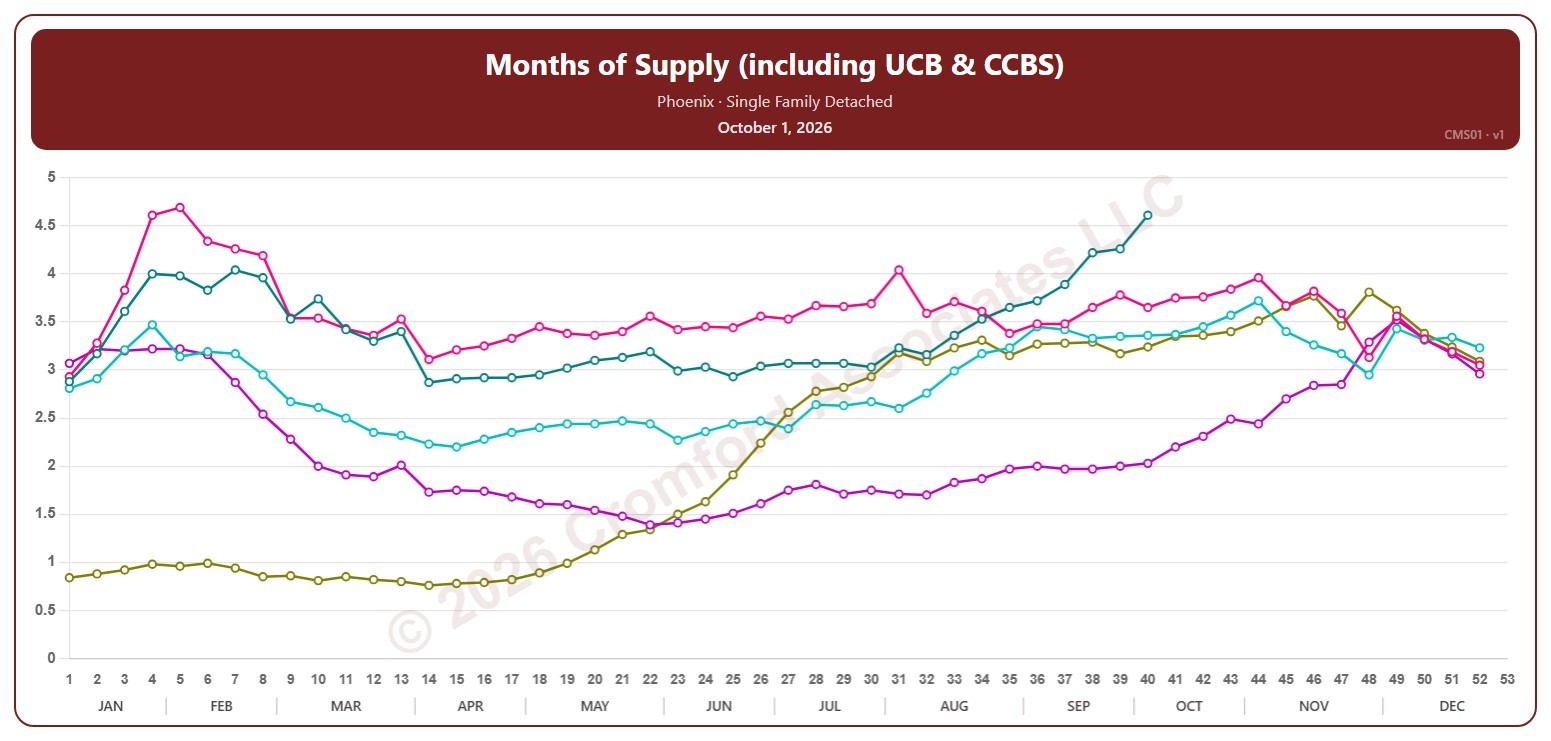
This chart shows the Cromford® Market Index for the whole ARMLS market, all areas and all dwelling types, read every Saturday. A reading below 90 indicates a buyer’s market, above 110 a seller’s market, and between 90 and 110 a balanced market.

Each year has its own line, laid out by week of the year (each Saturday), so you can compare this year with earlier years at the same point in the season. It opens on the last four years; tick any year back to 2001 in the Year panel.

Hover over a line to see the exact figure for that week.
Pending Listings by City – Weekly

About this chart

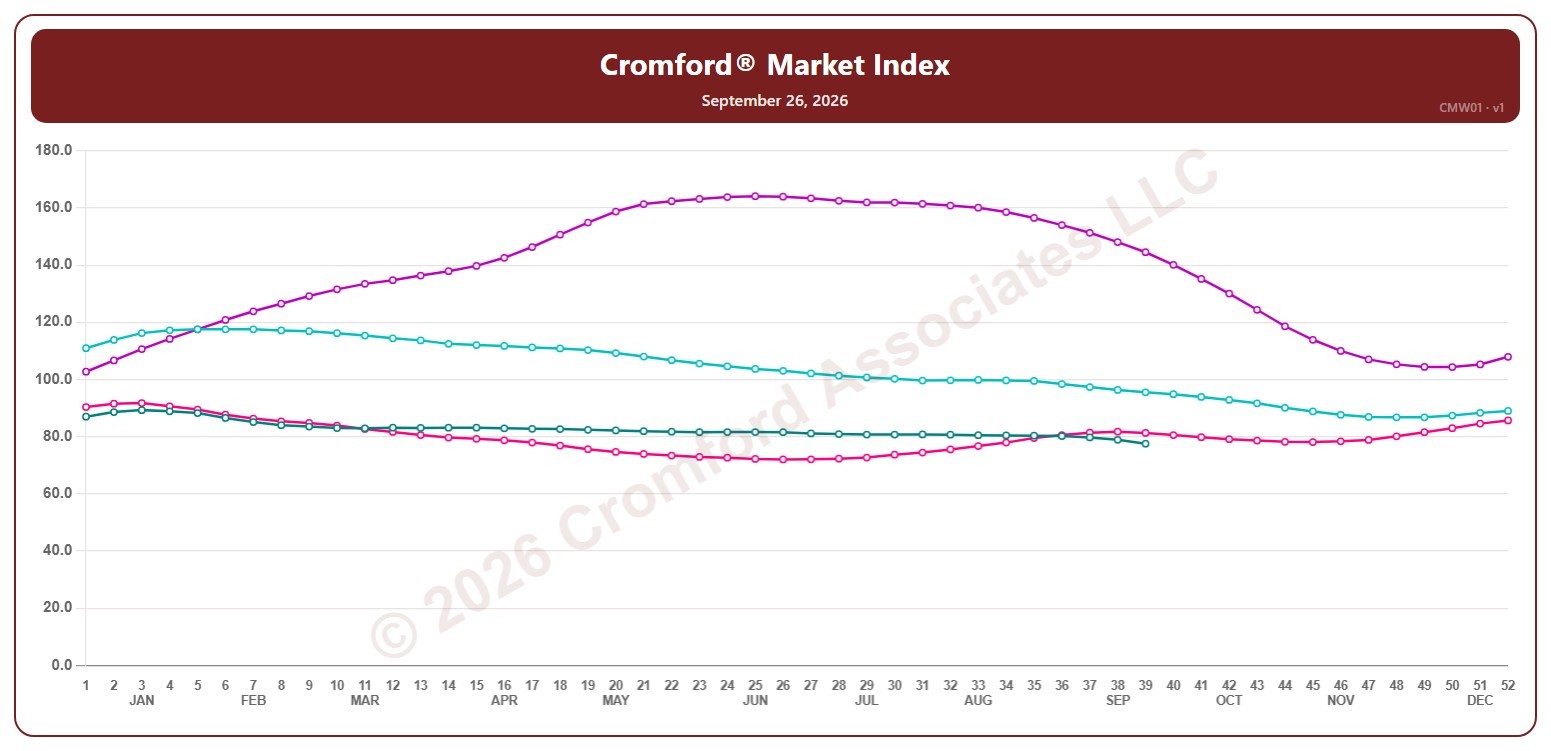
This chart counts the Pending listings for single-family detached homes on ARMLS in one city, measured every week on Thursdays: homes under contract that have not yet closed.

Each year has its own line, laid out by week of the year, so you can compare this year with earlier years at the same point in the season. It opens on Phoenix and the last five years. Pick any of the 34 cities (18 major and 16 secondary) from the City list, and tick any year back to 2006 in the Year panel. Queen Creek and San Tan Valley start in 2010, and Coolidge, Florence, Waddell, and Wickenburg in 2011.

Hover over a line to see the exact figure for that week.

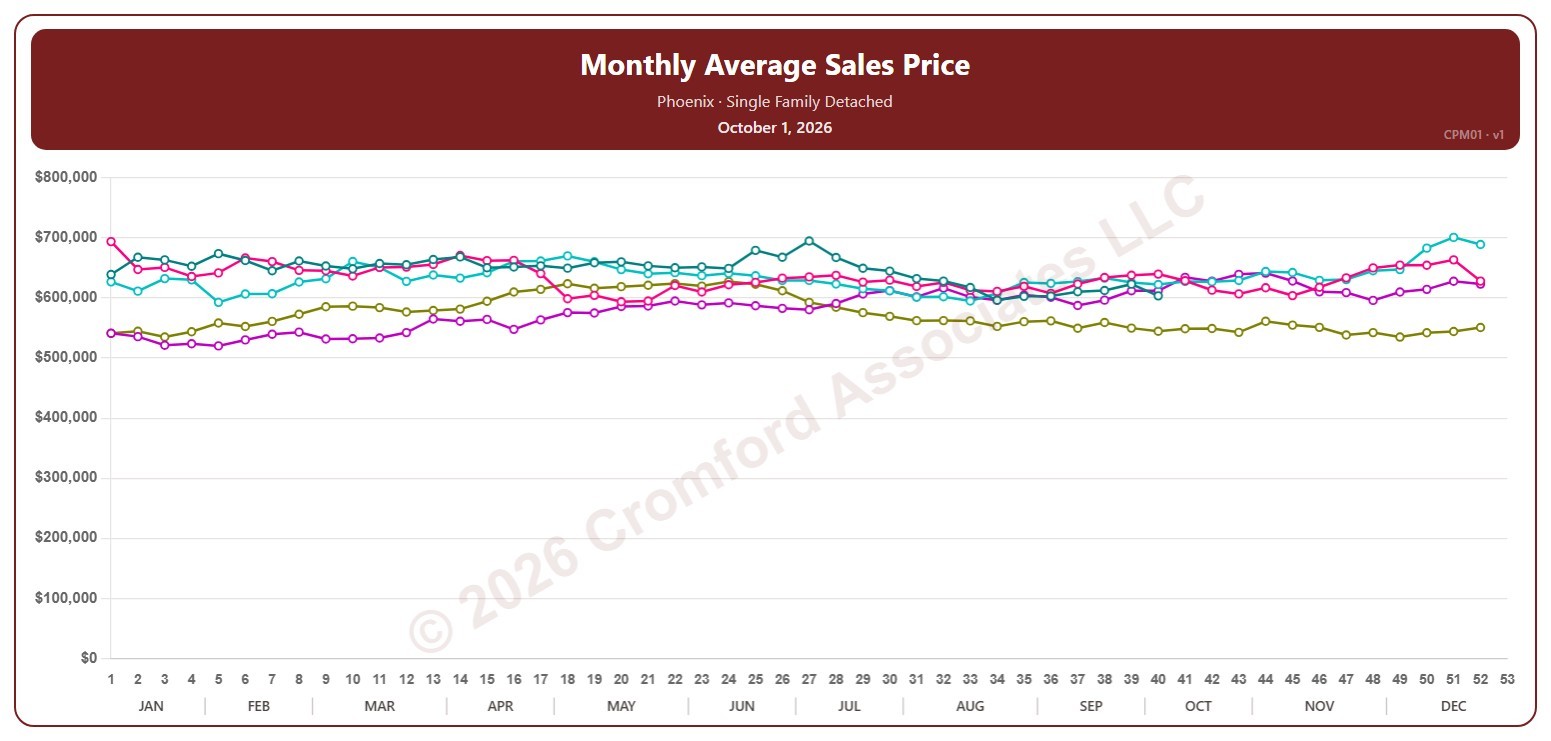
Monthly Average Sales Price by City – Weekly

About this chart

This chart shows the average sales price of single-family detached homes that closed through ARMLS in one city, measured every week on Thursdays. Each point covers the closings in the month up to that week.

Each year has its own line, laid out by week of the year, so you can compare this year with earlier years at the same point in the season. It opens on Phoenix and the last five years. Pick any of the 34 cities (18 major and 16 secondary) from the City list, and tick any year back to 2001 in the Year panel.

Hover over a line to see the exact figure for that week.
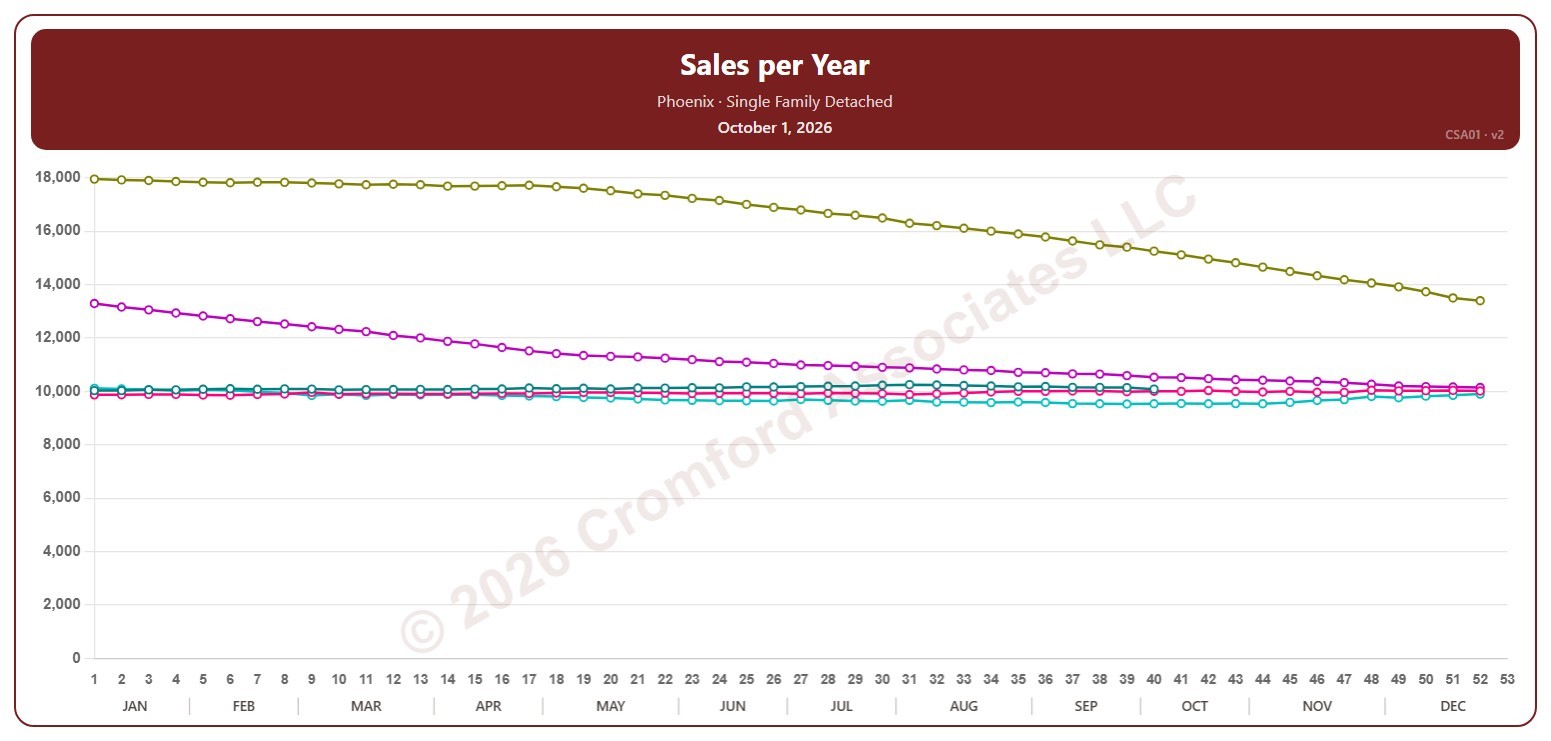
Sales per Year by City – Weekly

About this chart

This chart counts the single-family detached homes that closed through ARMLS in one city, measured every week on Thursdays. Each point is the number of closings in the 12 months up to that week, which smooths out the seasonal swings.

Each year has its own line, laid out by week of the year, so you can compare this year with earlier years at the same point in the season. It opens on Phoenix and the last five years. Pick any of the 34 cities (18 major and 16 secondary) from the City list, and tick any year back to 2001 in the Year panel.

Hover over a line to see the exact figure for that week.
Sales per Month by City – Weekly

About this chart

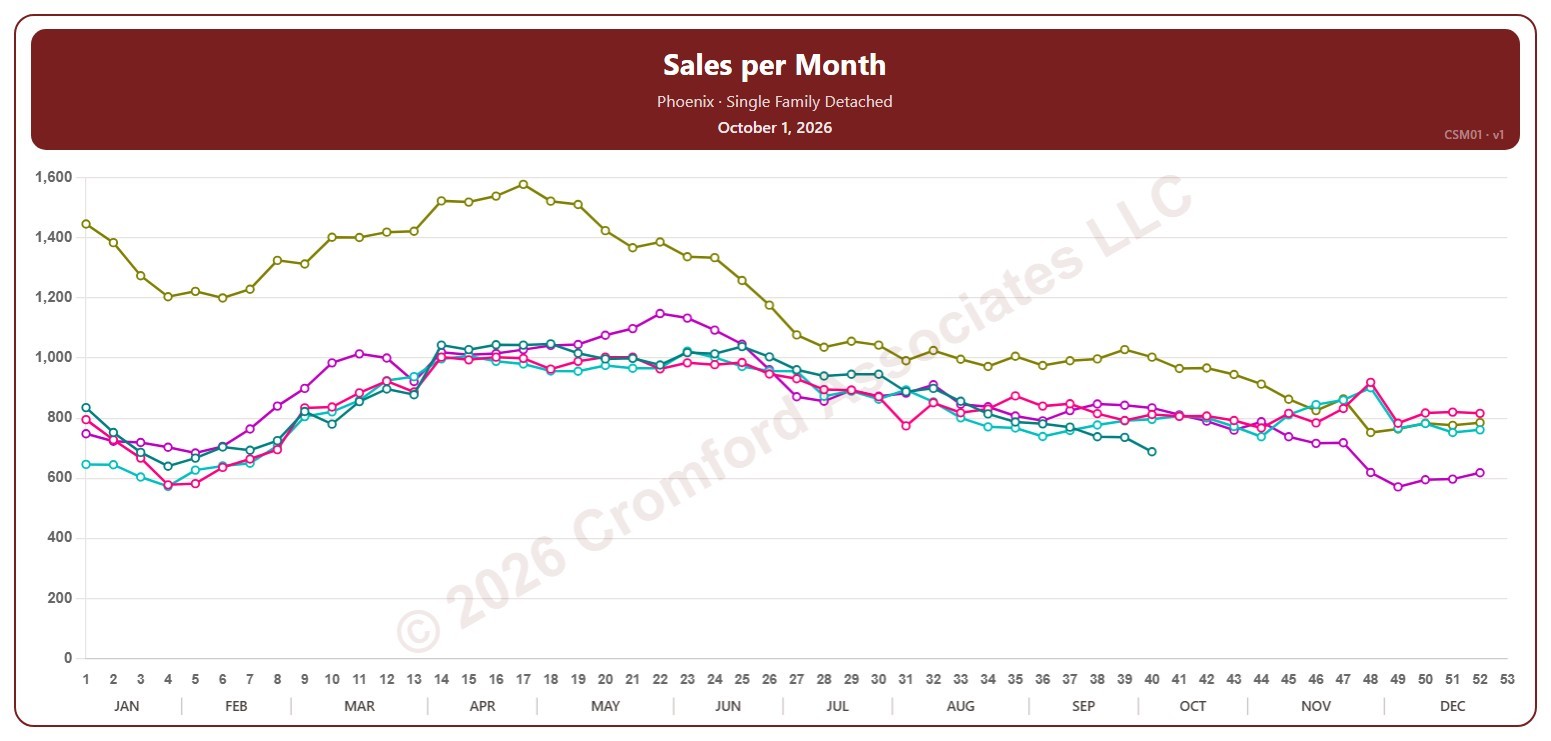
This chart counts the single-family detached homes that closed through ARMLS in one city, measured every week on Thursdays. Each point is the number of closings in the month up to that week.

Each year has its own line, laid out by week of the year, so you can compare this year with earlier years at the same point in the season. It opens on Phoenix and the last five years. Pick any of the 34 cities (18 major and 16 secondary) from the City list, and tick any year back to 2001 in the Year panel.

Hover over a line to see the exact figure for that week.
Annual Average Sales Price per Square Foot by City – Weekly

About this chart

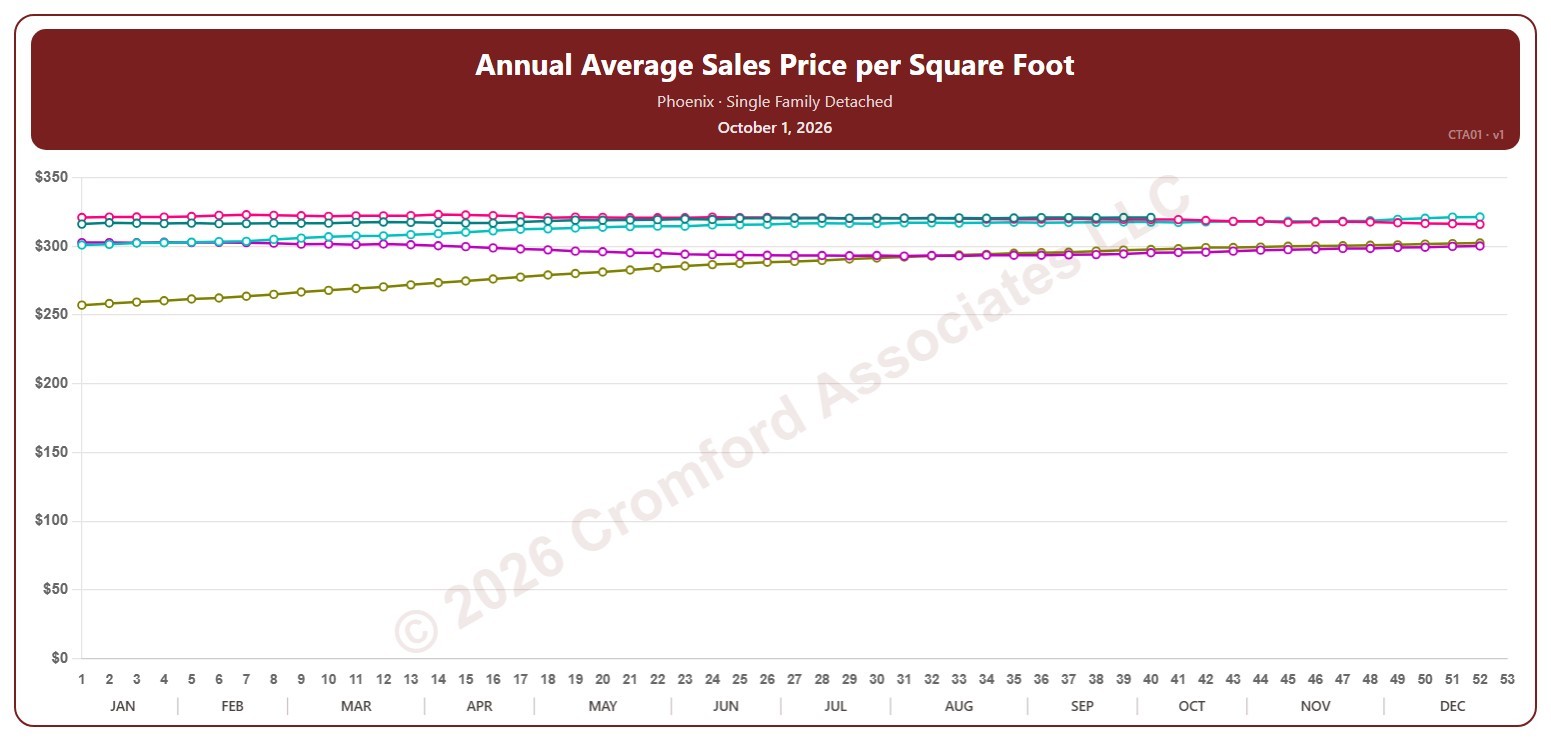
This chart shows the average sales price per square foot of single-family detached homes that closed through ARMLS in one city, measured every week on Thursdays. Each point covers the closings in the 12 months up to that week. Price per square foot lets you compare homes of different sizes.

Each year has its own line, laid out by week of the year, so you can compare this year with earlier years at the same point in the season. It opens on Phoenix and the last five years. Pick any of the 34 cities (18 major and 16 secondary) from the City list, and tick any year back to 2001 in the Year panel.

Hover over a line to see the exact figure for that week.
Monthly Average Sales Price per Square Foot by City – Weekly

About this chart

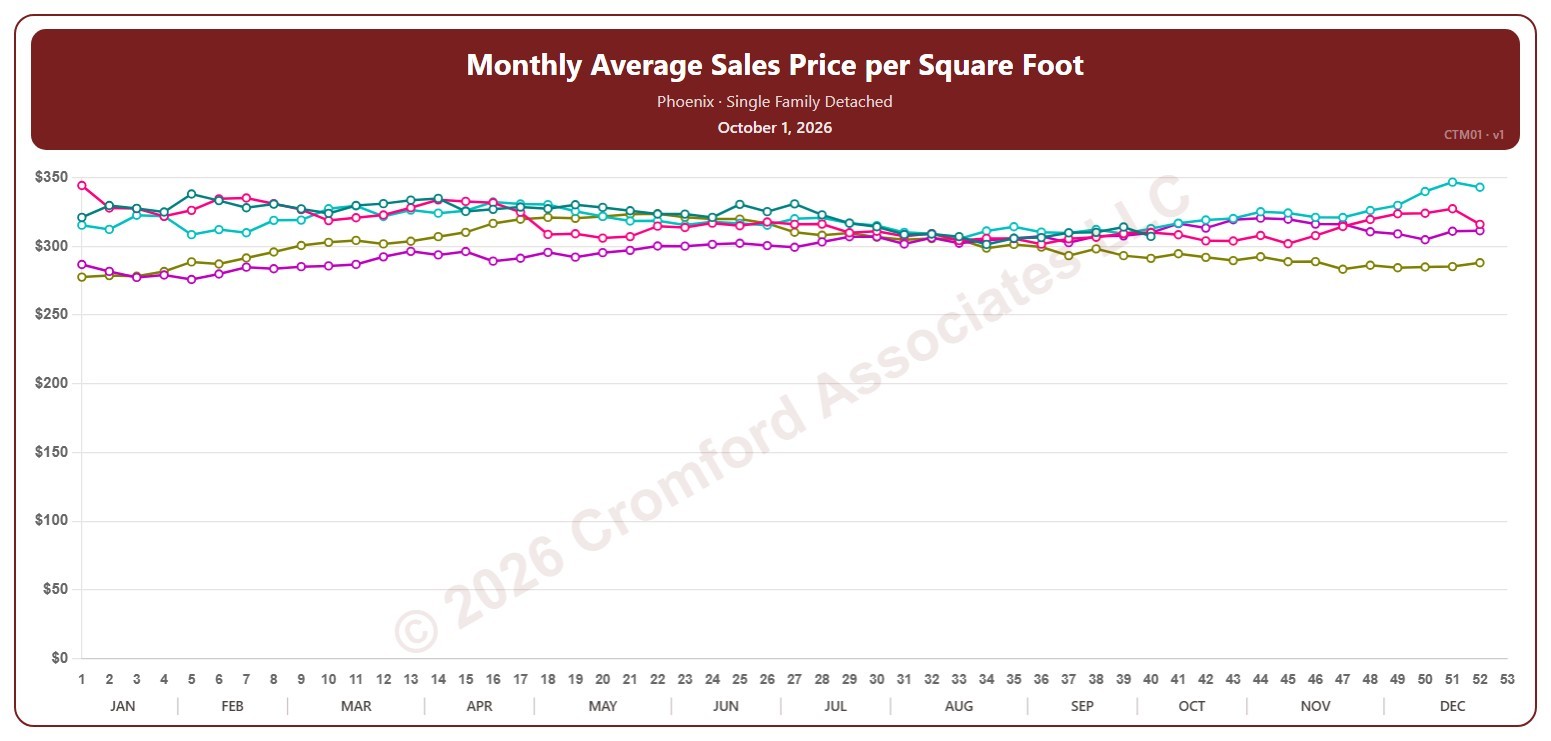
This chart shows the average sales price per square foot of single-family detached homes that closed through ARMLS in one city, measured every week on Thursdays. Each point covers the closings in the month up to that week. Price per square foot lets you compare homes of different sizes.

Each year has its own line, laid out by week of the year, so you can compare this year with earlier years at the same point in the season. It opens on Phoenix and the last five years. Pick any of the 34 cities (18 major and 16 secondary) from the City list, and tick any year back to 2001 in the Year panel.

Hover over a line to see the exact figure for that week.