Office Listing Success Rate

About this chart

This chart compares how often each brokerage office’s listings sell. It covers listings added to ARMLS in the last 12 months, and the success rate is the share of them that closed rather than expired or being cancelled. Each listing is credited to its listing office.

A listing counts once it has closed, expired, or been cancelled. Listings that are still active, under contract, or temporarily off the market are not counted yet, so the most recent months contribute fewer listings than earlier ones. An office needs at least 50 such listings in the selection to appear.

Narrow the comparison with the County, Region, City, Dwelling Type, and Price Range controls; the City list follows the county you pick, and you can tick any combination of the 16 price ranges. New Construction lets you include or exclude homes built this year or in the previous two. The tiles show the totals and the overall success rate for the selection, as a yardstick for each office.

The bar chart shows the top 10, 25, 50, or 100 offices, ranked by success rate and then by the number of listings. The table below lists every office that qualifies; search it by office name or ID, and click a column heading to sort by it. Many brokerages have several offices with the same name, so the table shows each office with its ARMLS office ID.

Offices that list new homes for a builder, or homes for an iBuyer or an institutional investor, are listing their own client’s inventory and tend to show unusually high success rates for that reason.
Agent Listing Success Rate

About this chart

This chart compares how often each listing agent’s listings sell. It covers listings added to ARMLS in the last 12 months, and the success rate is the share of them that closed rather than expired or being cancelled. Each listing is credited to its listing agent.

A listing counts once it has closed, expired, or been cancelled. Listings that are still active, under contract, or temporarily off the market are not counted yet, so the most recent months contribute fewer listings than earlier ones. An agent needs at least 10 such listings in the selection to appear.

Narrow the comparison with the County, Region, City, Dwelling Type, and Price Range controls; the City list follows the county you pick, and you can tick any combination of the 16 price ranges. New Construction lets you include or exclude homes built this year or in the previous two. The tiles show the totals and the overall success rate for the selection, as a yardstick for each agent.

The bar chart shows the top 10, 25, 50, or 100 agents, ranked by success rate and then by the number of listings. The table below lists every agent that qualifies, with the office they listed through most often. Search it by name, agent ID, or office, and click a column heading to sort by it.

A high rate on a handful of listings means less than the same rate on many, so read the success rate together with the number of listings.

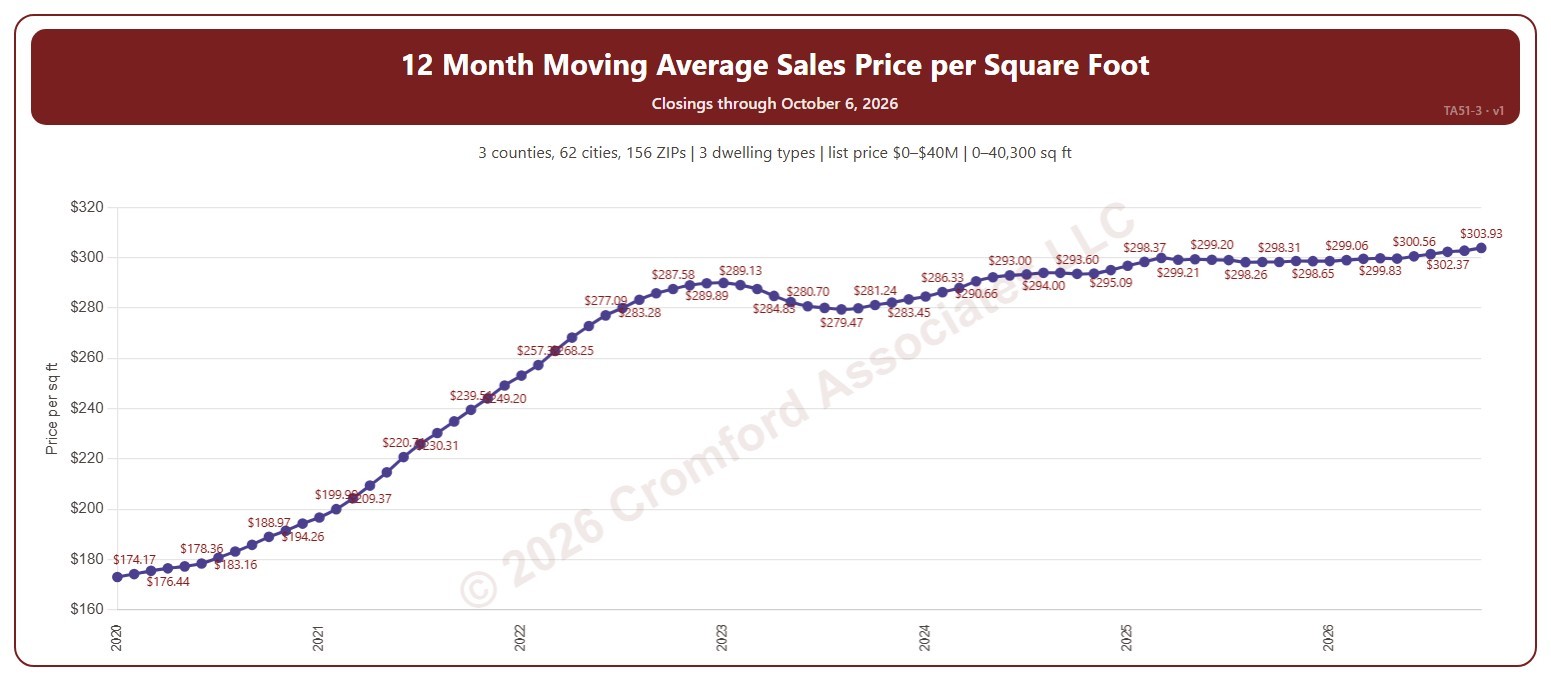
12 Month Moving Average Sales Price per Square Foot

About this chart

This chart shows the average sales price per square foot of the homes that closed through ARMLS over the 12 months ending with each calendar month: a 12-month moving average, across all the square feet sold. Price per square foot lets you compare homes of different sizes. The 12-month average smooths out the seasonal swings.

It opens on the years since 2020; tick any year back to 2000 in the Year panel. The newest month is the month so far.

It opens on the Greater Phoenix area: the counties, cities, and ZIP codes that make it up are ticked to start with. Tick or untick any of them to change the area, including counties beyond Greater Phoenix. Narrow it further with the Dwelling Type (condo, mobile, single family), Transaction Type, and New / Resale boxes and the list price, home size, and year built sliders.

Hover over the chart to see the figures for that month.

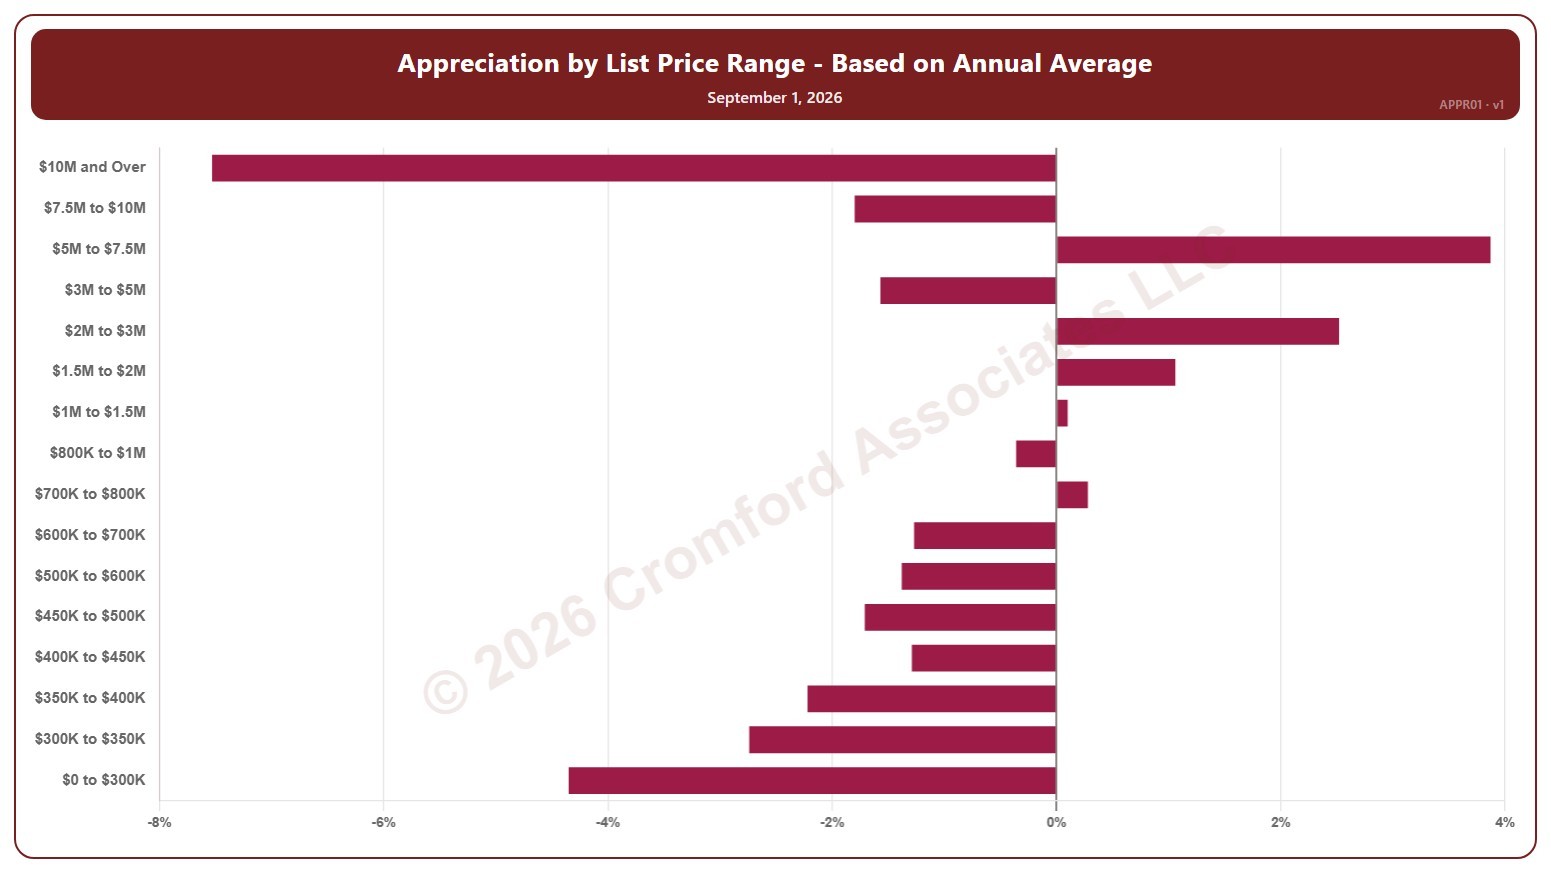
Appreciation by List Price Range – Based on Annual Average – Monthly

About this chart

This chart shows annual appreciation for single-family detached homes in Greater Phoenix, one bar for each of 16 list price bands from $0 to $300K up to $10M and over. Each bar is the change in the average sales price per square foot over the last 12 months, compared with the same period a year earlier, measured at the start of each month.

It shows which parts of the market are gaining or losing ground. A band with no closings in the period keeps its label but shows no bar.

Hover over a bar to see the exact figure for that band.

Annual Appreciation Based on Annual Average Price per Square Foot – Weekly

About this chart

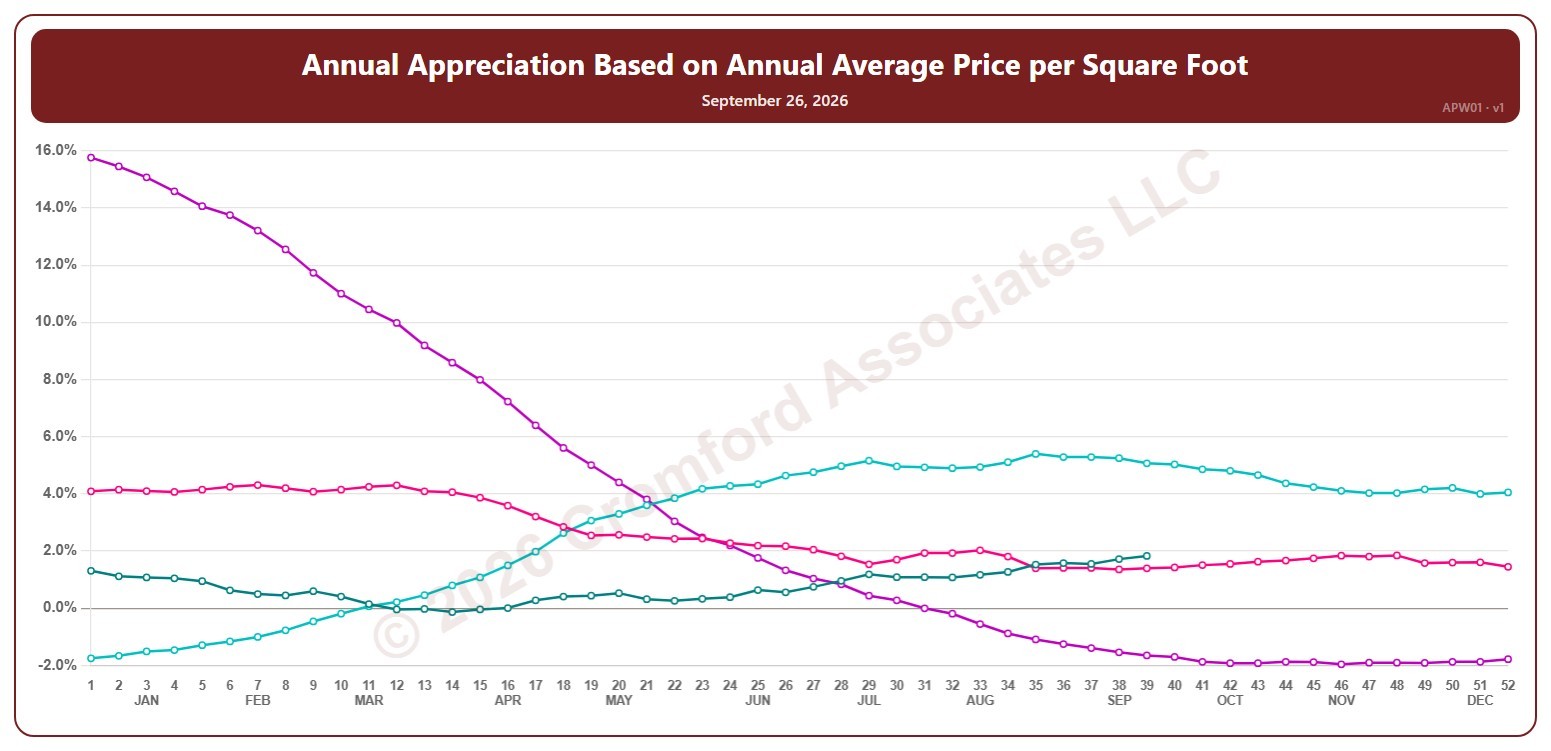
This chart shows annual appreciation, for the whole ARMLS market, all areas and all dwelling types, measured every week: the change in the average sales price per square foot of the homes that closed over the last 12 months, compared with the 12 months to the same date a year earlier. Above zero, prices are higher than a year ago; below zero, they are lower.

Each year has its own line, laid out by week of the year (each Saturday), so you can compare this year with earlier years at the same point in the season. It opens on the last four years; tick any year back to 2002 in the Year panel.

Hover over a line to see the exact figure for that week.

Appreciation Based on Annual Average $/SF by City – Weekly

About this chart

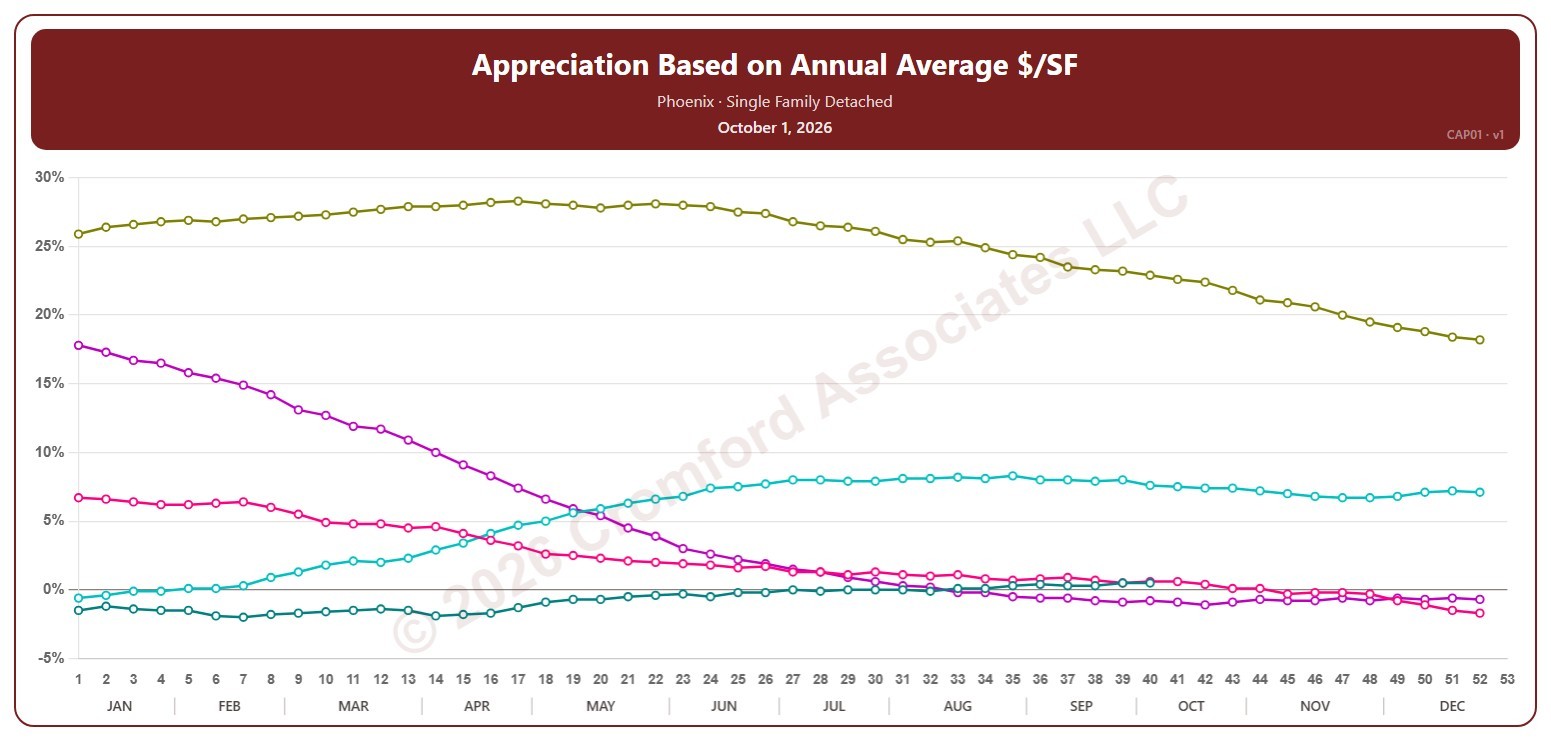
This chart shows annual appreciation for single-family detached homes in one city, measured every week on Thursdays: the change in the average sales price per square foot over the last 12 months compared with the 12 months to the same date a year earlier. Above zero, prices are higher than a year ago; below zero, they are lower.

Each year has its own line, laid out by week of the year, so you can compare this year with earlier years at the same point in the season. It opens on Phoenix and the last five years. Pick any of the 34 cities (18 major and 16 secondary) from the City list, and tick any year back to 2002 in the Year panel.

Hover over a line to see the exact figure for that week.

Annual Appreciation (Based on Annual Average Sales Price per Square Foot) by City – Monthly

About this chart

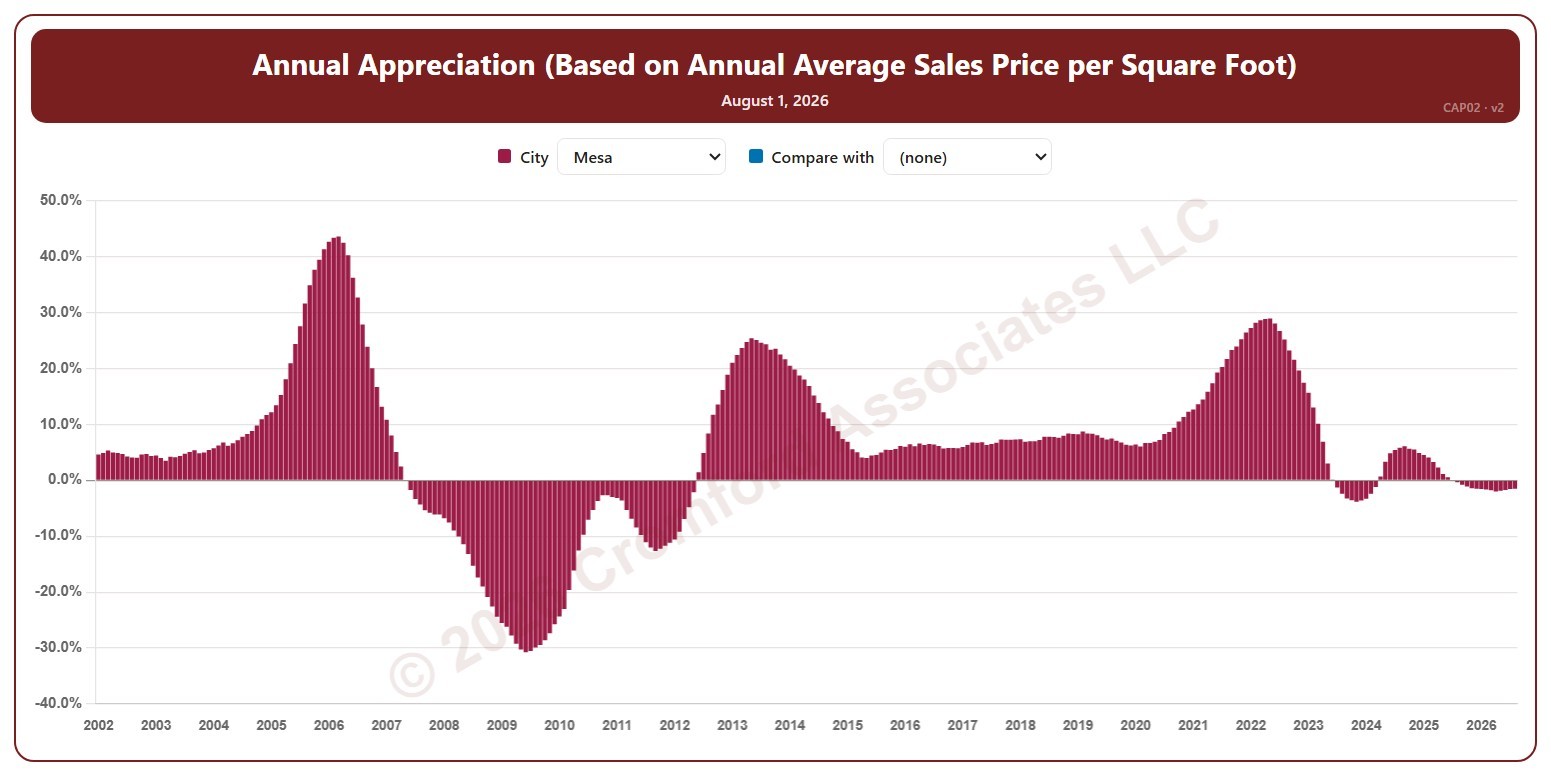
This chart shows annual appreciation for single-family detached homes in one city, as one bar per month since January 2002: the change in the average sales price per square foot over 12 months compared with the 12 months to the same point a year earlier. Each bar covers the 12 months ending with the month it sits at, so the bar labeled August covers September 1 of the year before to August 31. The newest bar is the last month that has finished. Above zero, prices are higher than a year ago; below zero, they are lower.

It opens on Mesa. Pick any of 41 cities from the City list, and use Compare with to add a second city alongside it.

Hover over a bar to see the exact figure for that month.

Annual Median Sales Price by City – Weekly

About this chart

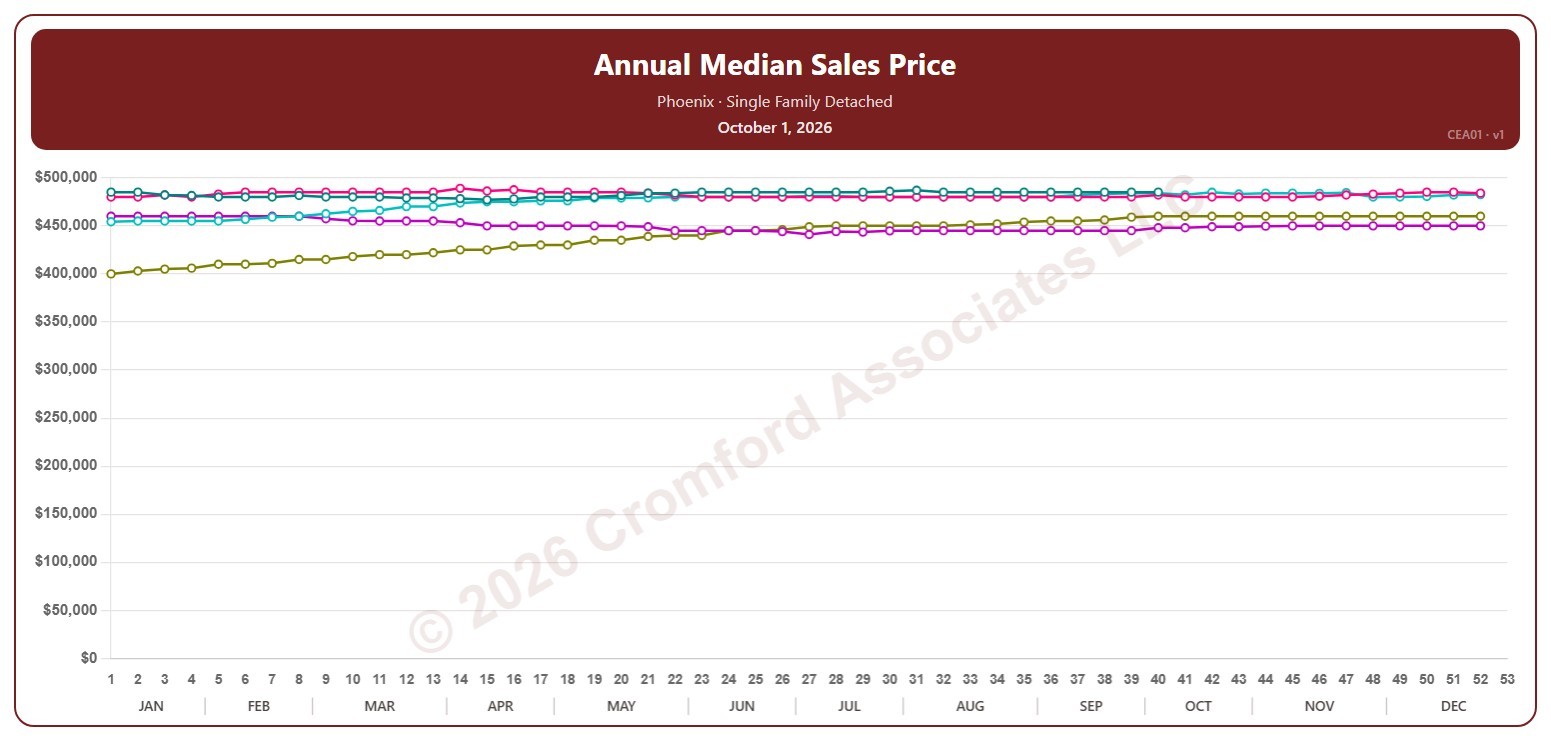
This chart shows the median sales price of single-family detached homes that closed through ARMLS in one city, measured every week on Thursdays. Each point covers the closings in the 12 months up to that week; the median is the price in the middle, so half sold for more and half for less.

Each year has its own line, laid out by week of the year, so you can compare this year with earlier years at the same point in the season. It opens on Phoenix and the last five years. Pick any of the 34 cities (18 major and 16 secondary) from the City list, and tick any year back to 2001 in the Year panel.

Hover over a line to see the exact figure for that week.

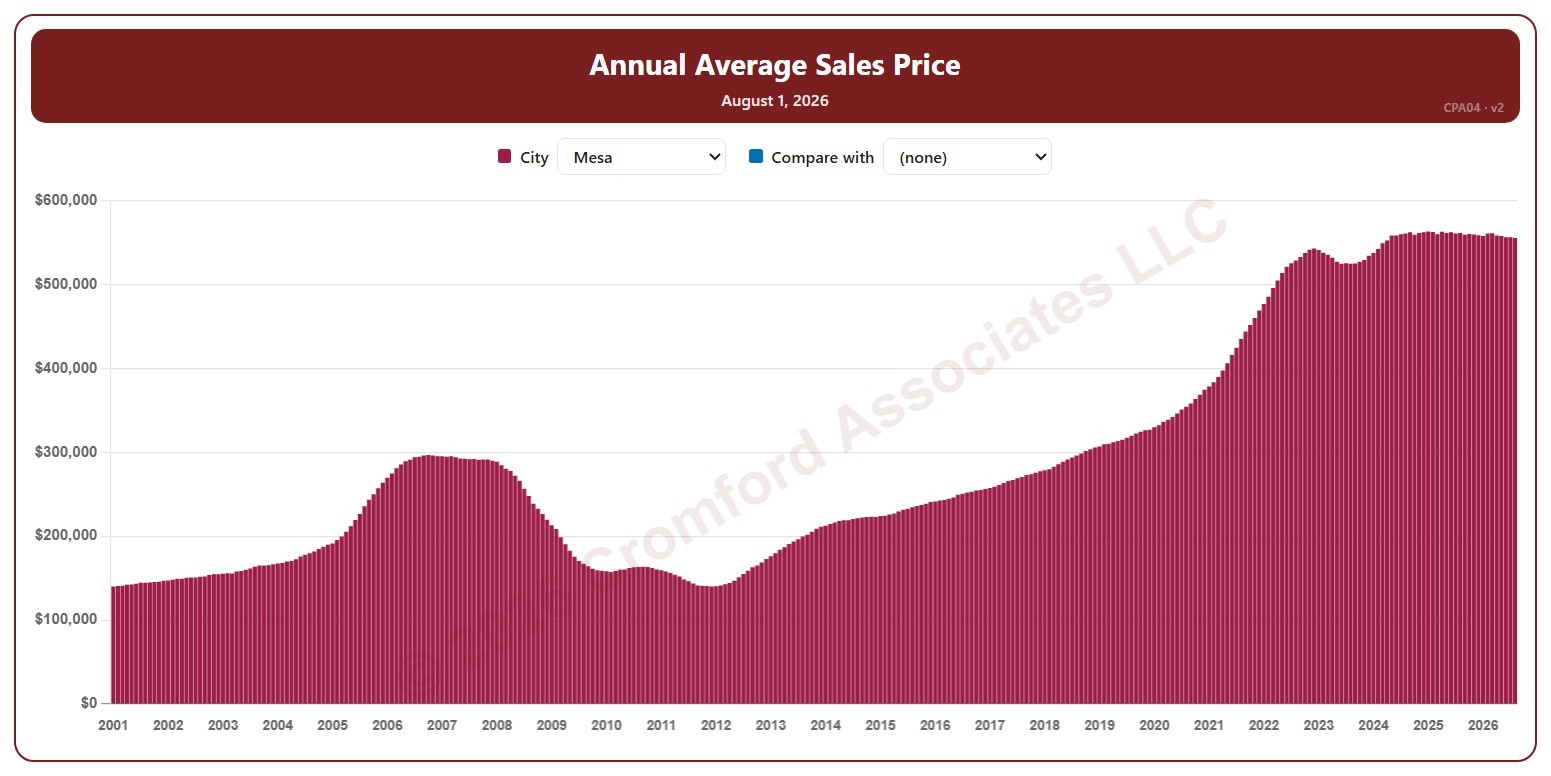
Annual Average Sales Price by City – Monthly

About this chart

This chart shows the average sales price of single-family detached homes that closed through ARMLS in one city over 12 months, as one bar per month since January 2001. Each bar covers the 12 months ending with the month it sits at, so the bar labeled August covers September 1 of the year before to August 31. The newest bar is the last month that has finished.

It opens on Mesa. Pick any of 41 cities from the City list, and use Compare with to add a second city alongside it.

Hover over a bar to see the exact figure for that month.

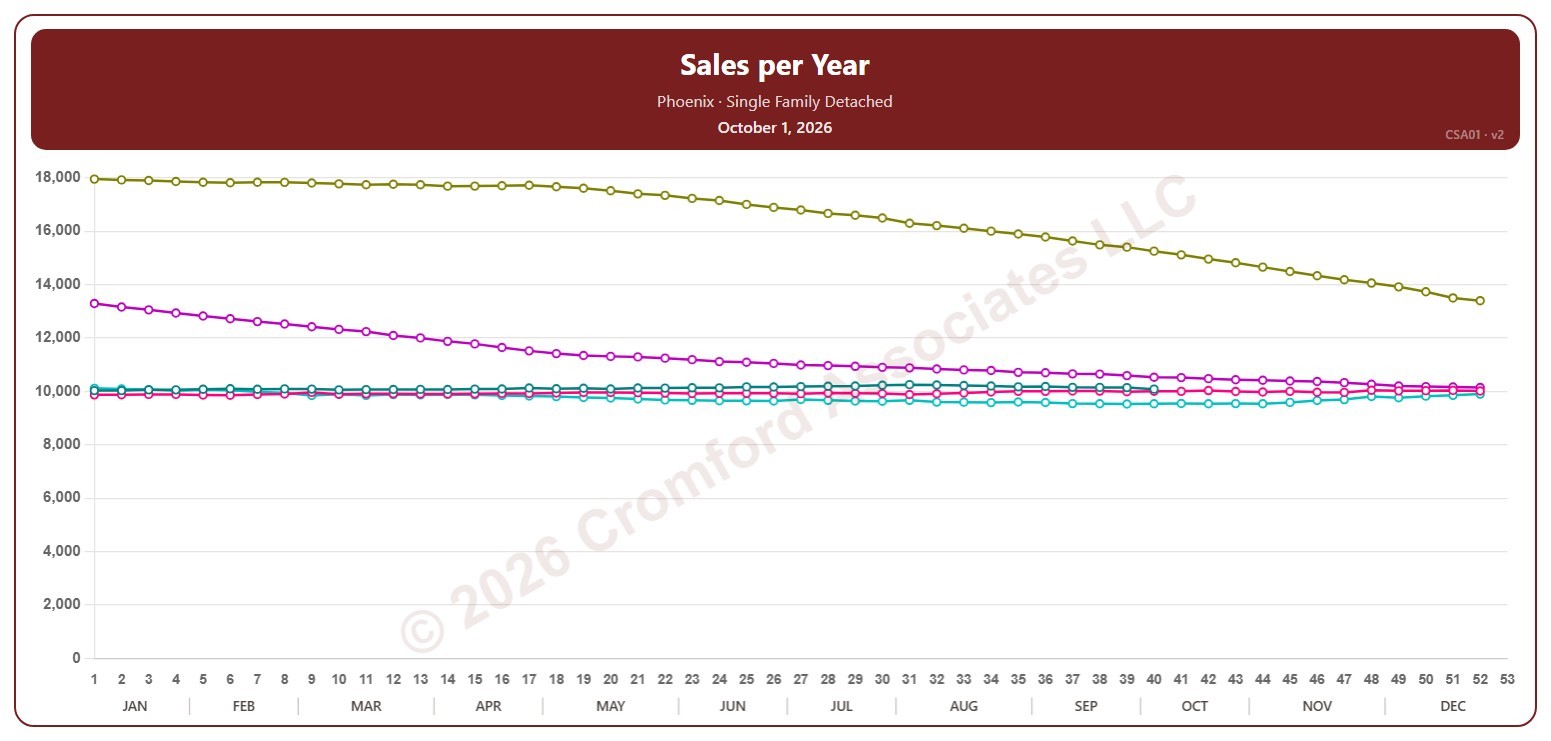
Sales per Year by City – Weekly

About this chart

This chart counts the single-family detached homes that closed through ARMLS in one city, measured every week on Thursdays. Each point is the number of closings in the 12 months up to that week, which smooths out the seasonal swings.

Each year has its own line, laid out by week of the year, so you can compare this year with earlier years at the same point in the season. It opens on Phoenix and the last five years. Pick any of the 34 cities (18 major and 16 secondary) from the City list, and tick any year back to 2001 in the Year panel.

Hover over a line to see the exact figure for that week.