About this chart
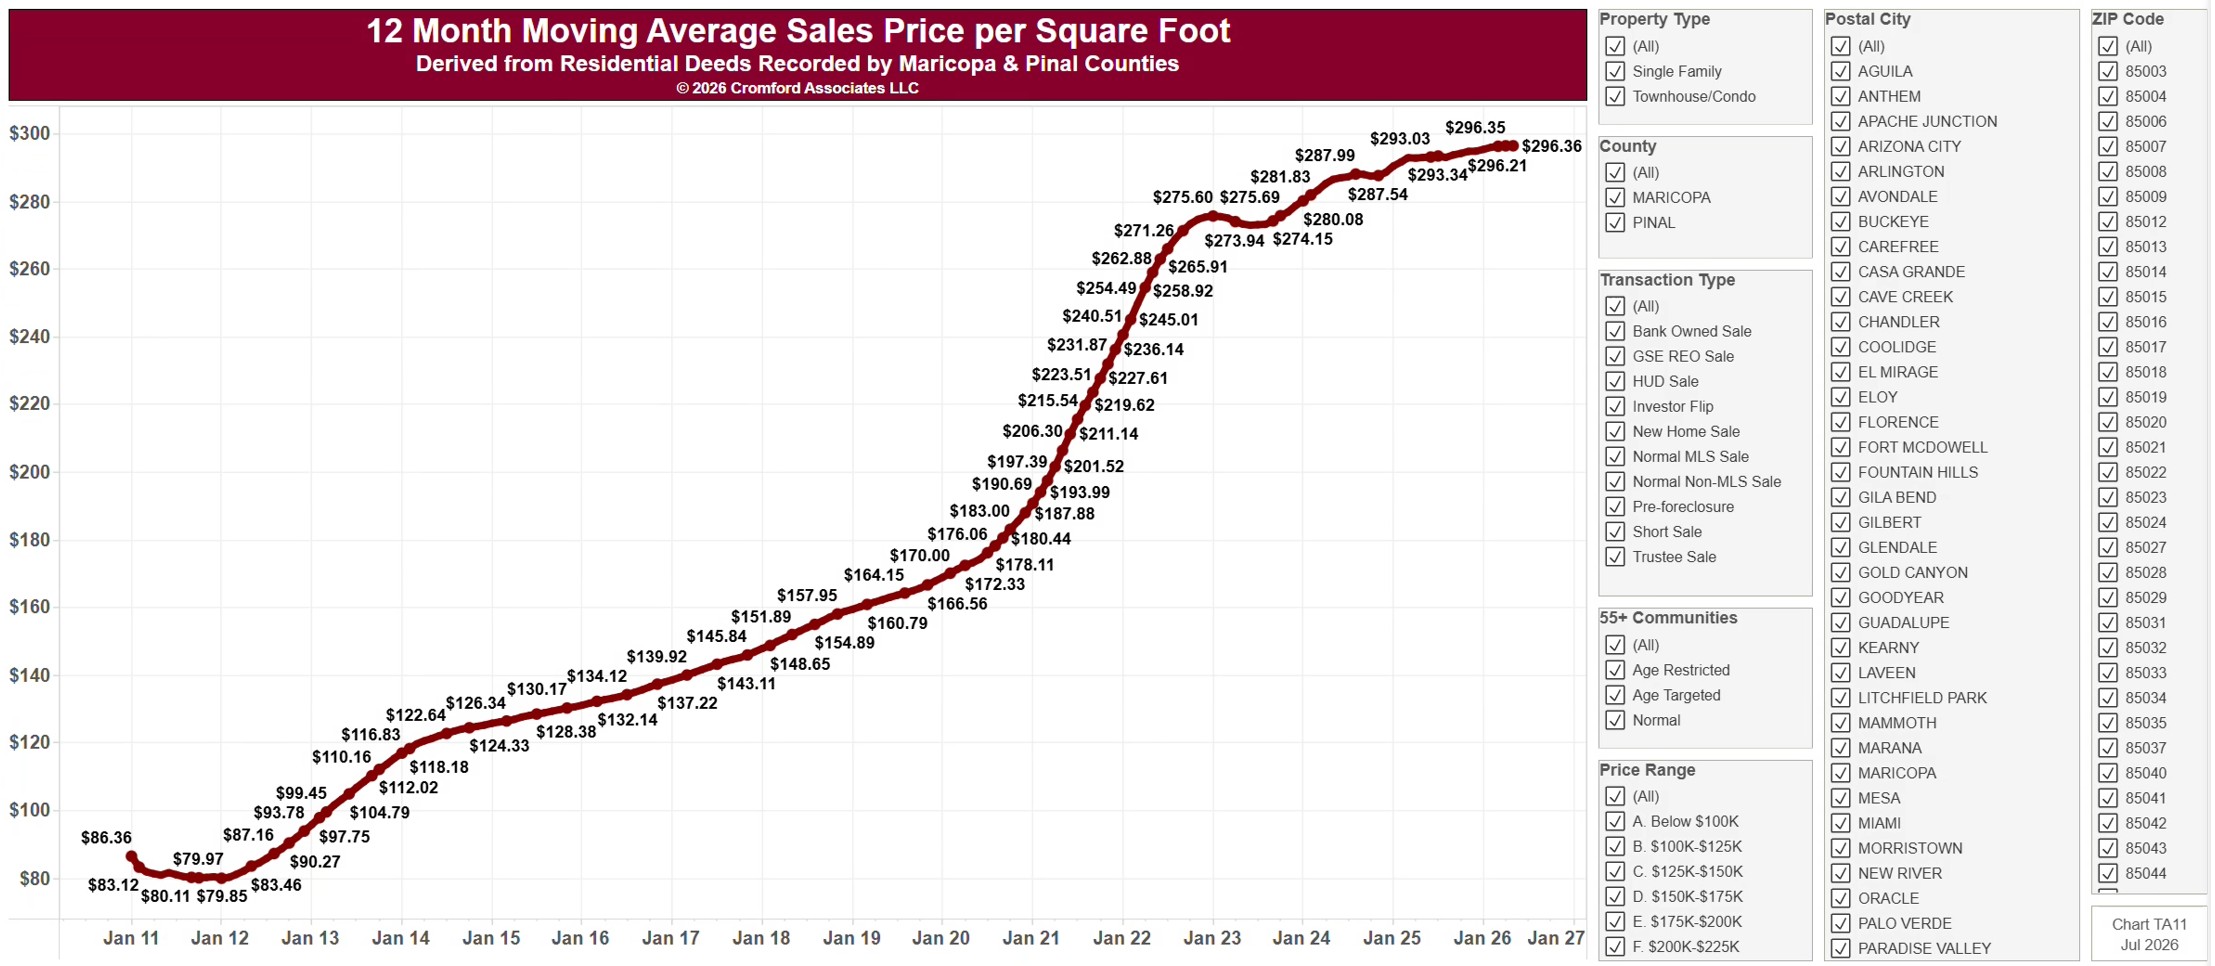
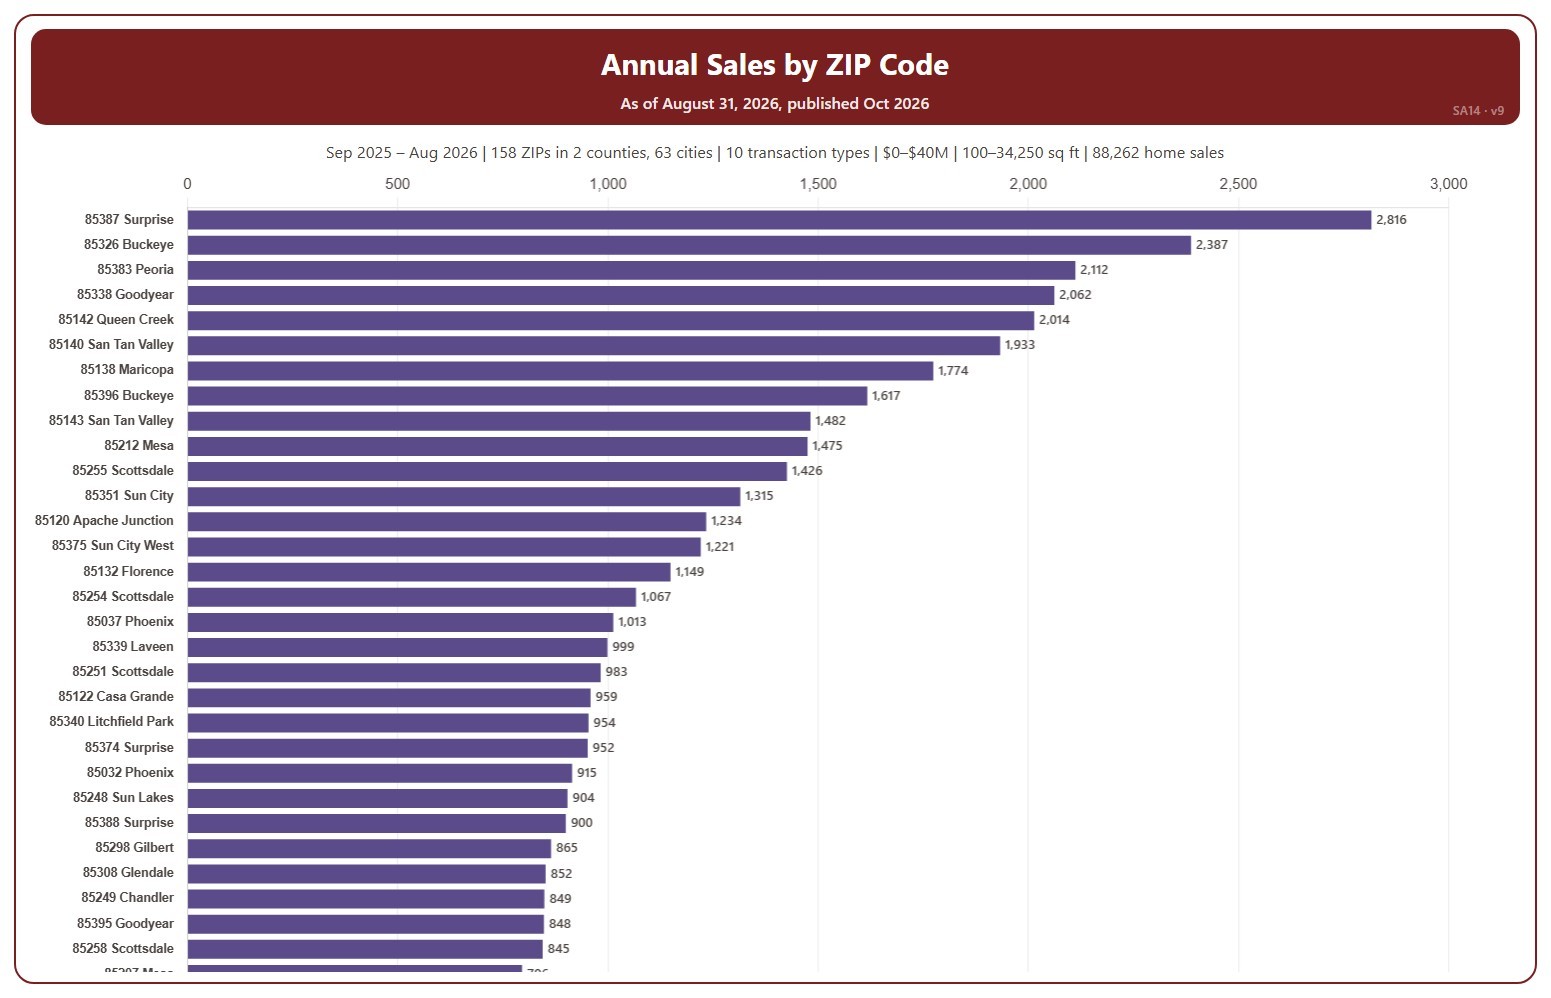
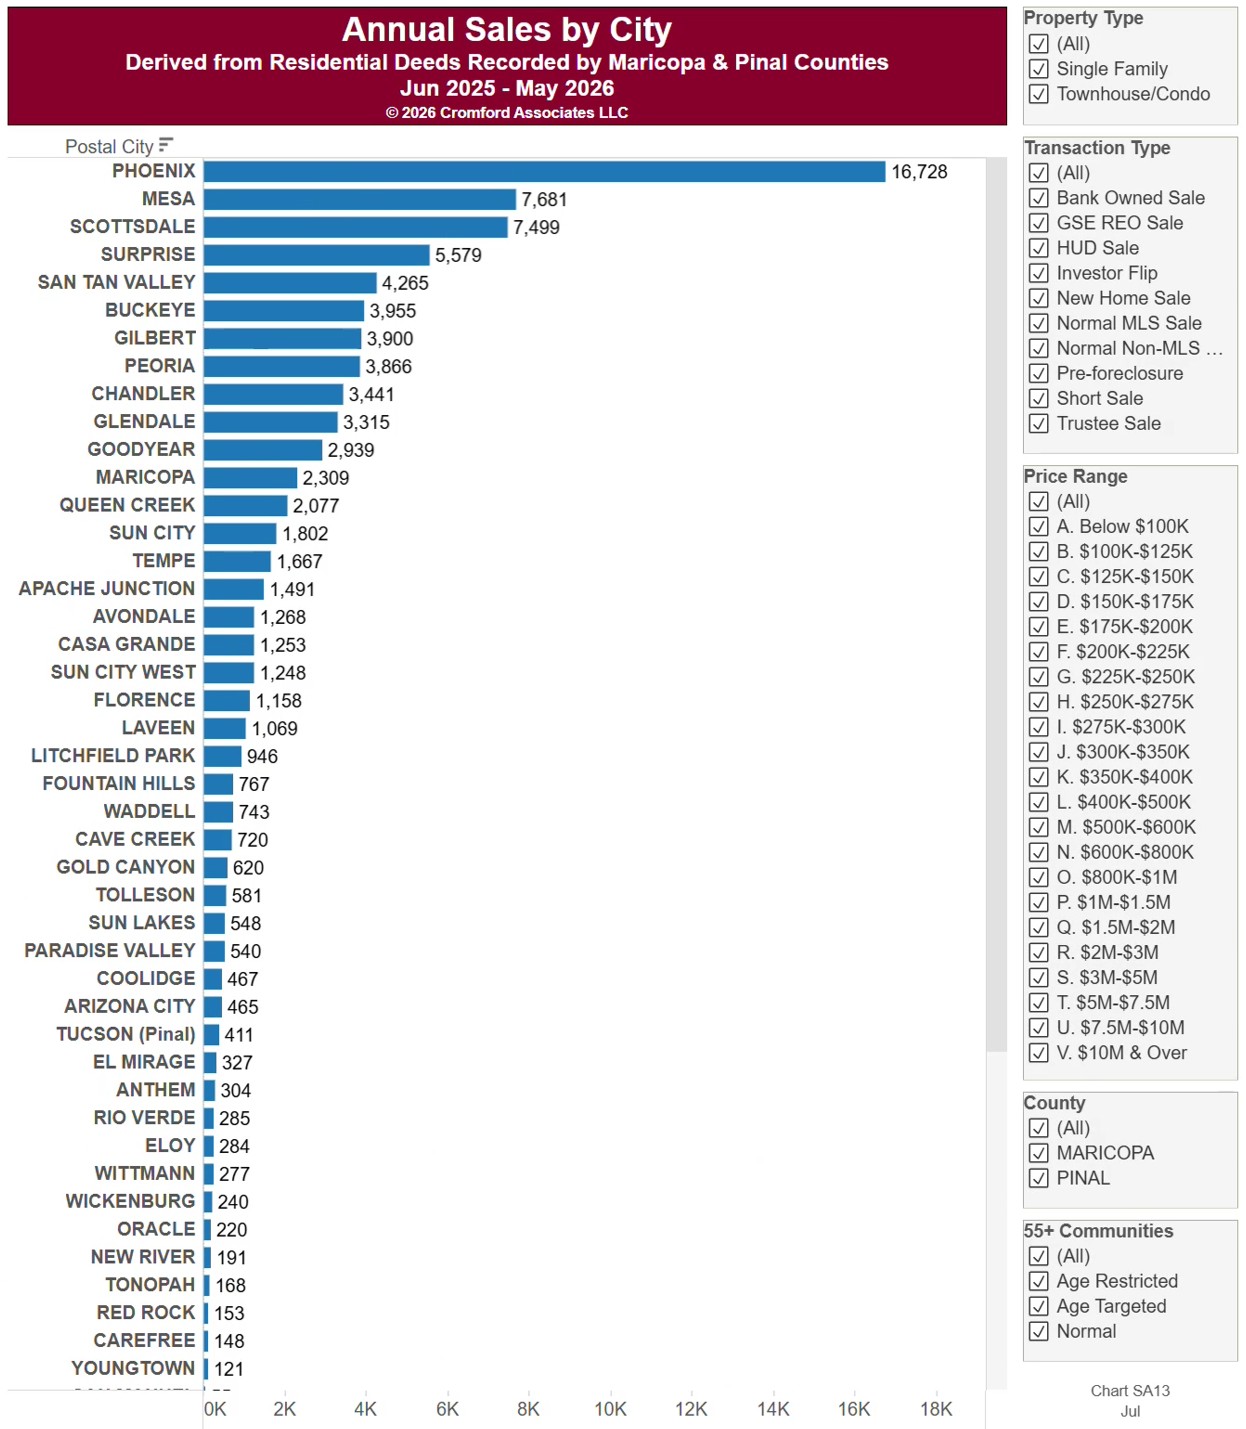
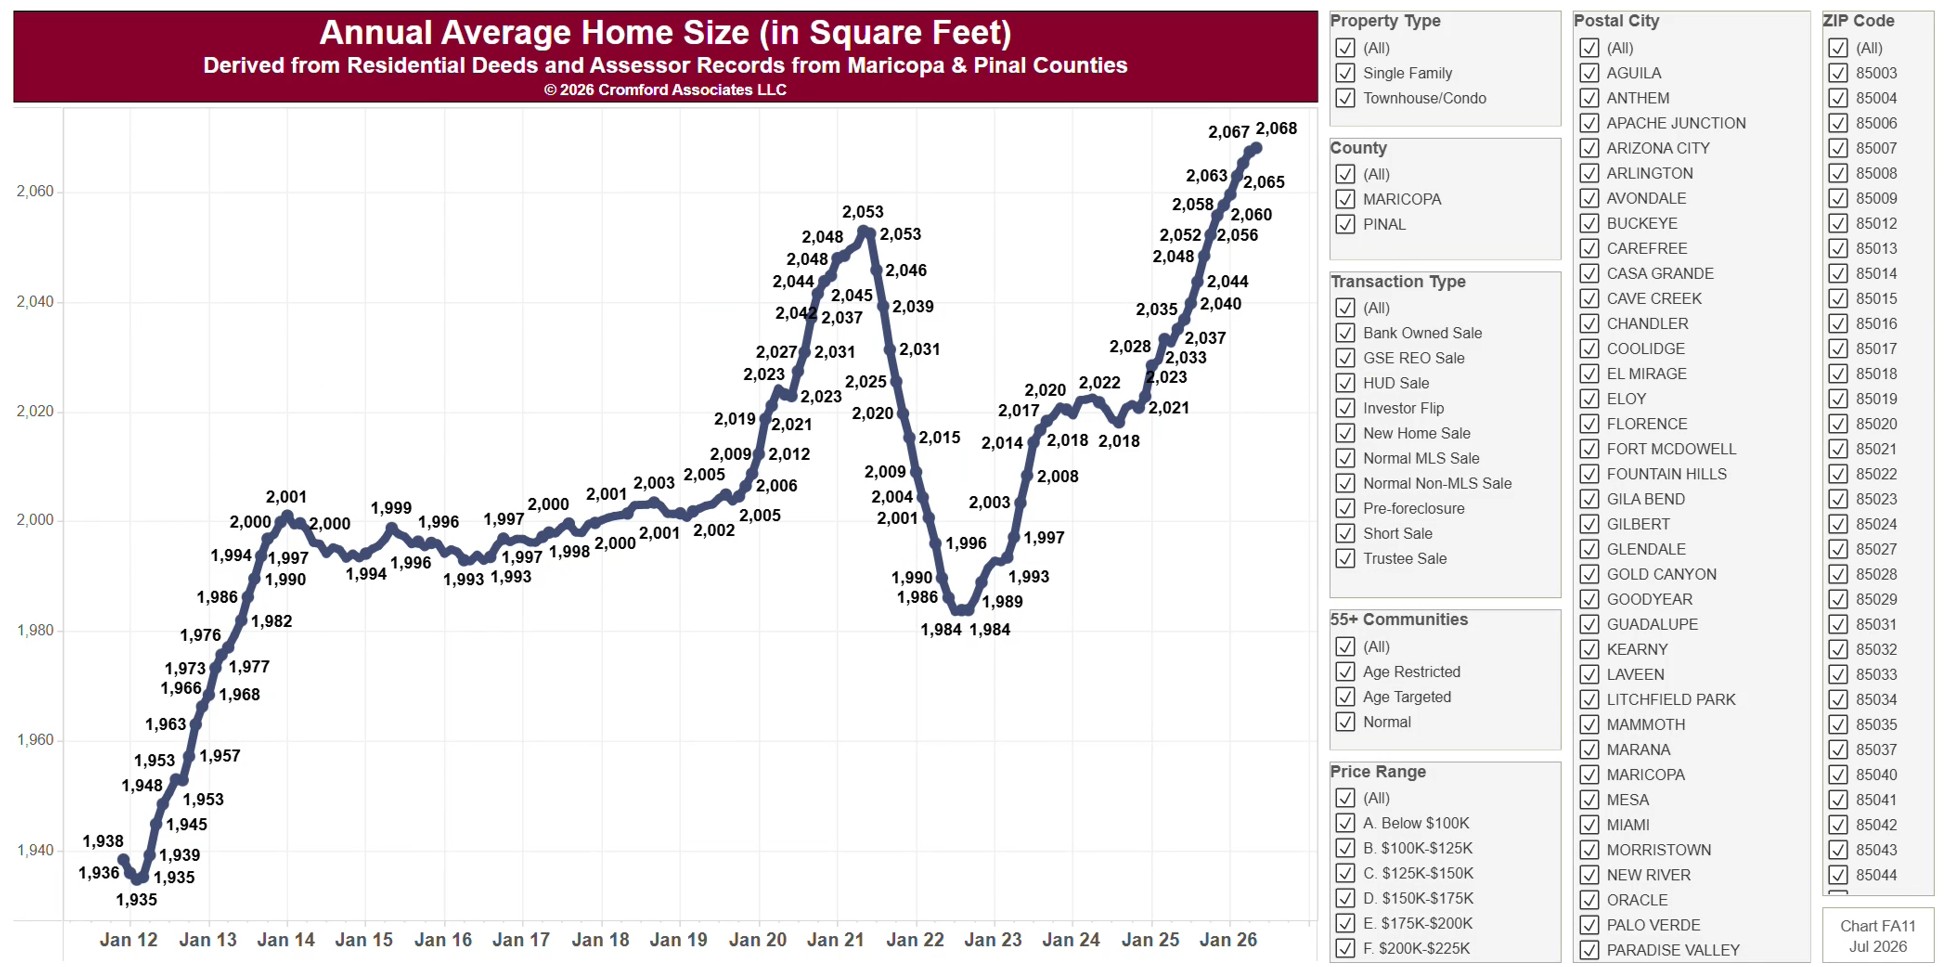
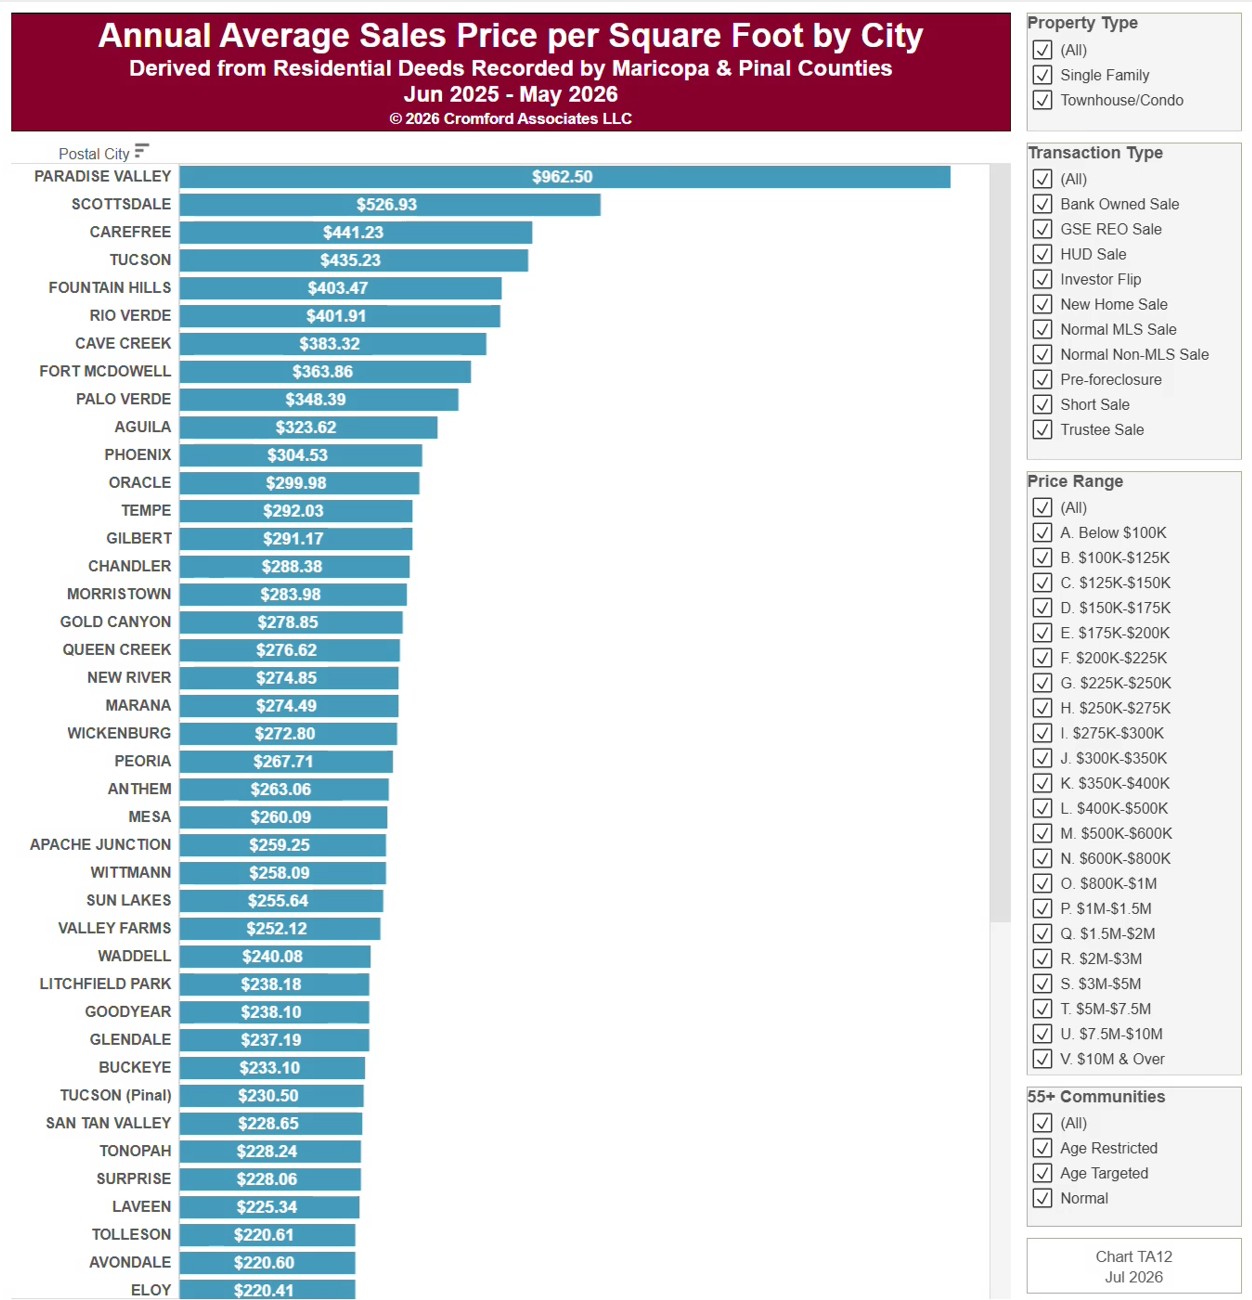
This chart ranks cities by the average price per square foot of the homes sold, from residential deeds recorded by Maricopa and Pinal Counties. Price per square foot lets you compare homes of different sizes. Because it is built from recorded deeds, it covers every recorded sale, not just homes listed on ARMLS: new homes, private sales, and investor deals are all included.
It opens on the last 12 months of records; use the Recording Month slider to choose the months covered. The list scrolls.
It opens on Maricopa and Pinal Counties with everything included. Narrow it with the County and City panels, the Transaction Type, Property Type, and 55+ Communities boxes, and the sale price and home size sliders.
Hover over a bar to see the exact figure for that city.