About this chart
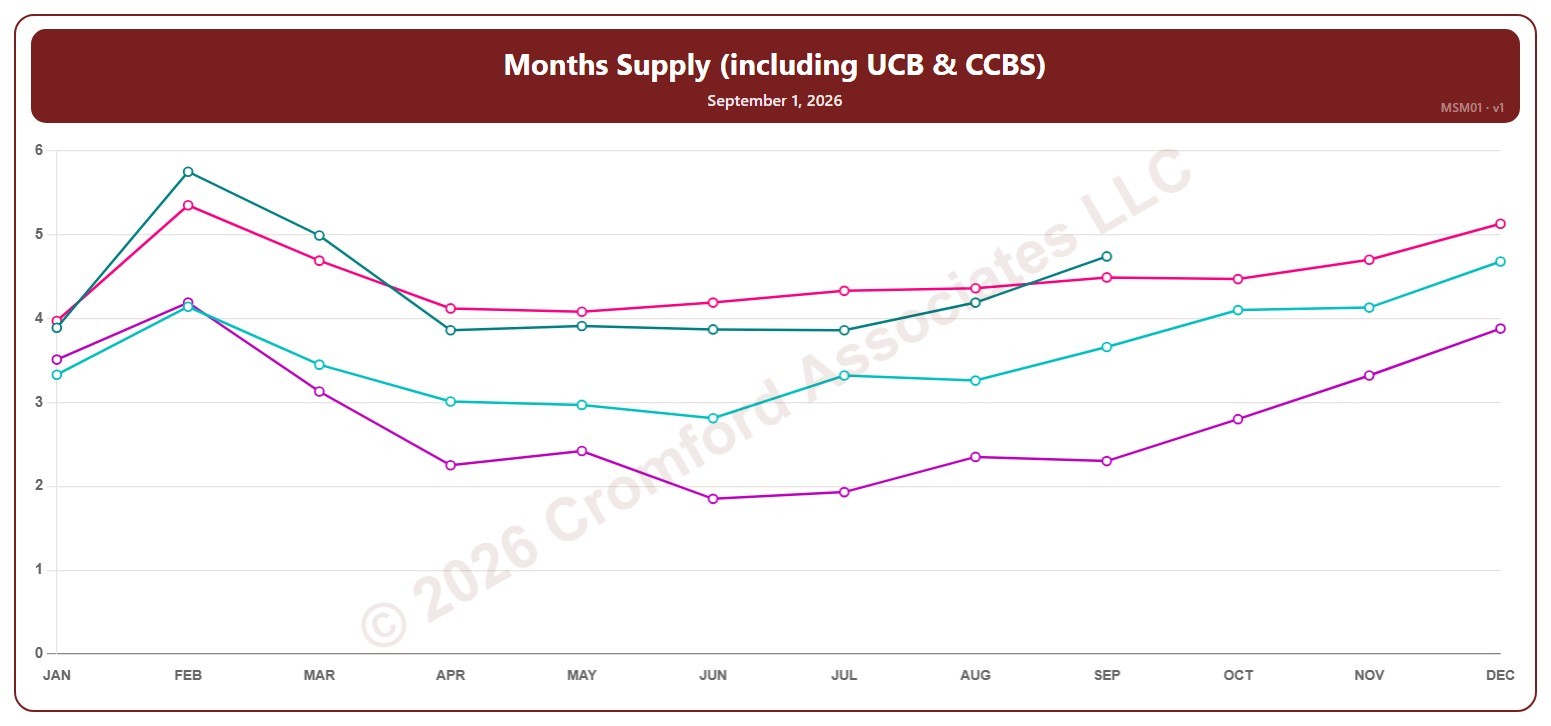
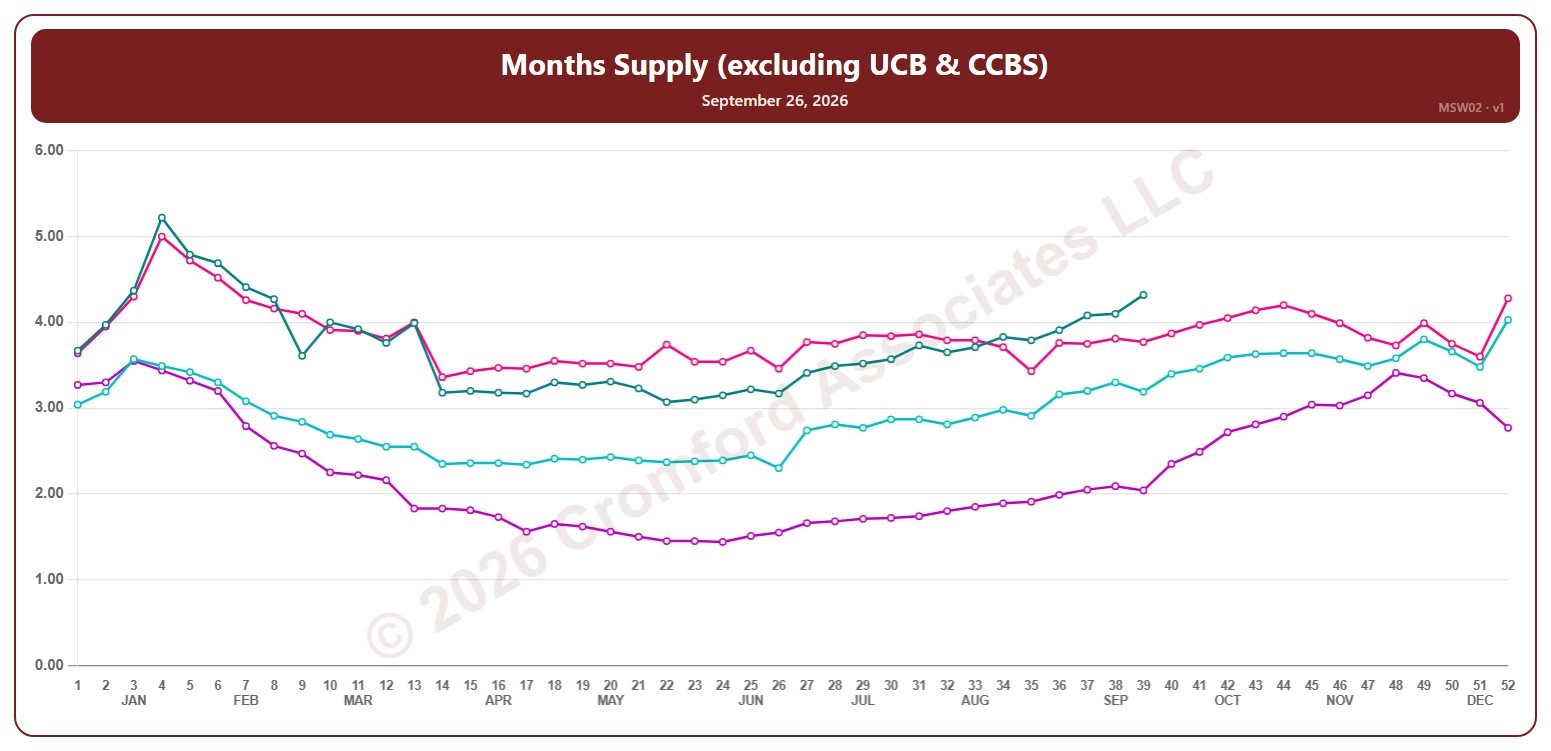
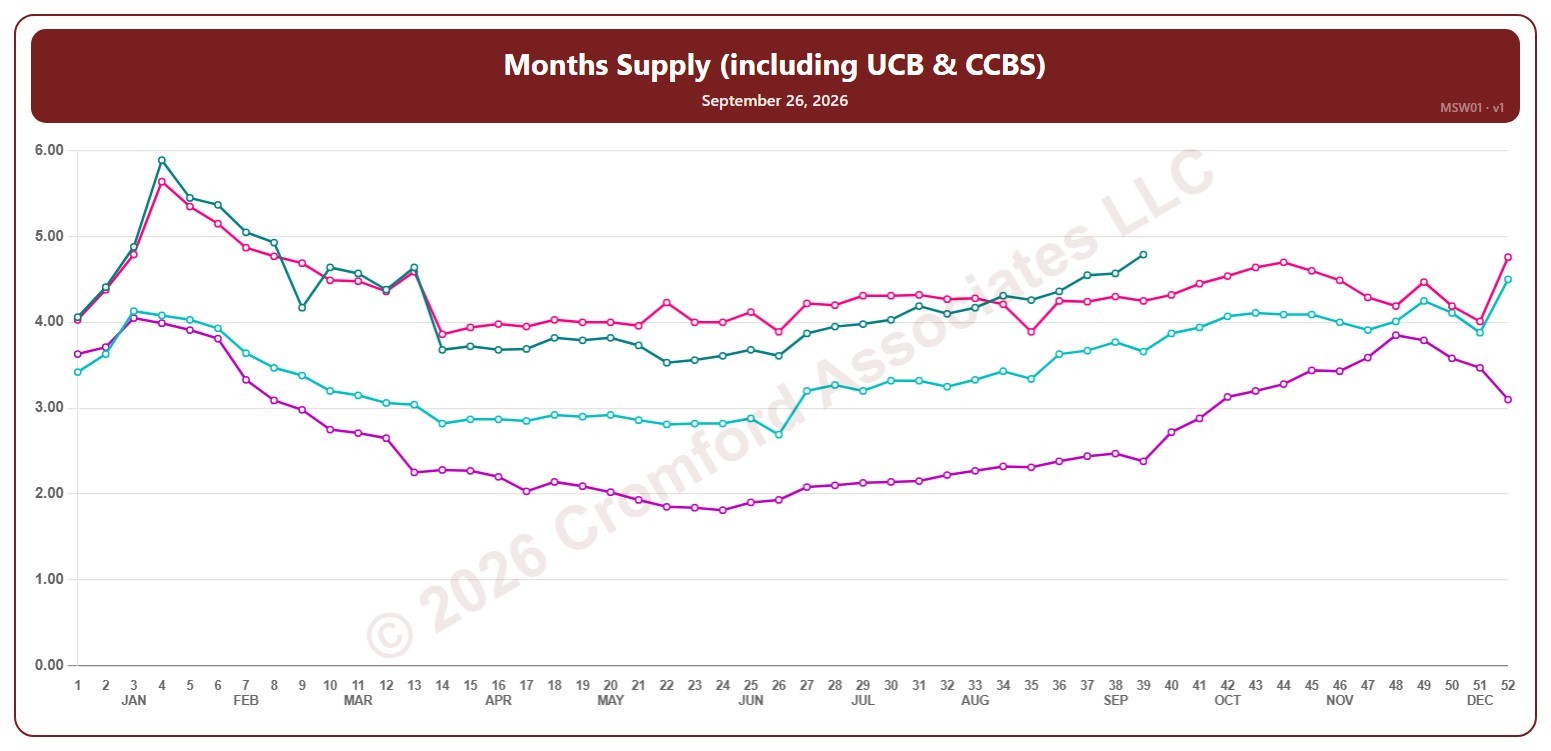
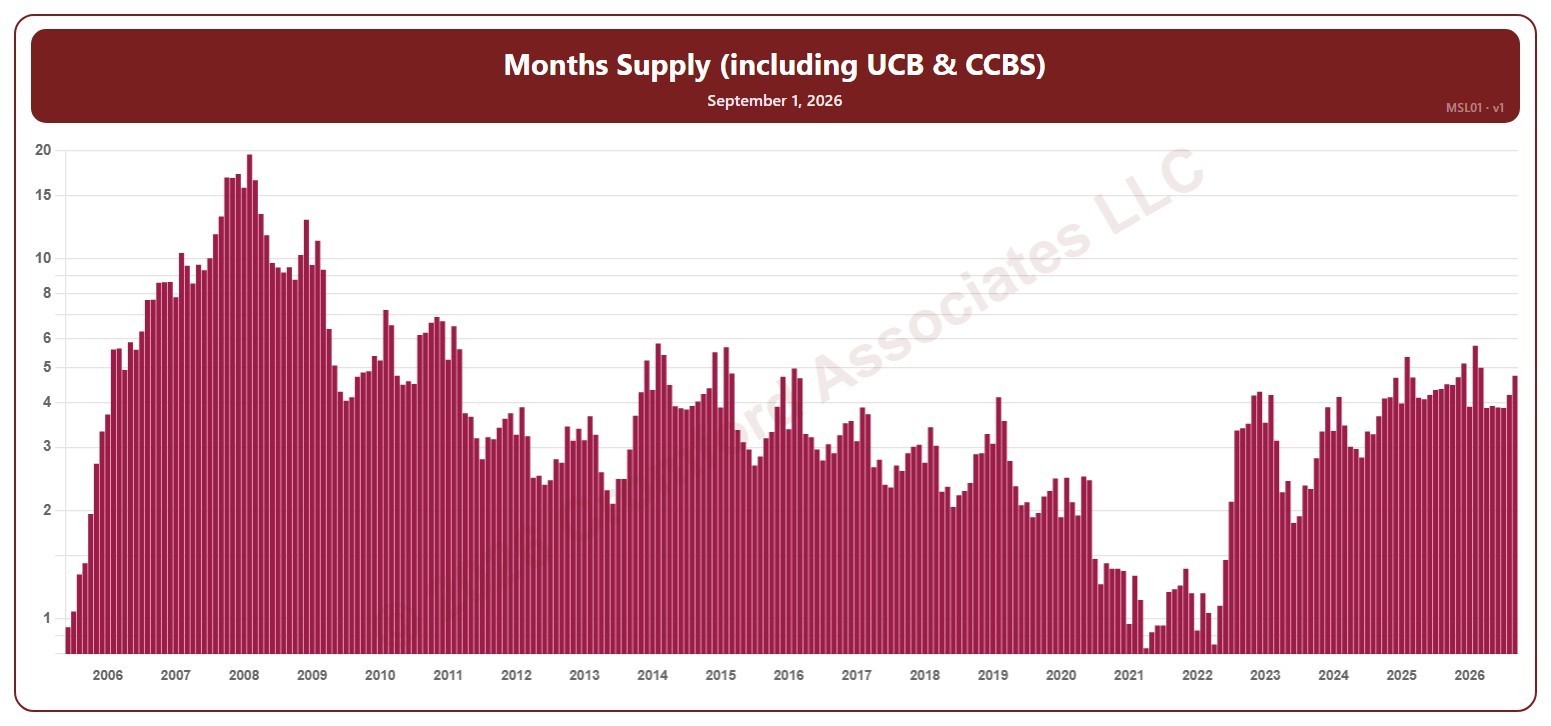
This chart shows months of supply, for the whole ARMLS market, all areas and all dwelling types, as one bar per month since June 2005, each the reading on the 1st of the month: how many months it would take to sell all the active listings (including UCB / CCBS) at the rate homes sold over the last month, if no new listings came on. The lower the number, the tighter the supply and the better for sellers. The value axis is logarithmic, so equal steps up the axis are equal percentage changes; this keeps both the extreme years and today readable.
Hover over a bar to see the exact figure for that month.