Extreme Statistics

About this chart

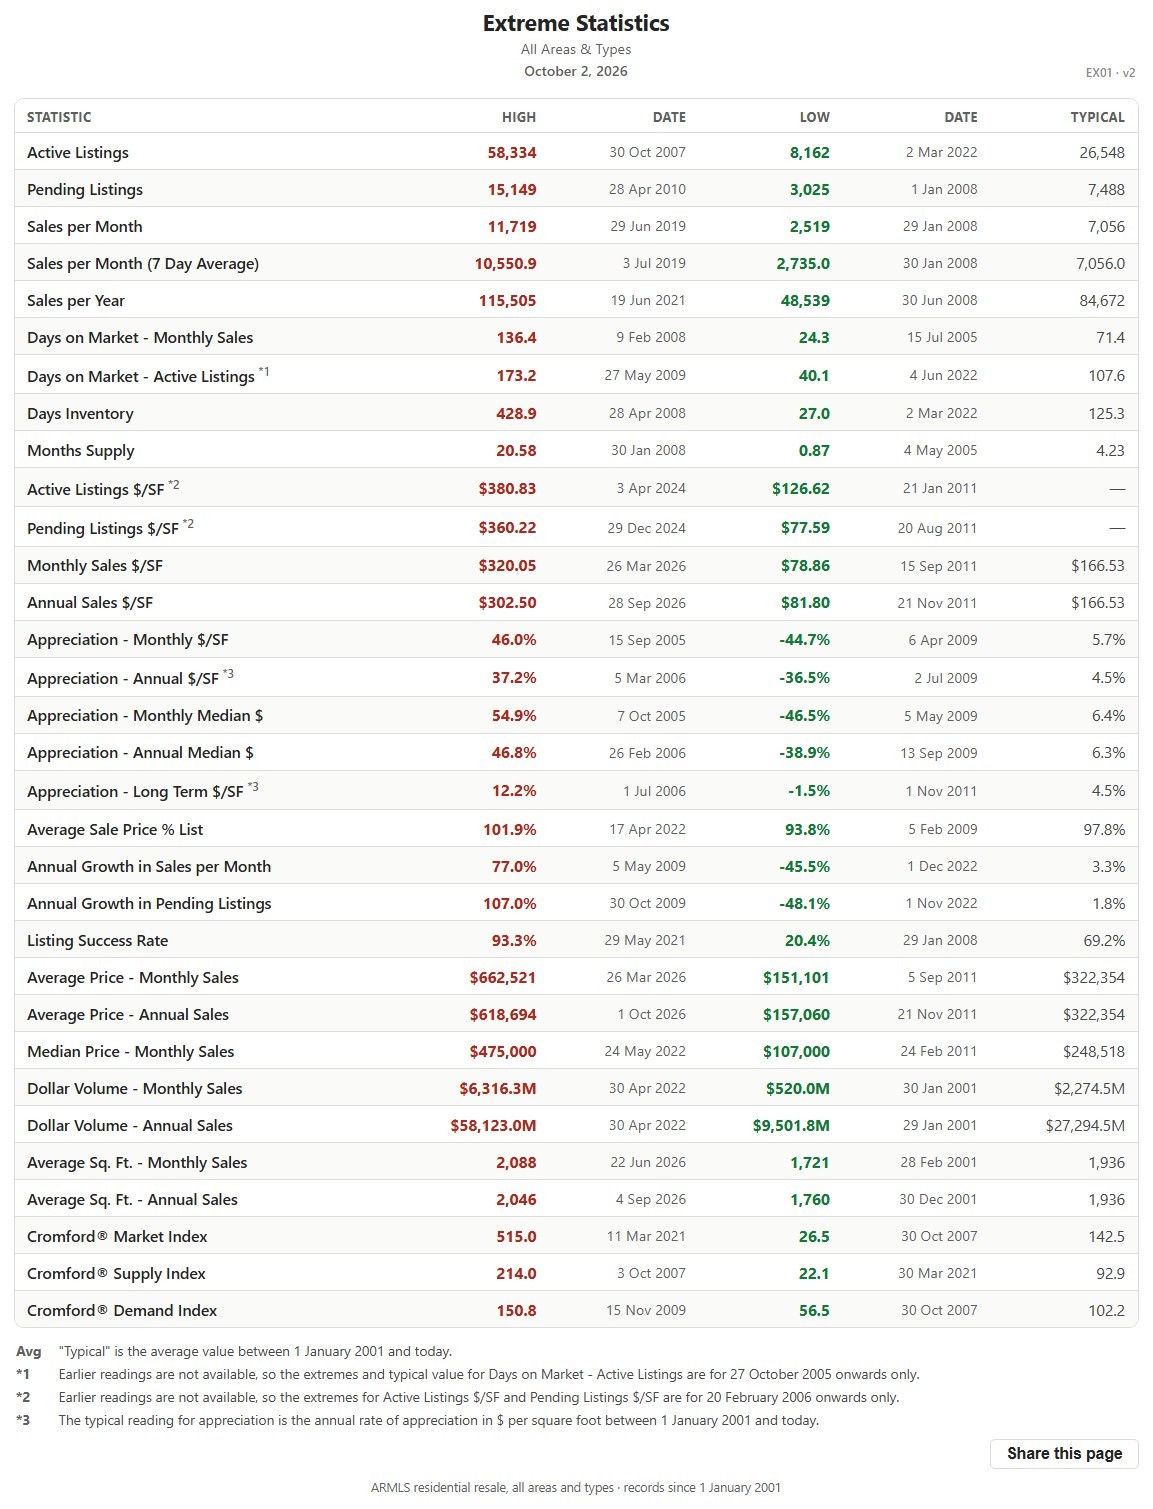
This table lists the record high and record low of more than 30 market measures for the whole ARMLS market, all areas and all dwelling types, each with the date it happened, since January 1, 2001, together with a typical value for comparison.

It shows how extreme past markets have been and what a typical reading looks like, a yardstick for the current figures on the other charts. The numbered notes under the table explain the few measures that are counted differently.
Price Range Market Snapshot

About this chart

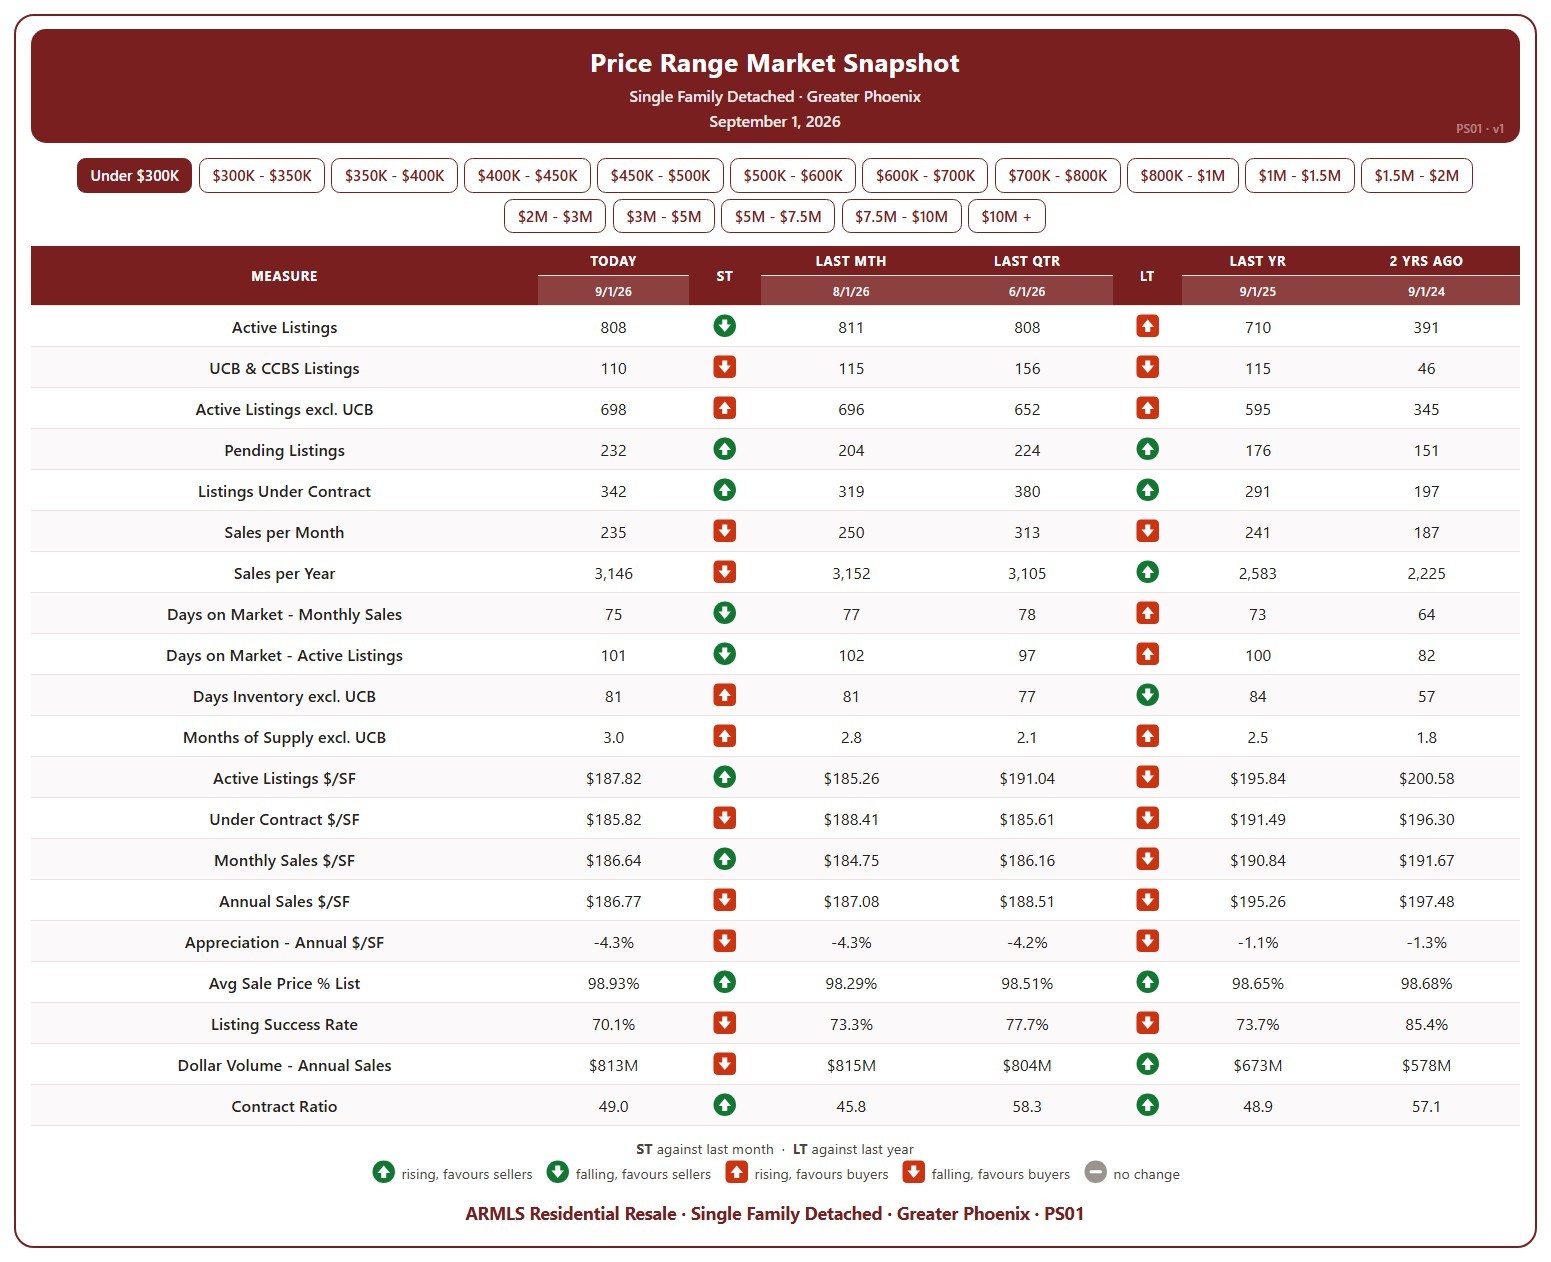
This table shows 20 measures of the market for single-family detached homes in Greater Phoenix, for one list price band at a time, from under $300K up to $10M and over. Pick the band with the buttons at the top.

Each measure is shown today (the 1st of the month), a month ago, a quarter ago, a year ago, and two years ago, so you can see how that part of the market has moved. The ST and LT marks compare today with last month and with last year, colored by whether the change favors sellers or buyers.

It covers supply (active listings, UCB / CCBS, pending, days inventory, months of supply), demand (sales per month and per year, days on market, listing success rate, contract ratio), and pricing ($/SF of active, under contract, and sold homes, appreciation, sale price as a percentage of list, and dollar volume).

Cromford® Market Index – Last 6 Months

About this chart

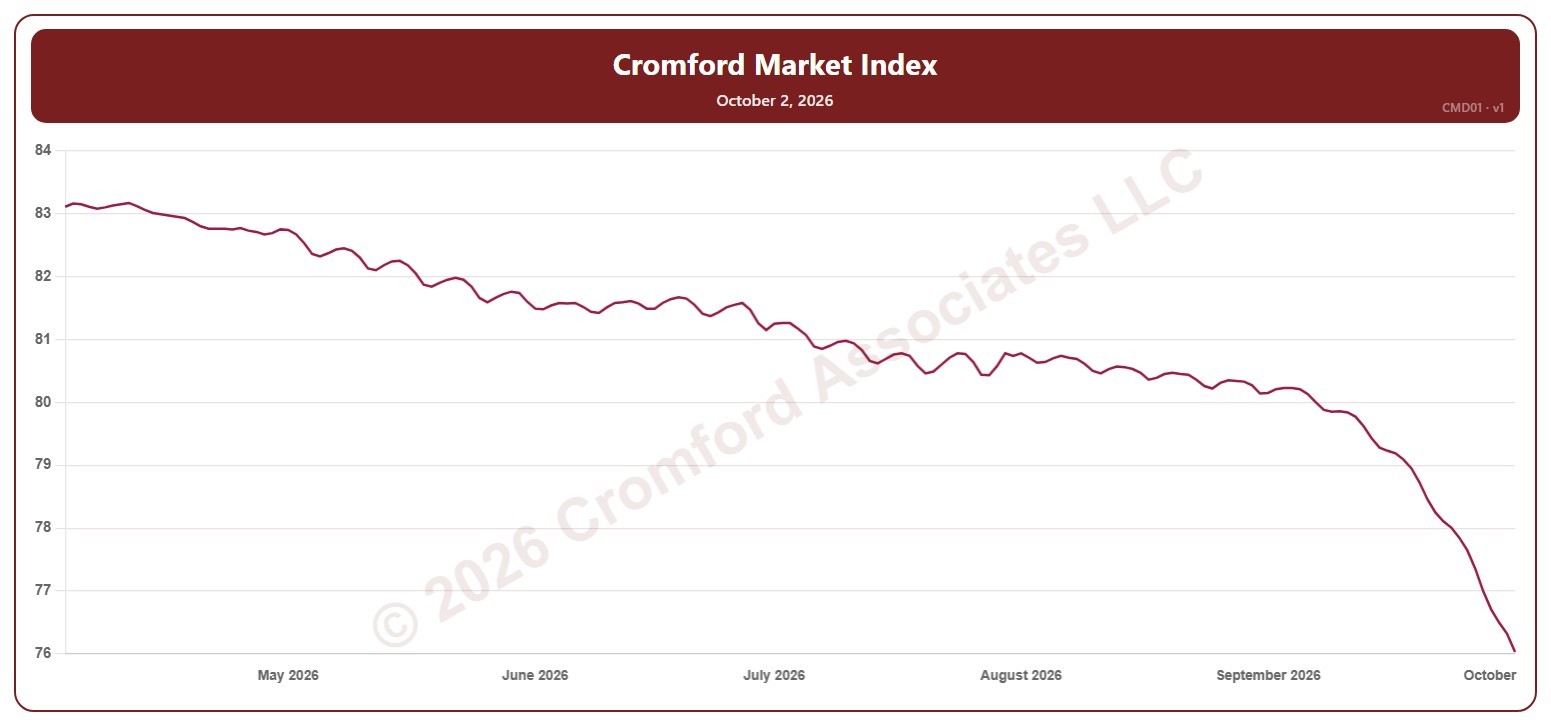
This chart shows the Cromford® Market Index for the whole ARMLS market, all areas and all dwelling types, every day over the last six months. A reading below 90 indicates a buyer’s market, above 110 a seller’s market, and between 90 and 110 a balanced market.

Hover over the line to see the exact figure for that day.

Cromford® Market Index by City – Gauges

About this chart

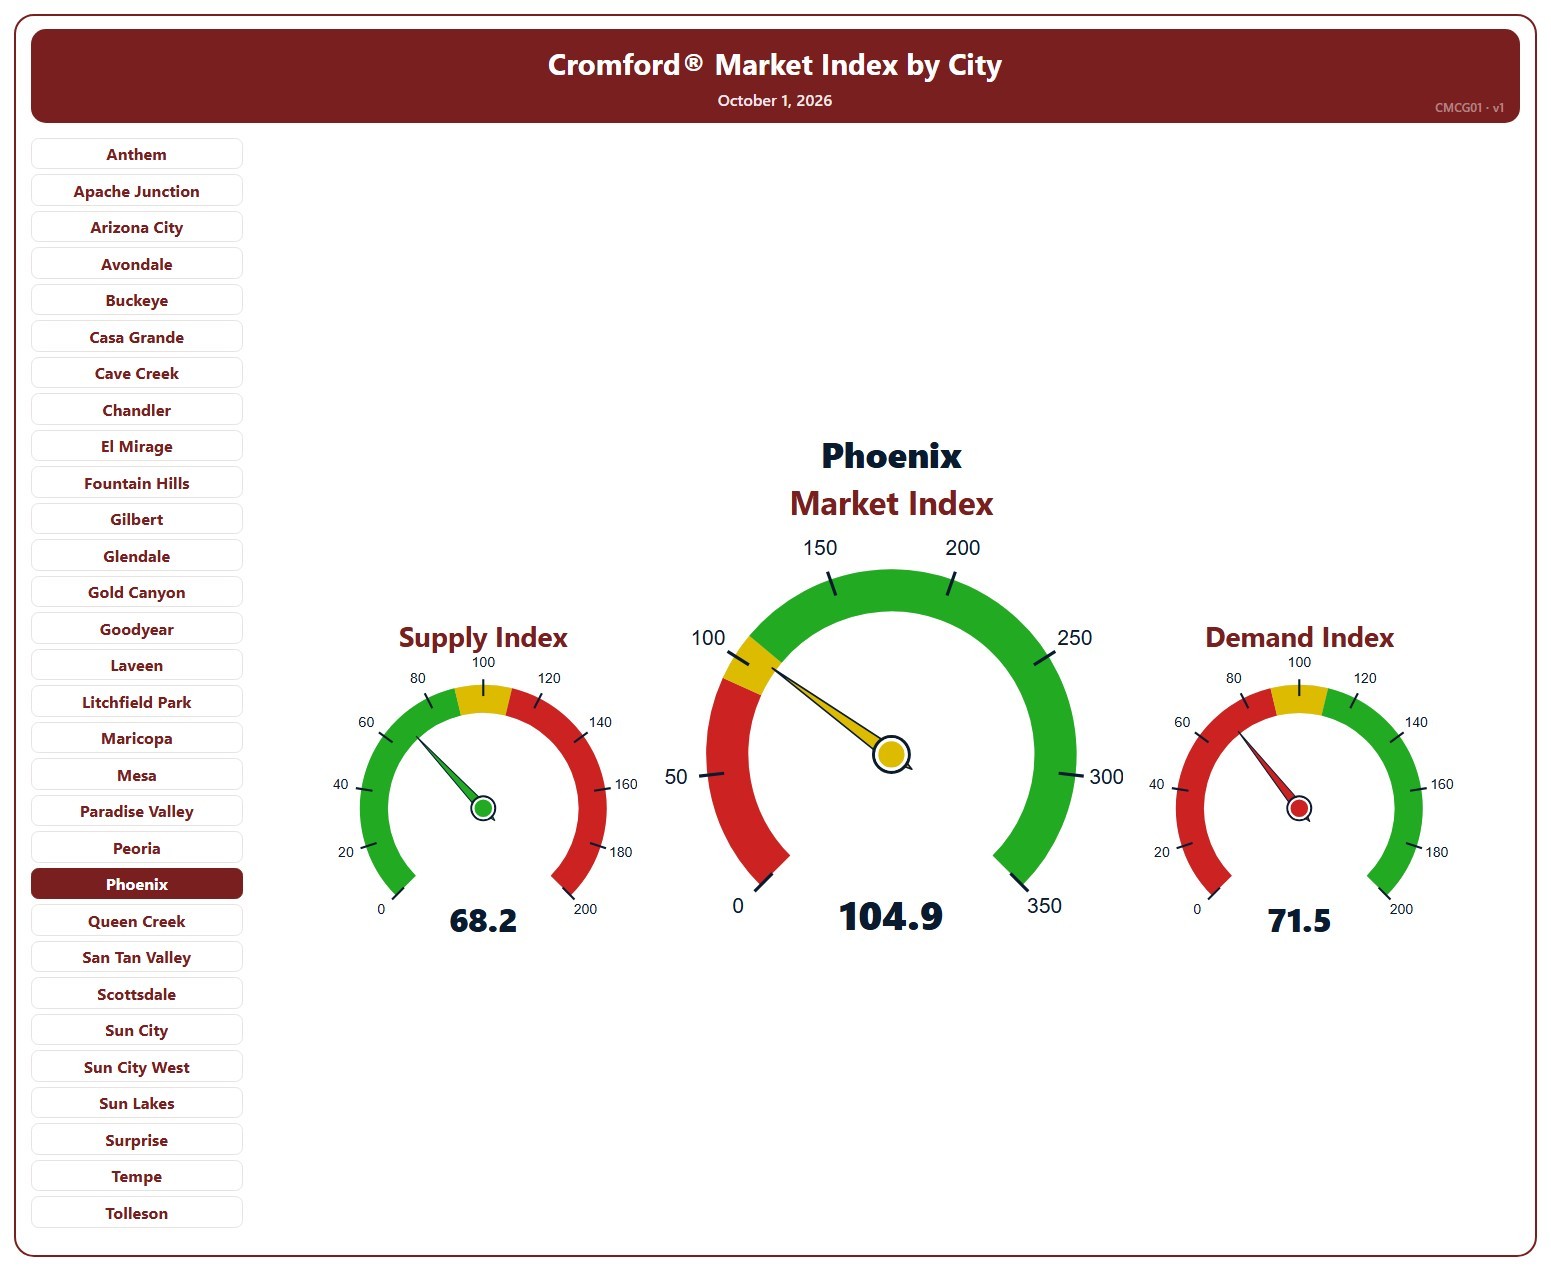
This page shows three gauges for one city: the Cromford® Supply Index, Market Index, and Demand Index at their latest reading, for single-family detached resale homes on ARMLS. It opens on Phoenix; pick any of the 34 cities from the list.

Each dial has three bands, below 90, 90 to 110, and above 110, and the needle takes the color of the band it points into. On the Market and Demand dials green is above 110 and red below 90; on the Supply dial the colors are reversed, because low supply favors sellers.

A Market Index below 90 indicates a buyer’s market, above 110 a seller’s market, and between 90 and 110 a balanced market.

Active Listings (including UCB & CCBS) – Long Term

About this chart

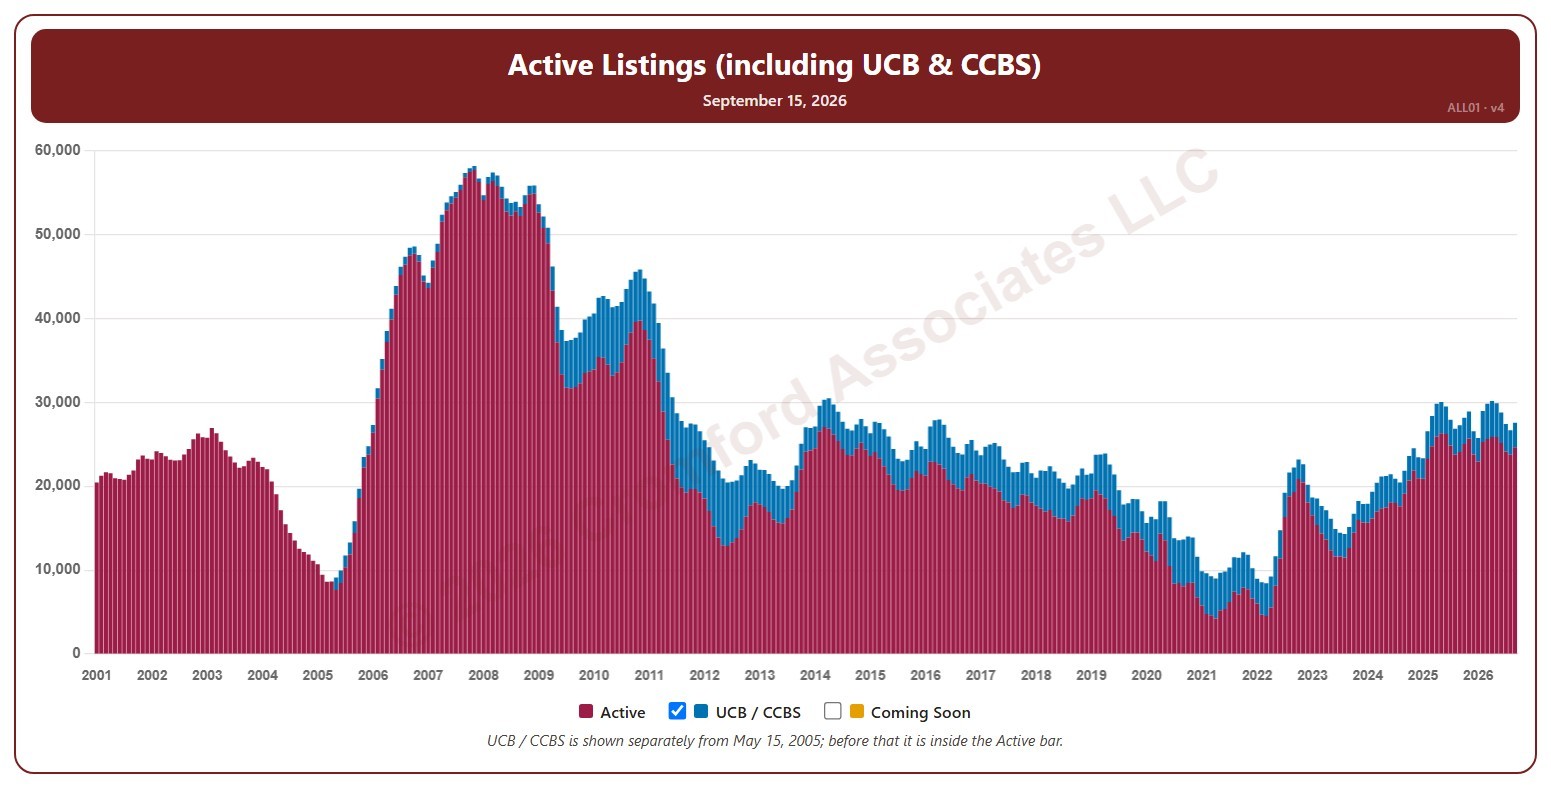
This chart shows the number of active listings, for the whole ARMLS market, all areas and all dwelling types, as one bar per month since January 2001. Each bar is the reading on the 15th of the month, stacked to show Active listings and UCB / CCBS listings (under contract but still marked active). Rising inventory gives buyers more choice; falling inventory favors sellers.

Untick UCB / CCBS to show Active listings alone, or tick Coming Soon to add homes about to go active.

Hover over a bar to see the exact figure for that month.

Active Listings (excluding UCB & CCBS) – Long Term

About this chart

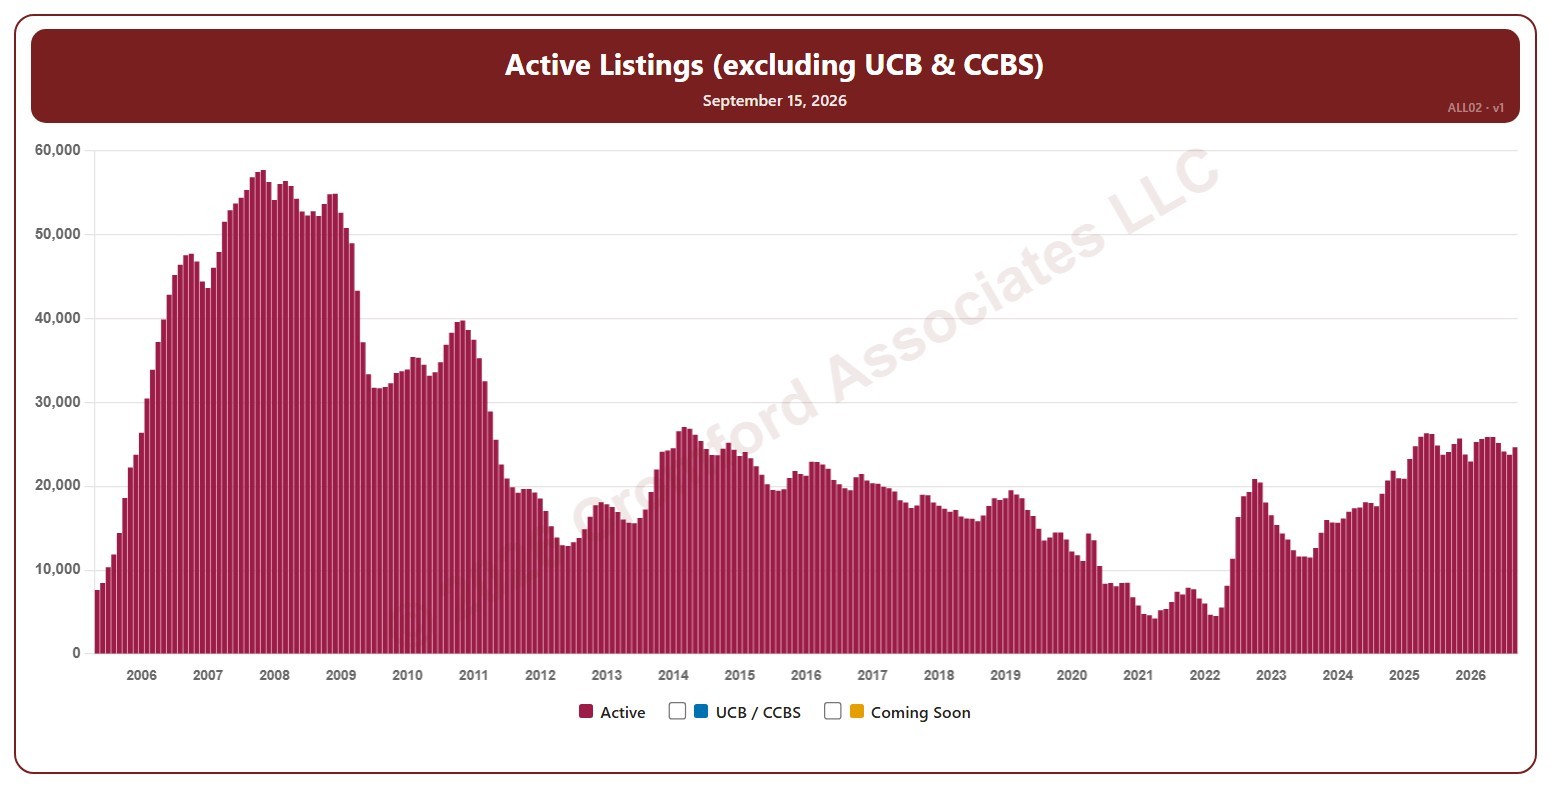
This chart shows the number of active listings, not counting UCB / CCBS listings (under contract but still marked active), for the whole ARMLS market, all areas and all dwelling types, as one bar per month since May 2005, when the two were first counted separately. Each bar is the reading on the 15th of the month. Rising inventory gives buyers more choice; falling inventory favors sellers.

Tick UCB / CCBS to stack those listings on top, or Coming Soon to add homes about to go active.

Hover over a bar to see the exact figure for that month.

Active Listings (including UCB & CCBS) – Monthly

About this chart

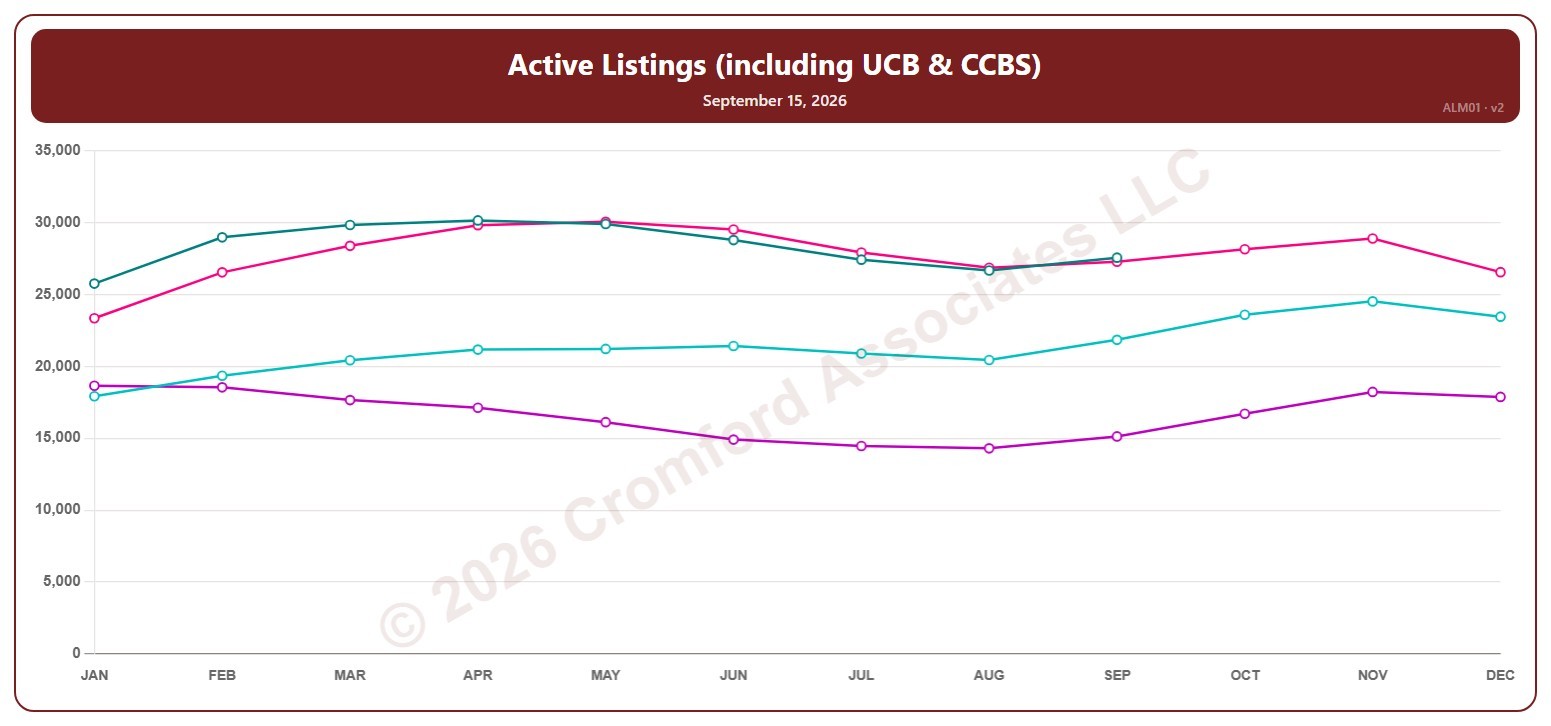
This chart shows the number of active listings, including UCB / CCBS listings (under contract but still marked active), for the whole ARMLS market, all areas and all dwelling types, read on the 15th of each month. Rising inventory gives buyers more choice; falling inventory favors sellers.

Each year has its own line, laid out by month, so you can compare this year with earlier years at the same point in the season. It opens on the last four years; tick any year back to 2001 in the Year panel.

Hover over a line to see the exact figure for that month.

Active Listings (including UCB & CCBS) – Weekly

About this chart

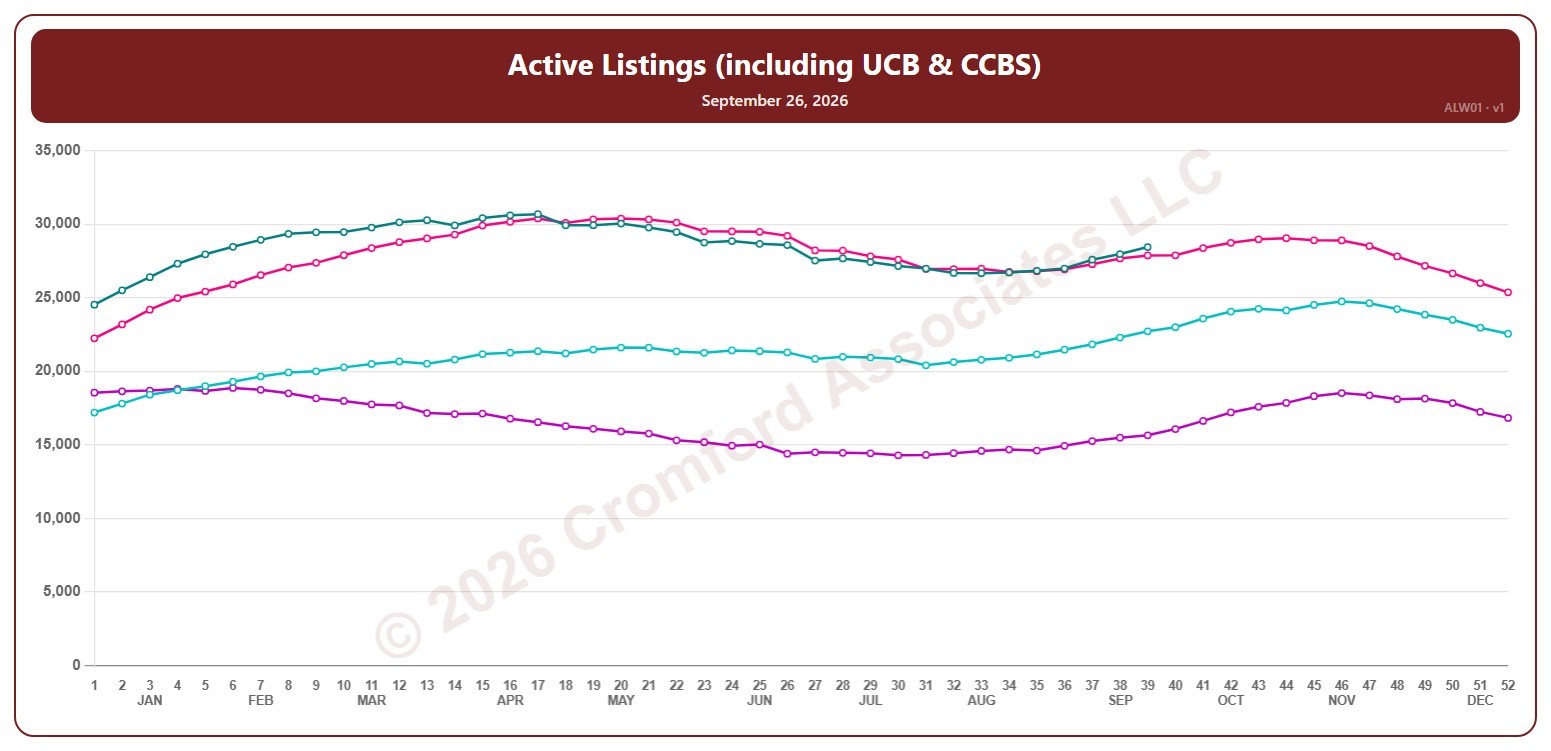
This chart shows the number of active listings, including UCB / CCBS listings (under contract but still marked active), for the whole ARMLS market, all areas and all dwelling types, counted every Saturday. Rising inventory gives buyers more choice; falling inventory favors sellers.

Each year has its own line, laid out by week of the year (each Saturday), so you can compare this year with earlier years at the same point in the season. It opens on the last four years; tick any year back to 2001 in the Year panel.

Hover over a line to see the exact figure for that week.

Active Listings (excluding UCB & CCBS) – Weekly

About this chart

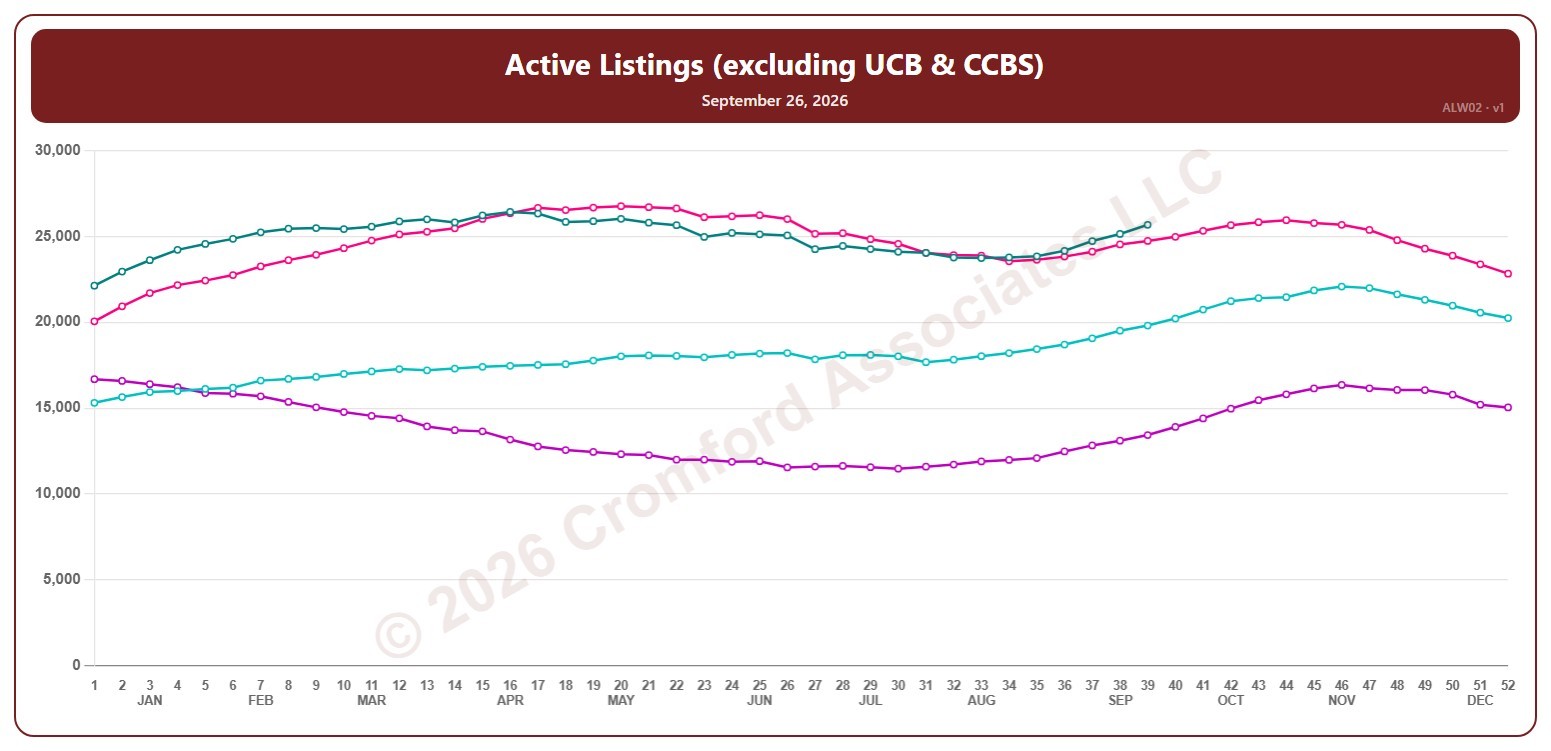
This chart shows the number of active listings, not counting UCB / CCBS listings (under contract but still marked active), for the whole ARMLS market, all areas and all dwelling types, counted every Saturday. Rising inventory gives buyers more choice; falling inventory favors sellers.

Each year has its own line, laid out by week of the year (each Saturday), so you can compare this year with earlier years at the same point in the season. It opens on the last four years; tick any year back to 2005 in the Year panel.

Hover over a line to see the exact figure for that week.

Annual Appreciation (Based on Monthly $/SF) – Long Term

About this chart

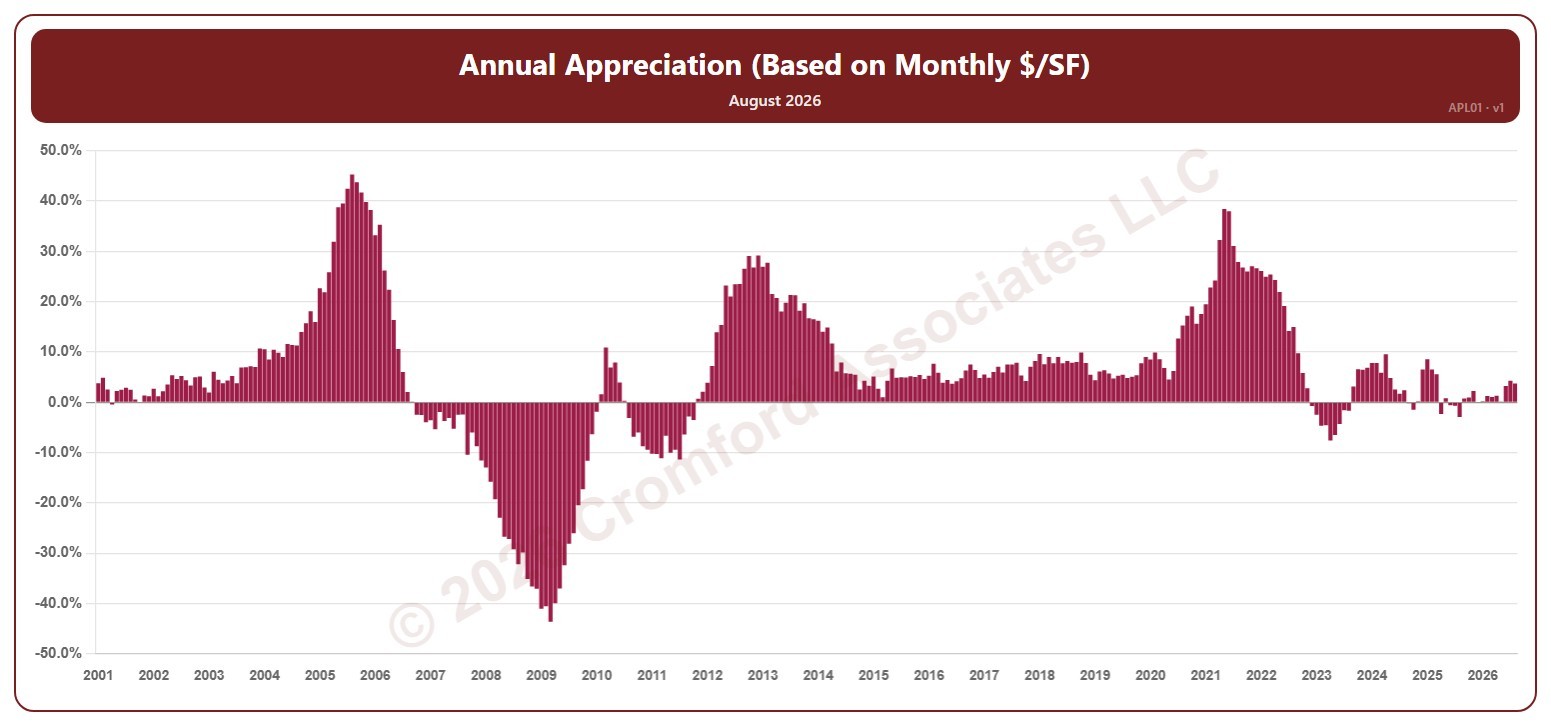
This chart shows annual appreciation, for the whole ARMLS market, all areas and all dwelling types, as one bar per month since January 2001: the change in a month’s average sales price per square foot compared with the same month a year earlier. Above zero, prices are higher than a year ago; below zero, they are lower.

Hover over a bar to see the exact figure for that month.