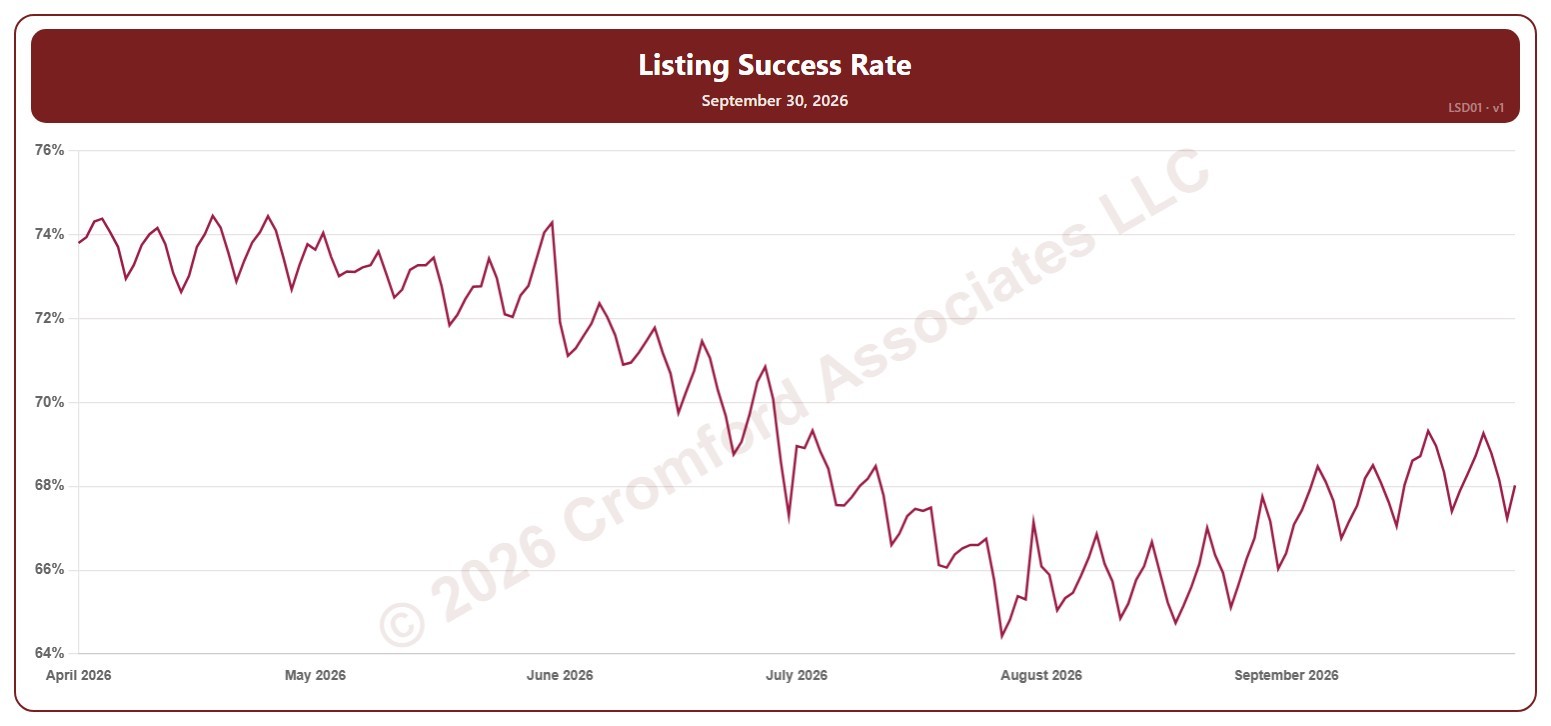
Listing Success Rate – Last 6 Months

About this chart

This chart shows the listing success rate: the share of listings that ended in a sale rather than being canceled or expiring, over a month, for the whole ARMLS market, all areas and all dwelling types, every day over the last six months. Each point covers the listings that ended (sold, canceled, or expired) in the month up to that day. A higher rate means more listings are ending in a sale.

Hover over the line to see the exact figure for that day.
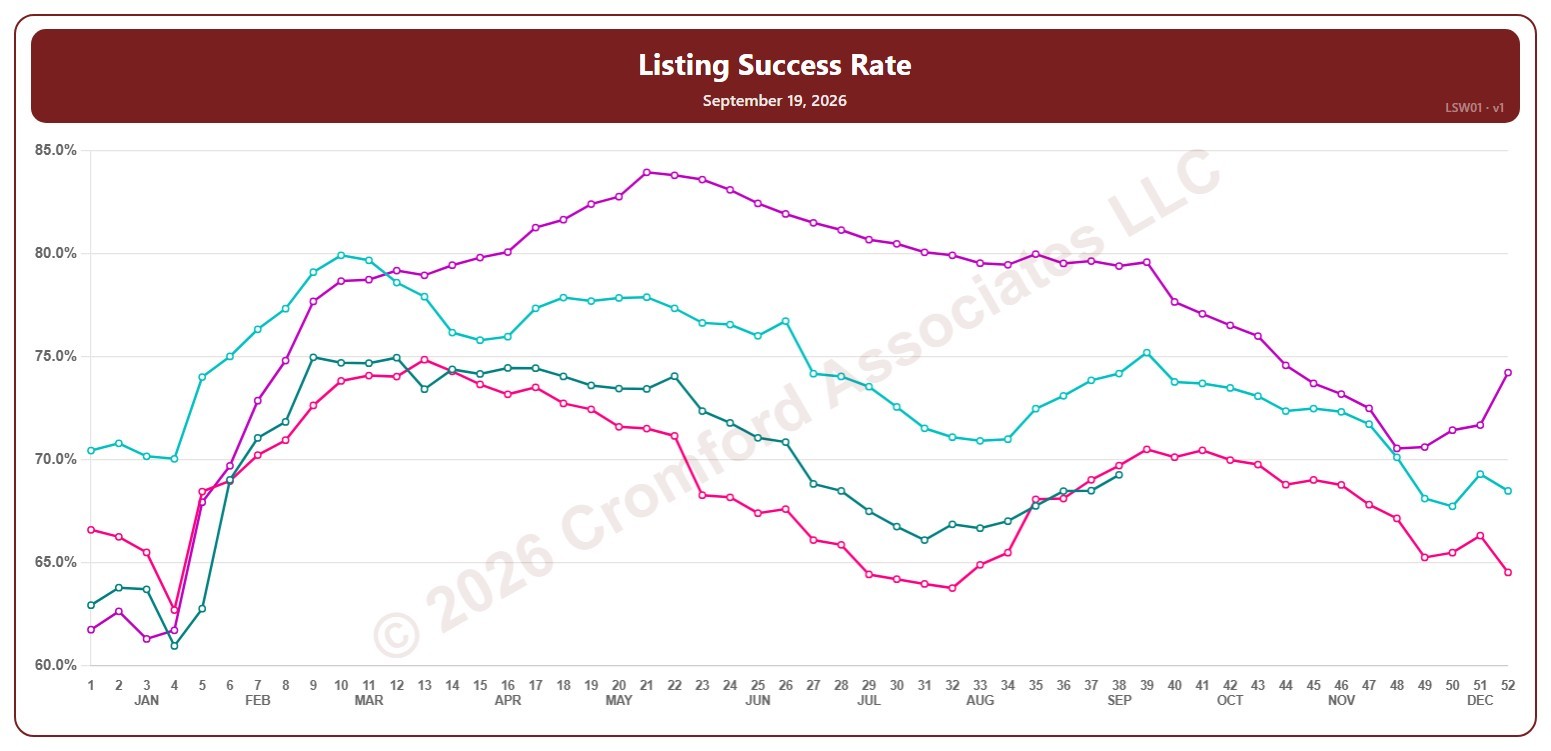
Listing Success Rate – Weekly

About this chart

This chart shows the listing success rate: the share of listings that ended in a sale rather than being canceled or expiring, over a month, for the whole ARMLS market, all areas and all dwelling types, measured every week. Each point covers the listings that ended (sold, canceled, or expired) in the month up to that Saturday. A higher rate means more listings are ending in a sale.

Each year has its own line, laid out by week of the year (each Saturday), so you can compare this year with earlier years at the same point in the season. It opens on the last four years; tick any year back to 2002 in the Year panel.

Hover over a line to see the exact figure for that week.

Average List Price per Square Foot – Listings Under Contract – Weekly

About this chart

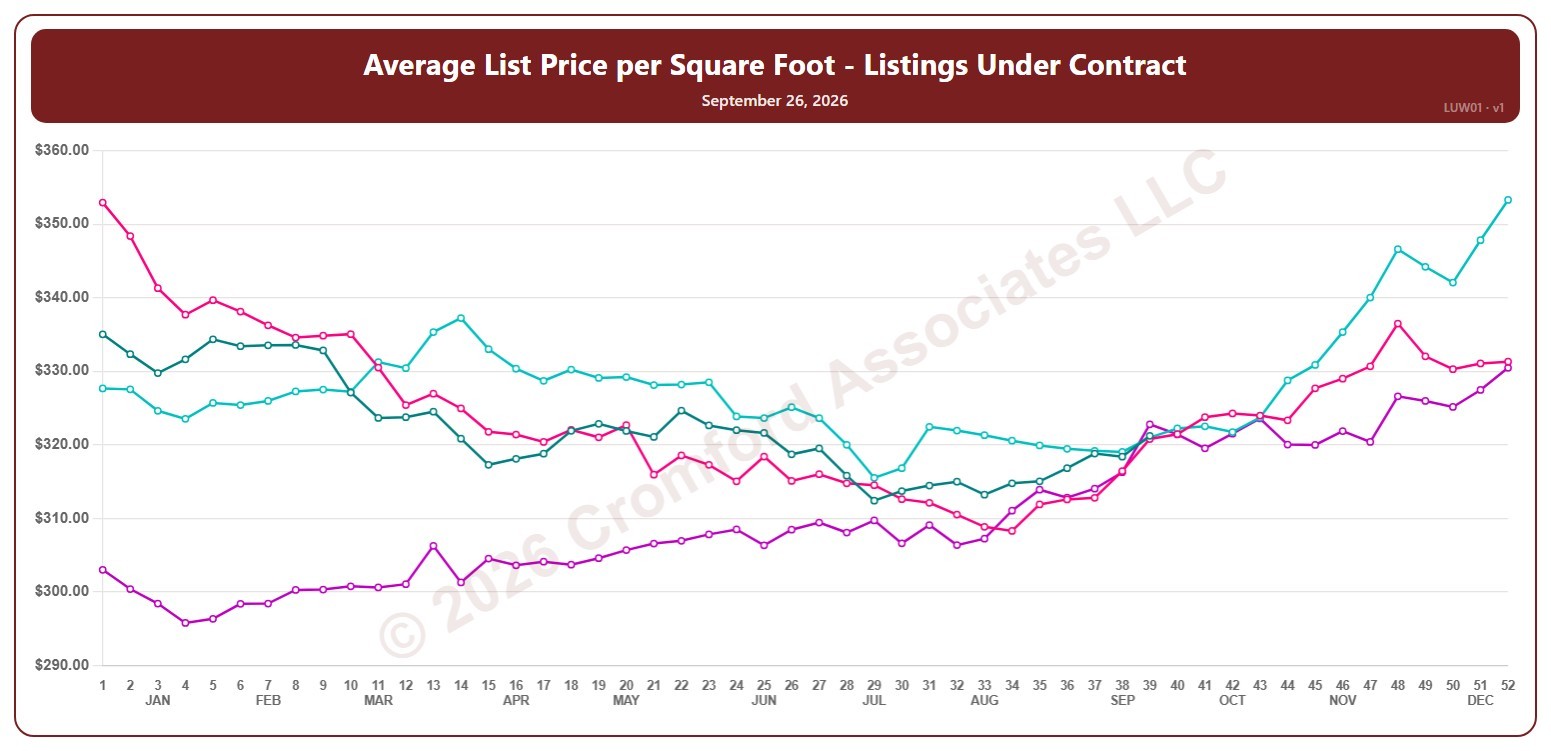
This chart shows the average list price per square foot of listings under contract (Pending plus UCB / CCBS), for the whole ARMLS market, all areas and all dwelling types, counted every Saturday. It shows what sellers are asking, as the true average across all the square feet listed.

Each year has its own line, laid out by week of the year (each Saturday), so you can compare this year with earlier years at the same point in the season. It opens on the last four years; tick any year back to 2006 in the Year panel.

Hover over a line to see the exact figure for that week.

Months Supply (including UCB & CCBS) – Long Term

About this chart

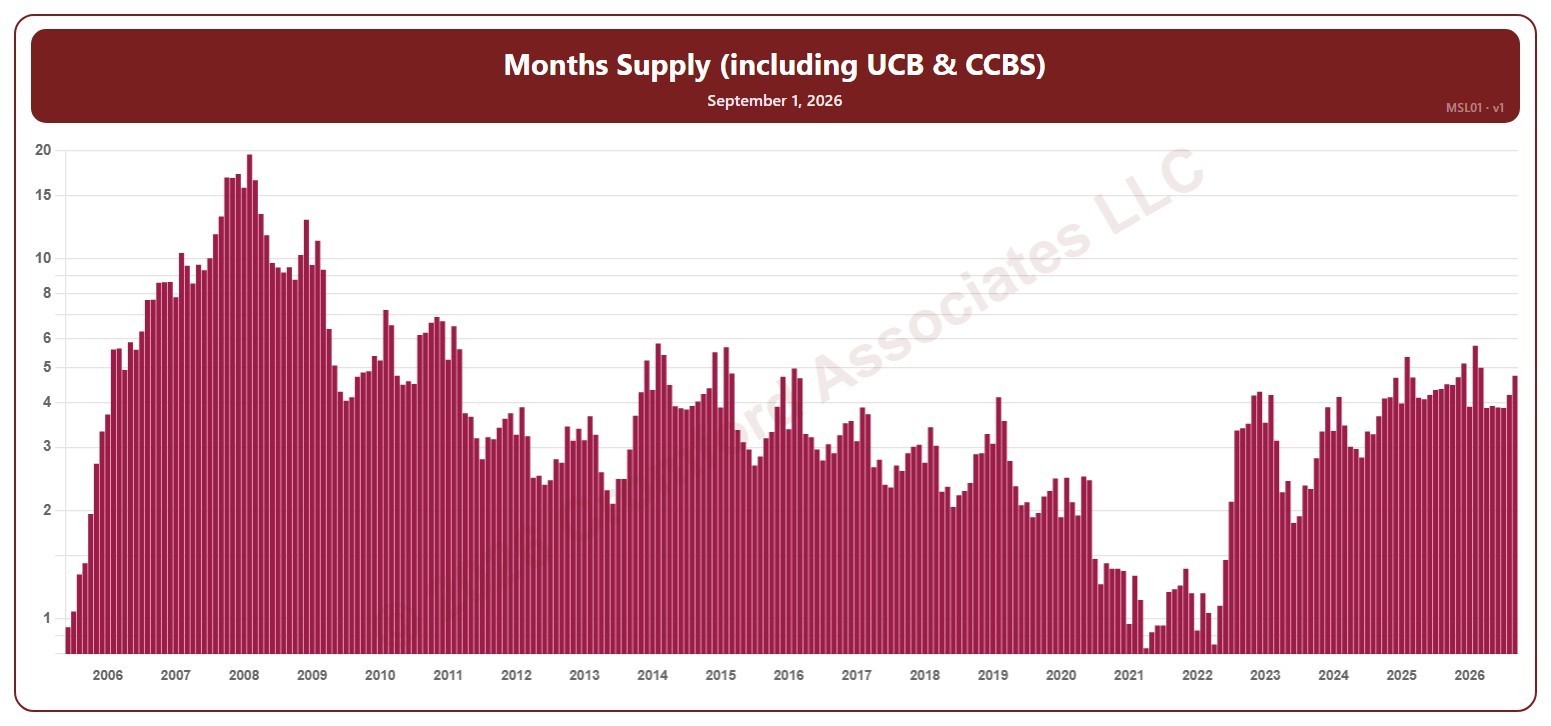
This chart shows months of supply, for the whole ARMLS market, all areas and all dwelling types, as one bar per month since June 2005, each the reading on the 1st of the month: how many months it would take to sell all the active listings (including UCB / CCBS) at the rate homes sold over the last month, if no new listings came on. The lower the number, the tighter the supply and the better for sellers. The value axis is logarithmic, so equal steps up the axis are equal percentage changes; this keeps both the extreme years and today readable.

Hover over a bar to see the exact figure for that month.

Months Supply (including UCB & CCBS) – Monthly

About this chart

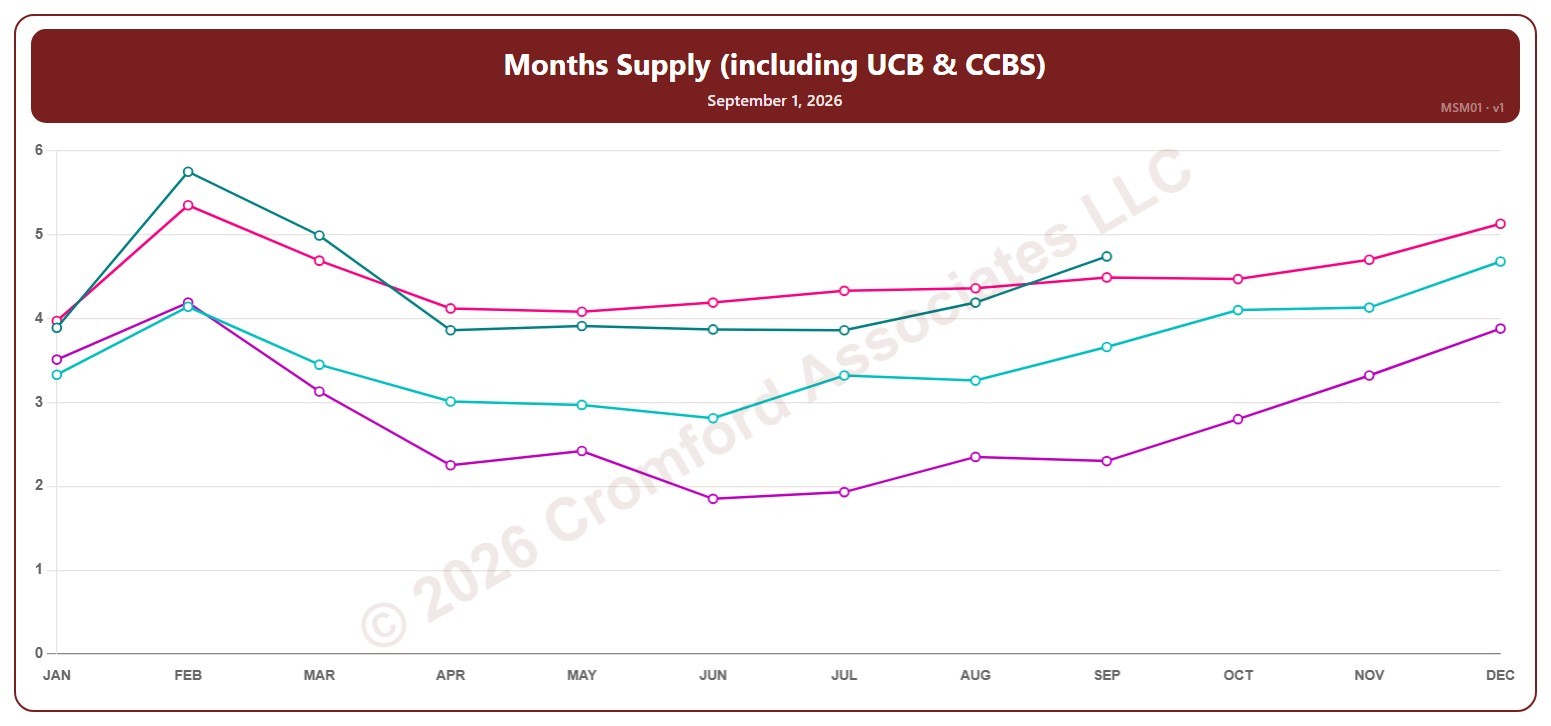
This chart shows months of supply, for the whole ARMLS market, all areas and all dwelling types, read on the 1st of each month: how many months it would take to sell all the active listings (including UCB / CCBS) at the rate homes sold over the last month, if no new listings came on. The lower the number, the tighter the supply and the better for sellers.

Each year has its own line, laid out by month, so you can compare this year with earlier years at the same point in the season. It opens on the last four years; tick any year back to 2005 in the Year panel.

Hover over a line to see the exact figure for that month.

Months Supply (including UCB & CCBS) – Weekly

About this chart

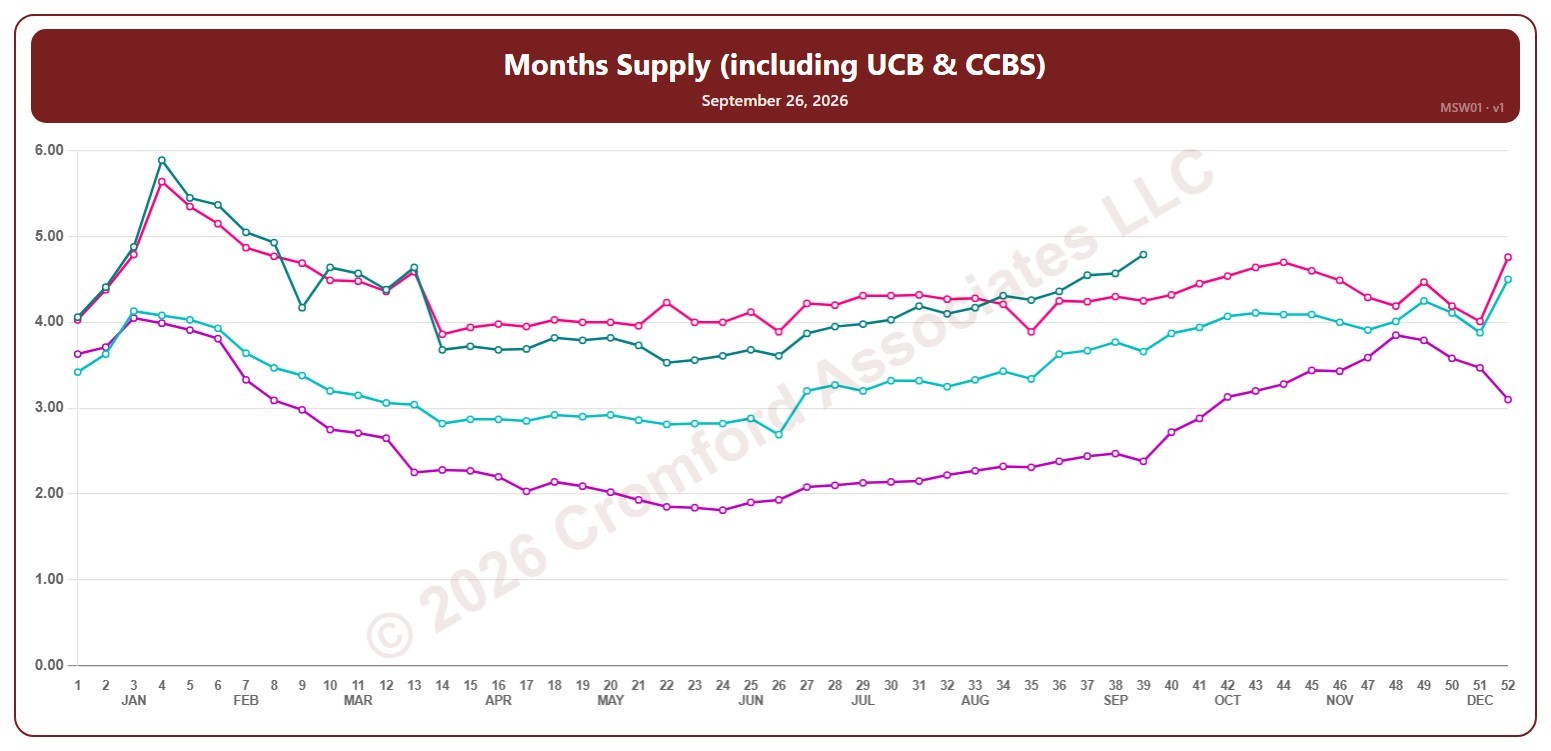
This chart shows months of supply, for the whole ARMLS market, all areas and all dwelling types, counted every Saturday: how many months it would take to sell all the active listings (including UCB / CCBS) at the rate homes sold over the last month, if no new listings came on. The lower the number, the tighter the supply and the better for sellers.

Each year has its own line, laid out by week of the year (each Saturday), so you can compare this year with earlier years at the same point in the season. It opens on the last four years; tick any year back to 2001 in the Year panel.

Hover over a line to see the exact figure for that week.

Months Supply (excluding UCB & CCBS) – Weekly

About this chart

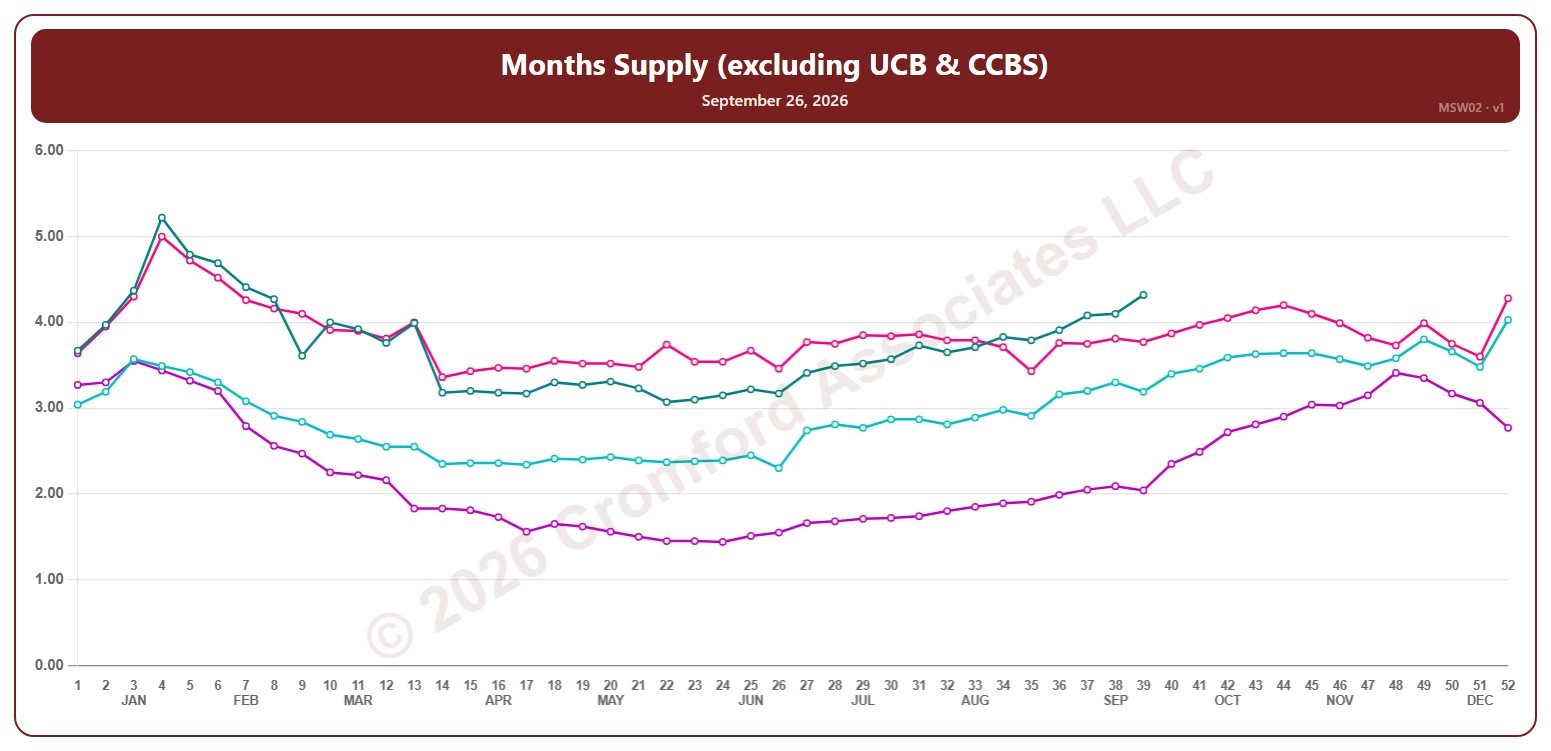
This chart shows months of supply, for the whole ARMLS market, all areas and all dwelling types, counted every Saturday: how many months it would take to sell all the active listings (not counting UCB / CCBS) at the rate homes sold over the last month, if no new listings came on. The lower the number, the tighter the supply and the better for sellers.

Each year has its own line, laid out by week of the year (each Saturday), so you can compare this year with earlier years at the same point in the season. It opens on the last four years; tick any year back to 2005 in the Year panel.

Hover over a line to see the exact figure for that week.

Average Sales Price – Annual – Long Term

About this chart

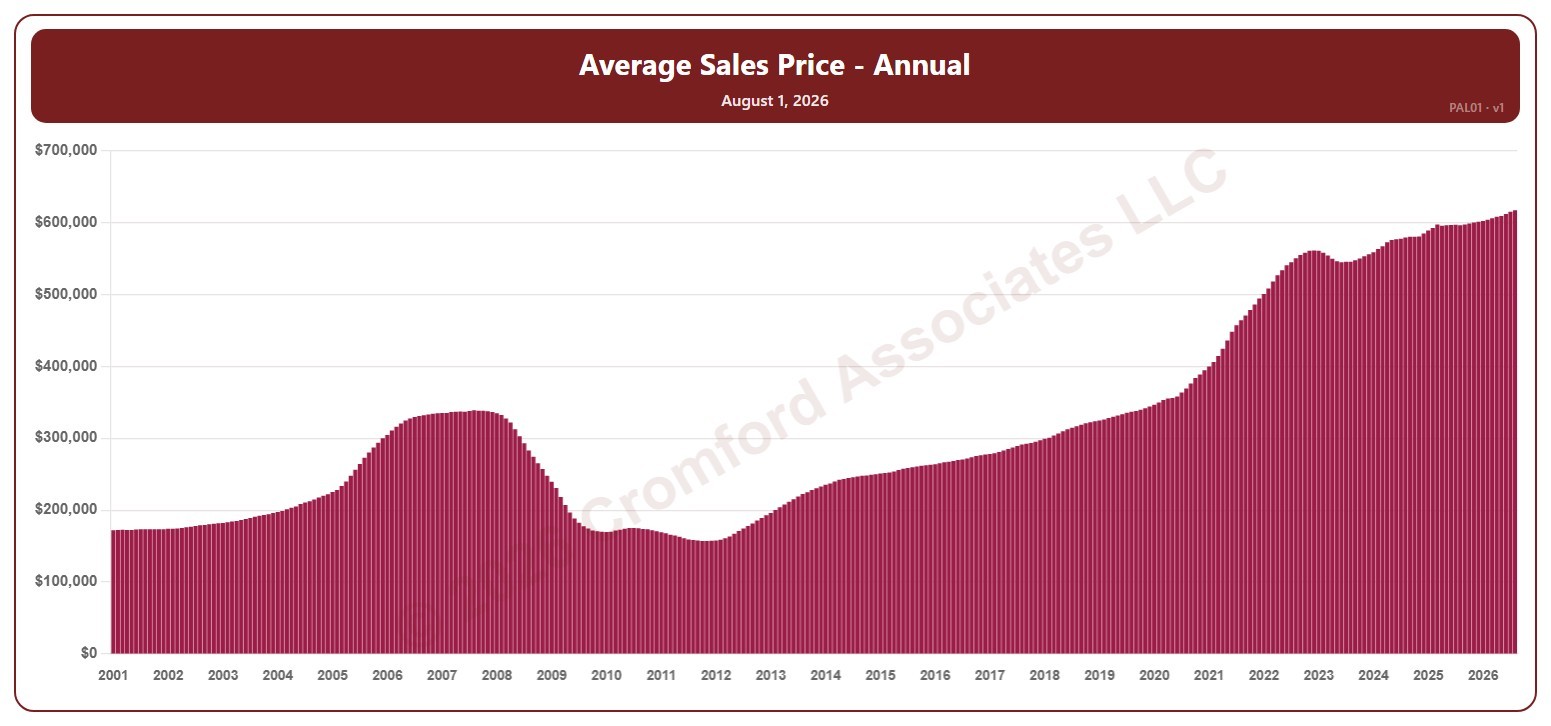
This chart shows the average sales price of the homes that closed over 12 months, for the whole ARMLS market, all areas and all dwelling types, as one bar per month since January 2001. Each bar covers the 12 months ending with the month it sits at, so the bar labeled June covers July 1 of the year before to June 30. Sales of large, expensive homes pull the average up more than the median.

Hover over a bar to see the exact figure for that month.

Average Sales Price – Annual – Monthly

About this chart

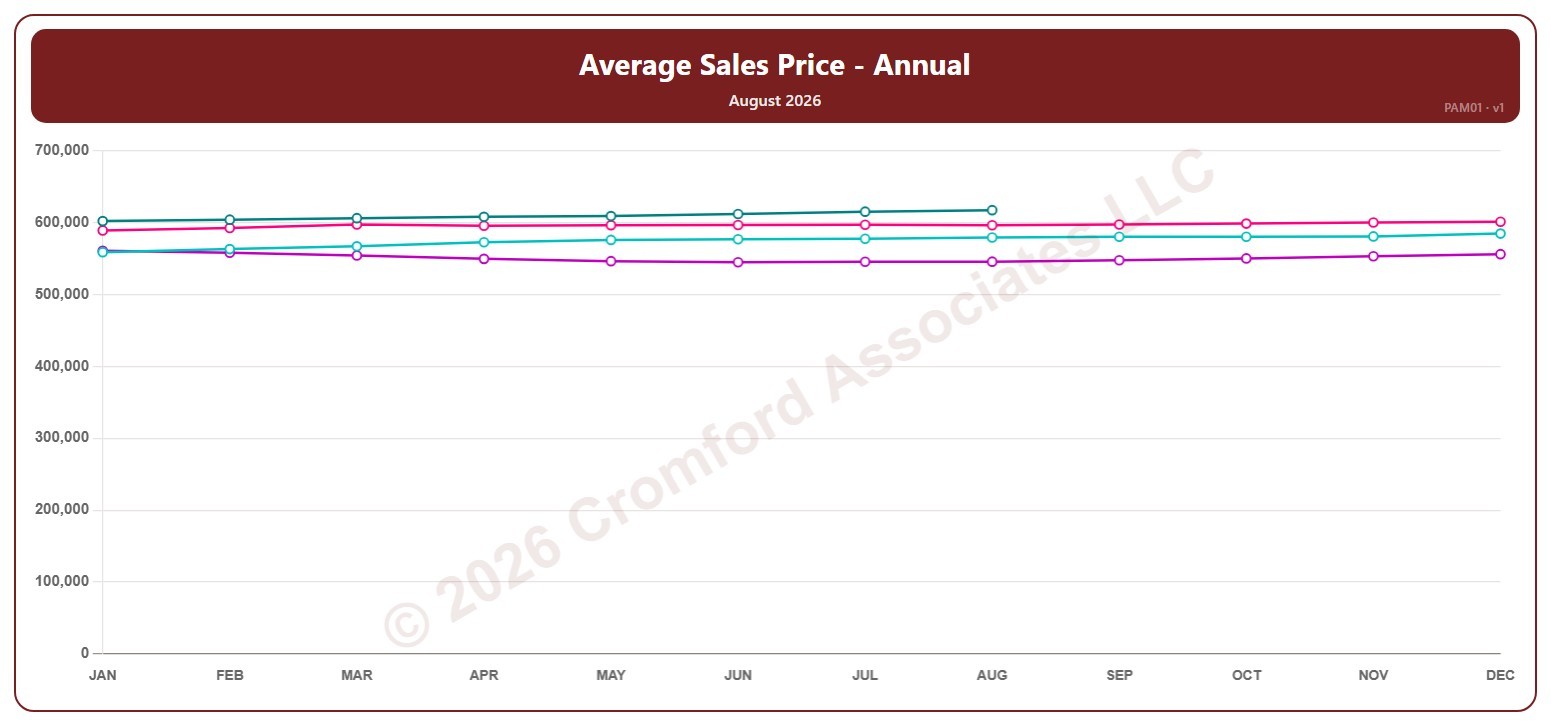
This chart shows the average sales price of the homes that closed over 12 months, for the whole ARMLS market, all areas and all dwelling types, measured monthly. Each point covers the 12 months ending with that month. Sales of large, expensive homes pull the average up more than the median.

Each year has its own line, laid out by month, so you can compare this year with earlier years at the same point in the season. It opens on the last four years; tick any year back to 2001 in the Year panel.

Hover over a line to see the exact figure for that month.

Average Sales Price – Annual – Weekly

About this chart

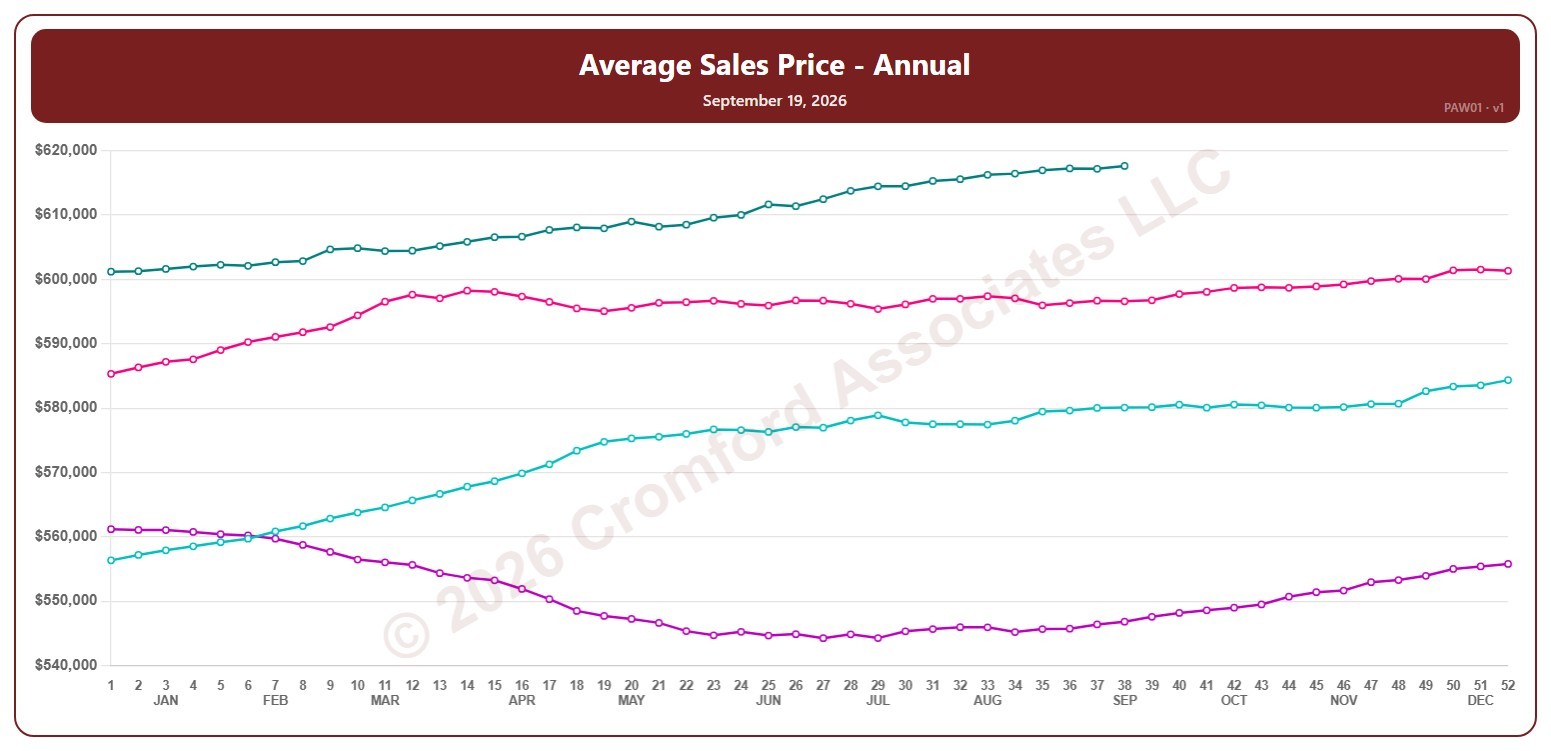
This chart shows the average sales price of the homes that closed over 12 months, for the whole ARMLS market, all areas and all dwelling types, measured every week. Each point covers the closings in the 12 months up to that Saturday. Sales of large, expensive homes pull the average up more than the median.

Each year has its own line, laid out by week of the year (each Saturday), so you can compare this year with earlier years at the same point in the season. It opens on the last four years; tick any year back to 2001 in the Year panel.

Hover over a line to see the exact figure for that week.