About this chart
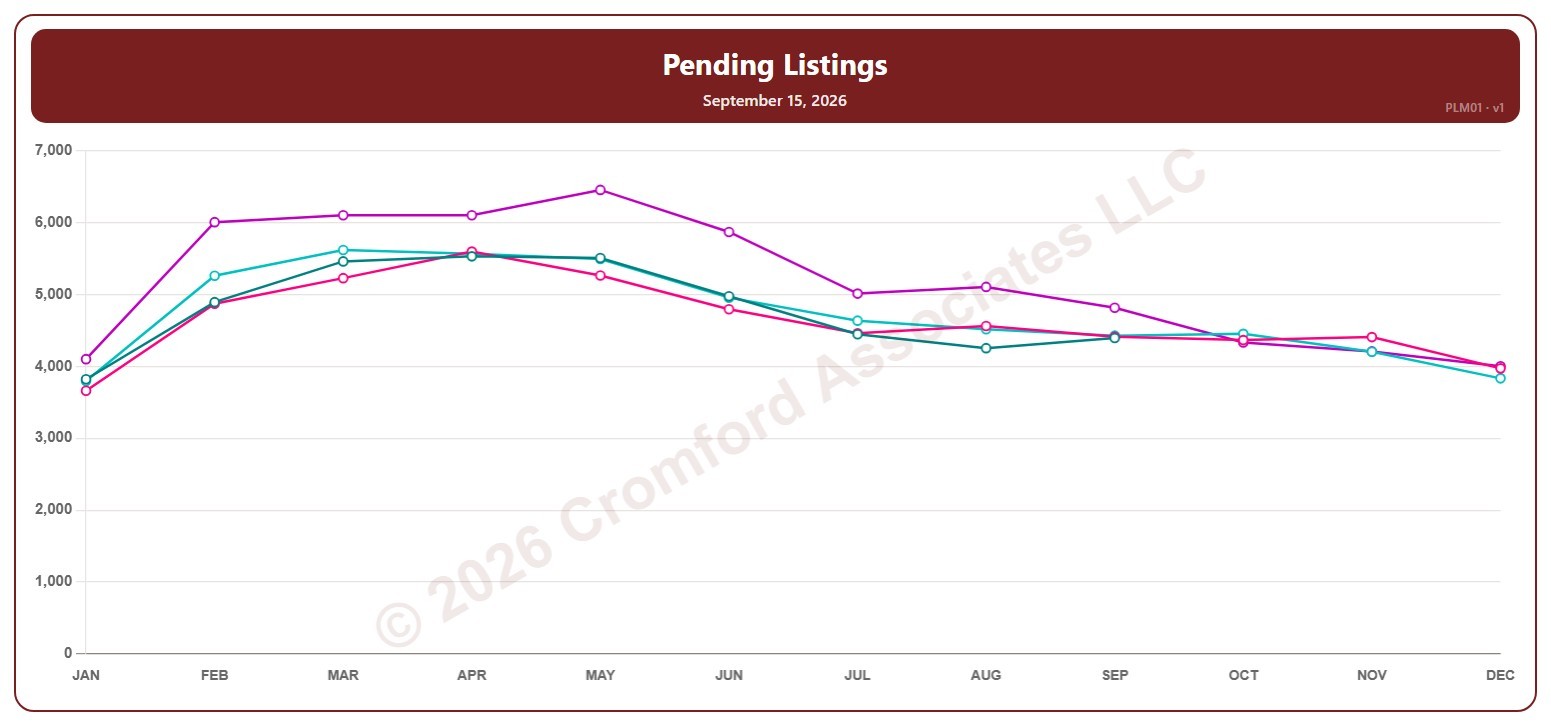
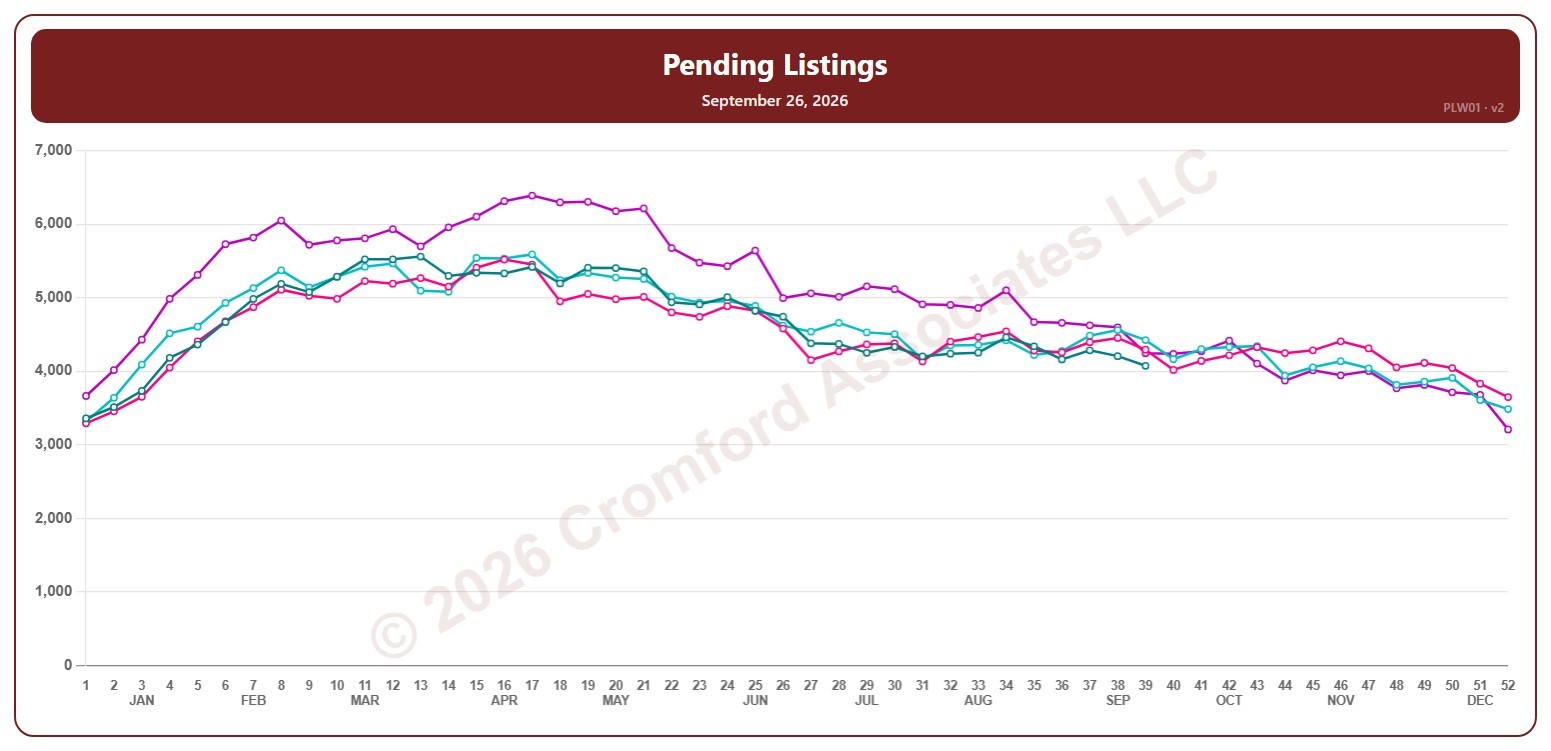
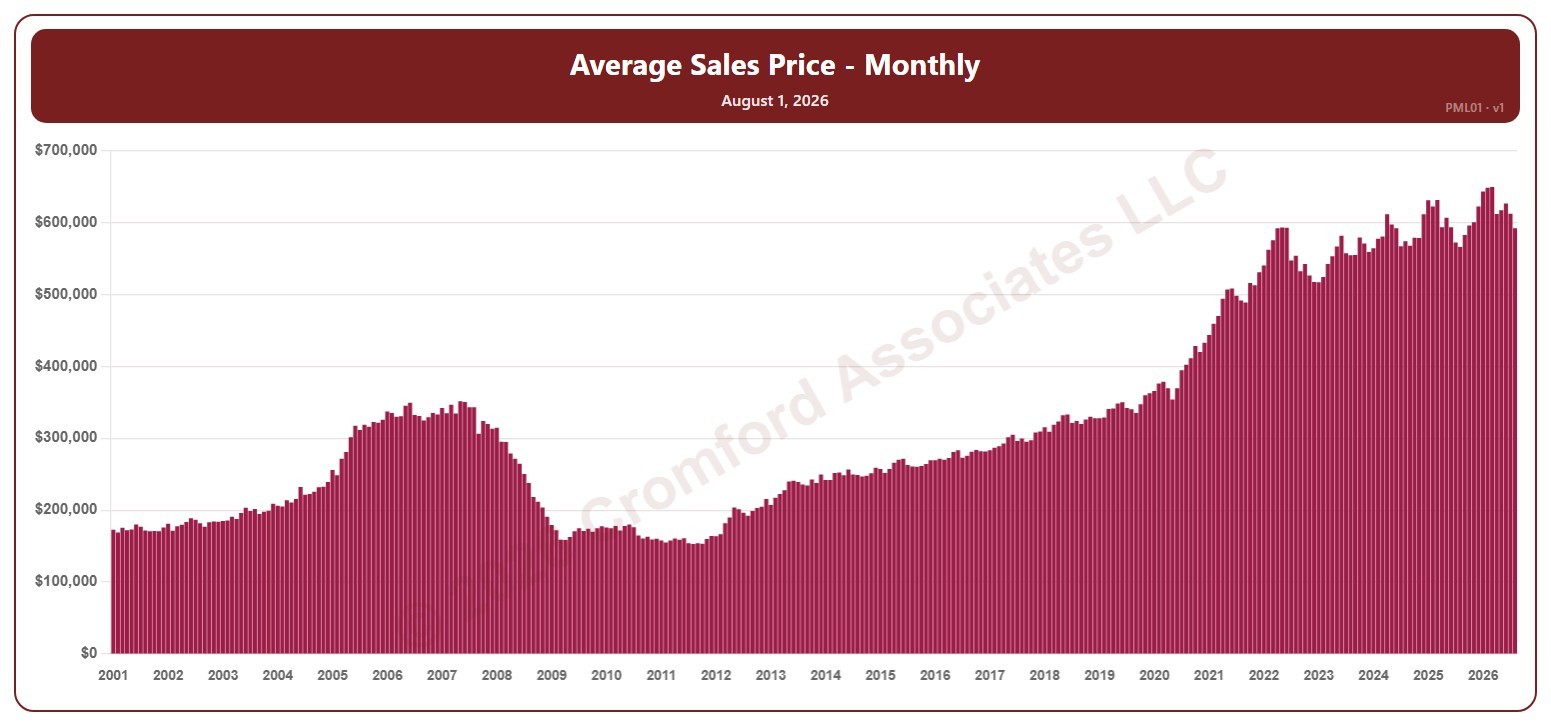
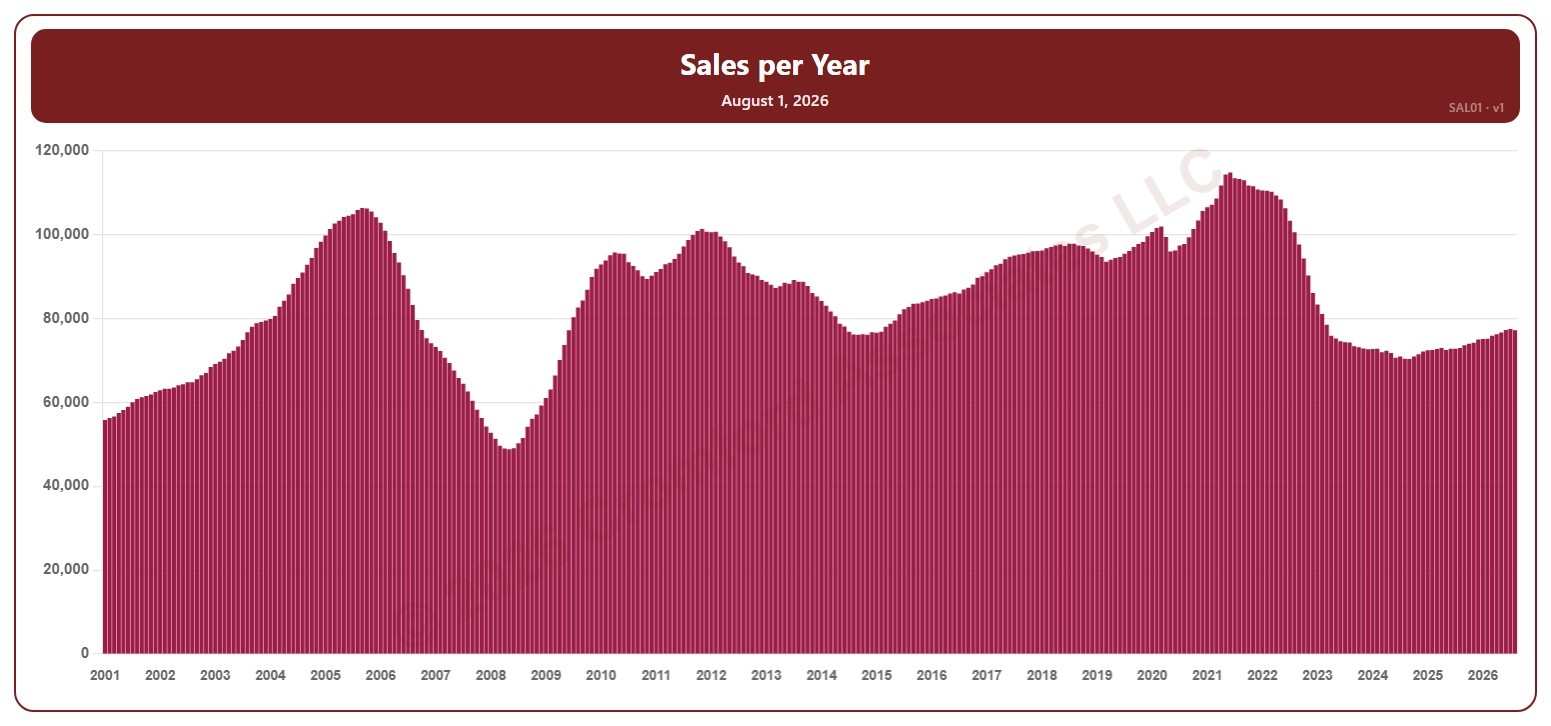
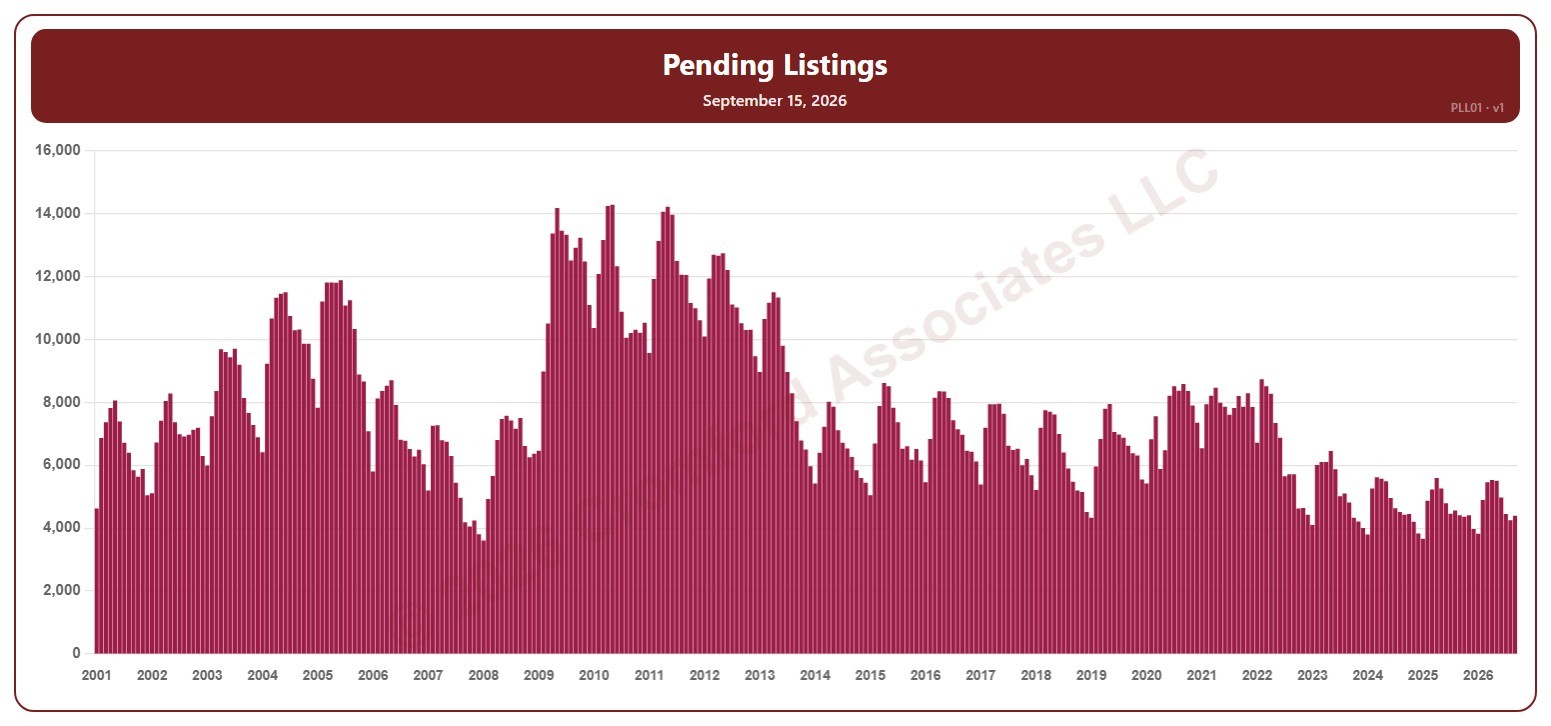
This chart shows the number of Pending listings, for the whole ARMLS market, all areas and all dwelling types, as one bar per month since January 2001, each the reading on the 15th of the month: homes under contract that have not yet closed (UCB / CCBS listings are not included).
Hover over a bar to see the exact figure for that month.