About this chart
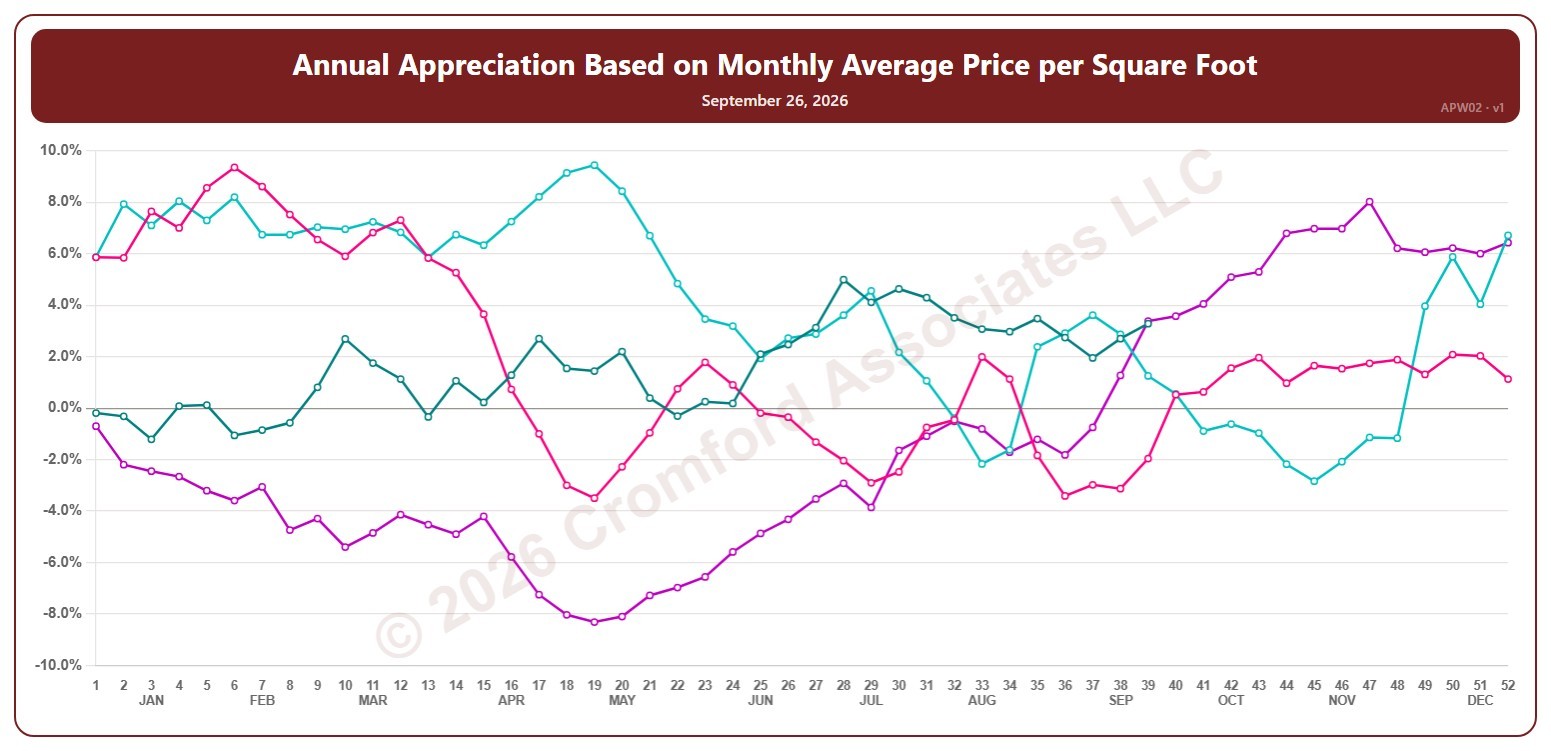
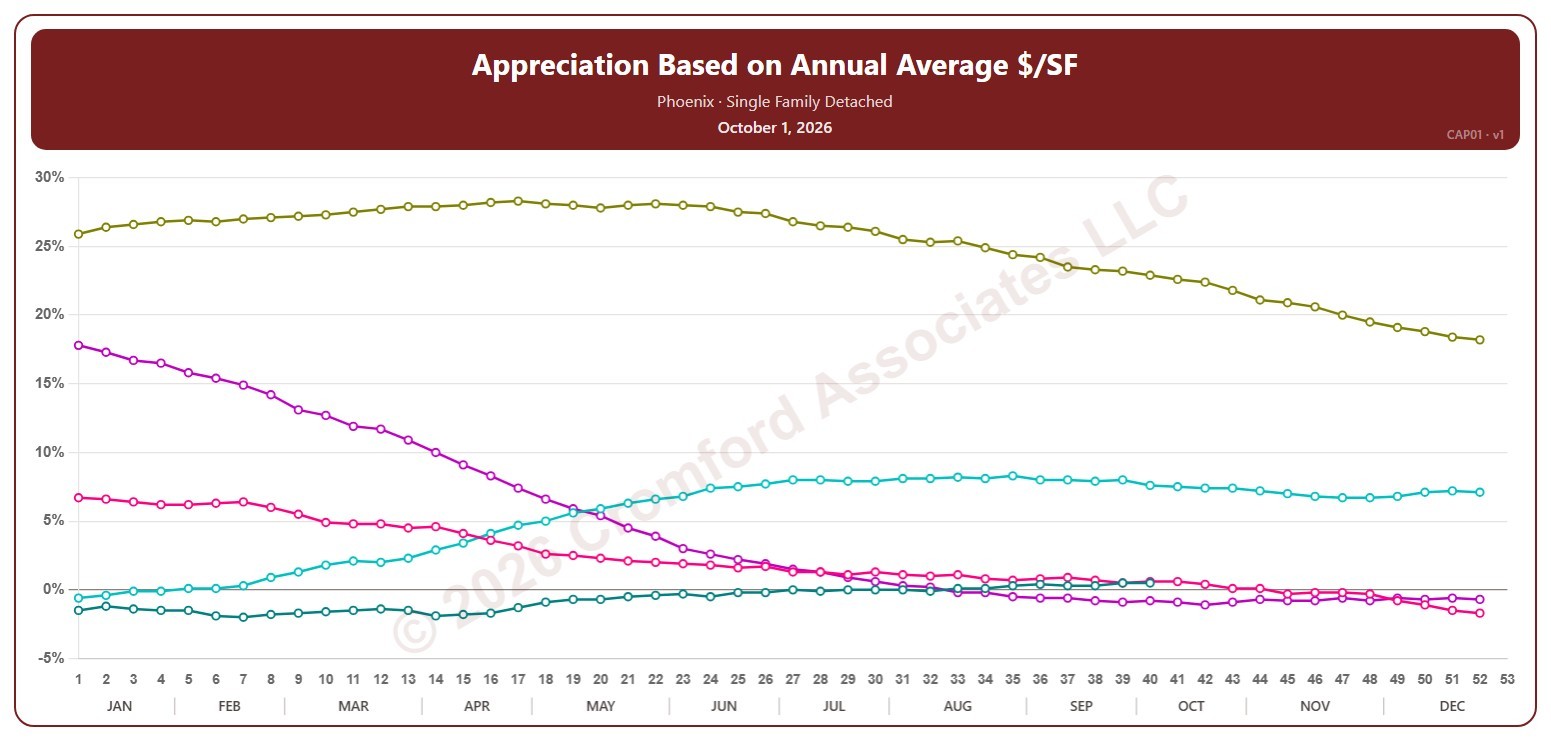
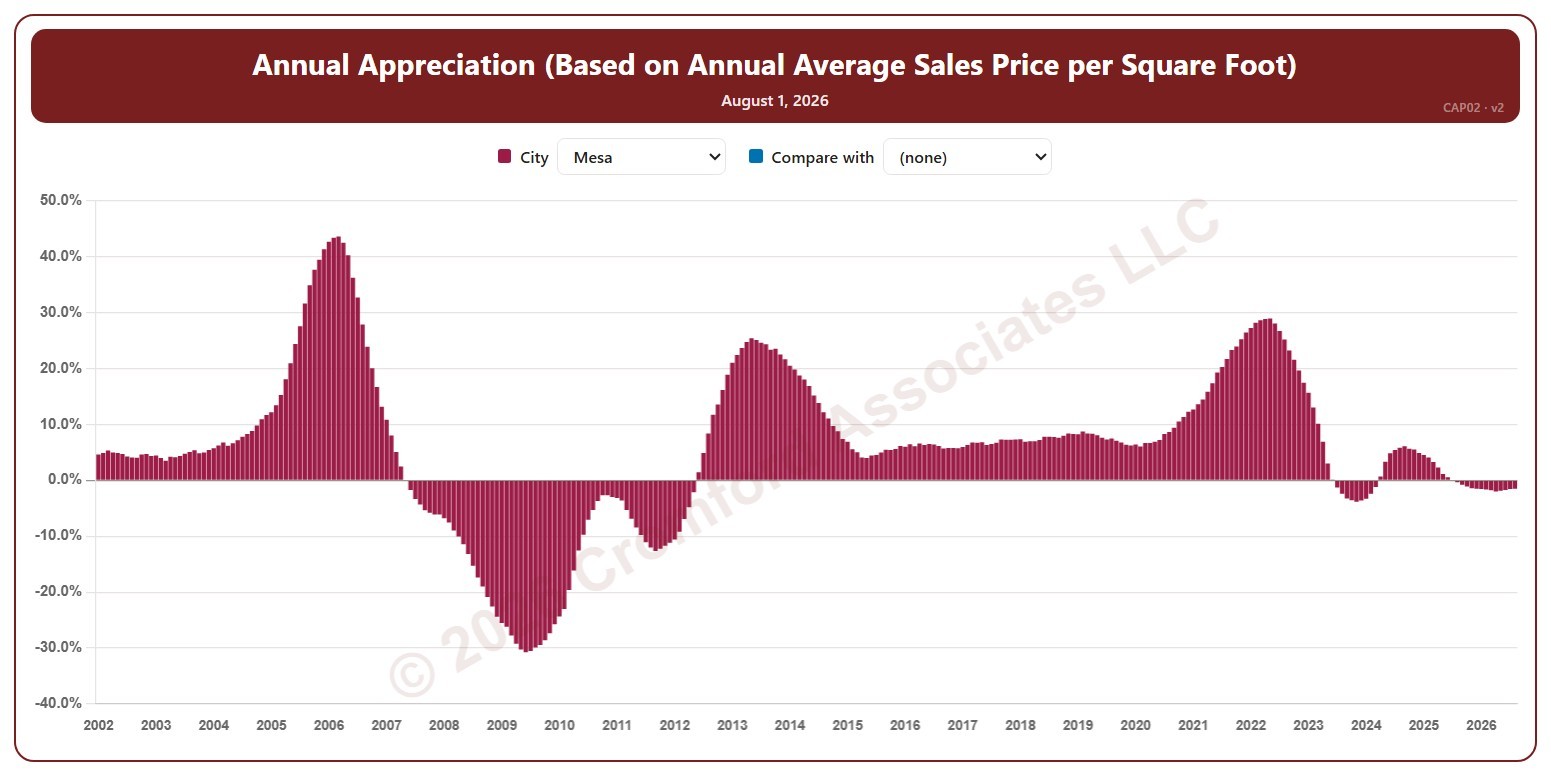
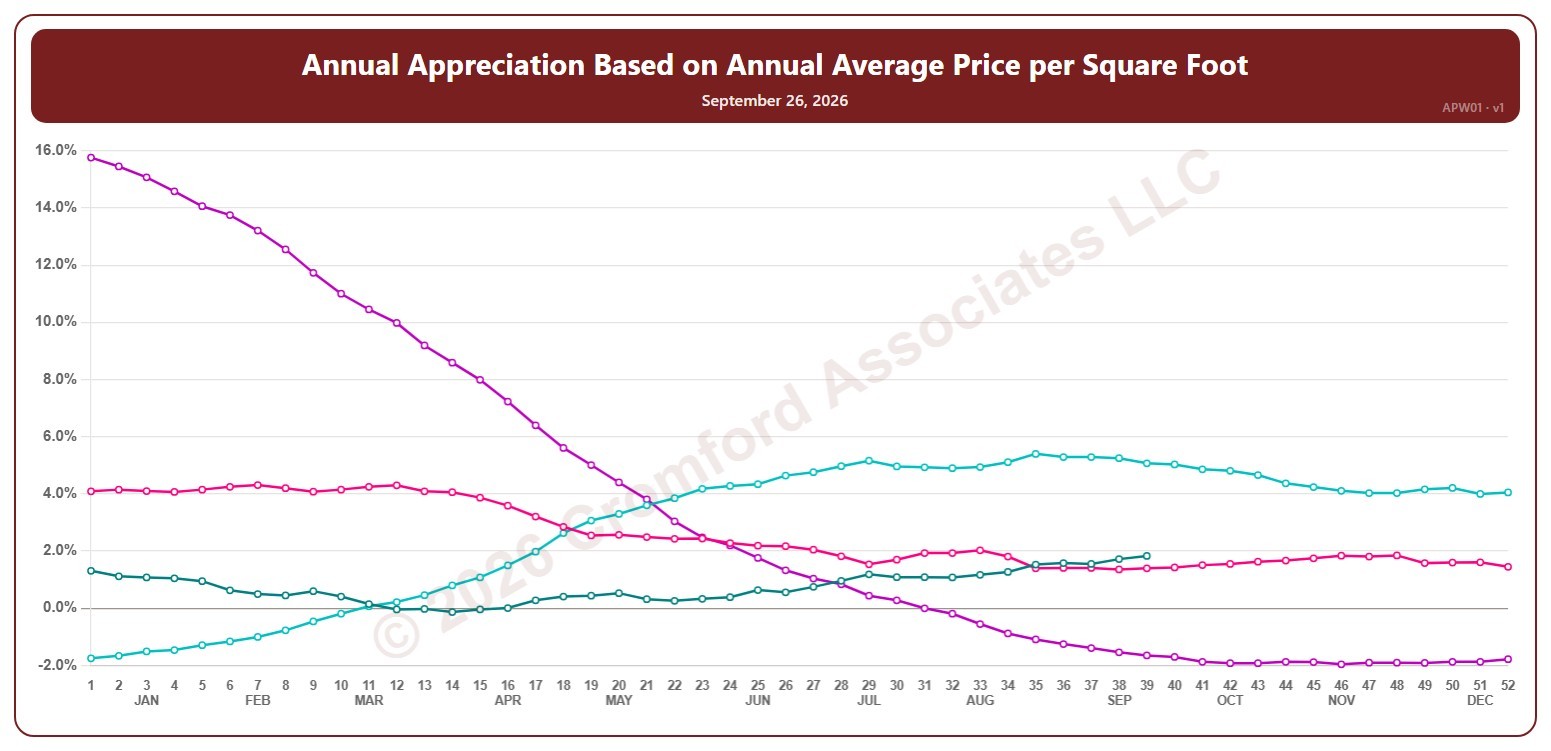
This chart shows annual appreciation, for the whole ARMLS market, all areas and all dwelling types, measured every week: the change in the average sales price per square foot of the homes that closed over the last 12 months, compared with the 12 months to the same date a year earlier. Above zero, prices are higher than a year ago; below zero, they are lower.
Each year has its own line, laid out by week of the year (each Saturday), so you can compare this year with earlier years at the same point in the season. It opens on the last four years; tick any year back to 2002 in the Year panel.
Hover over a line to see the exact figure for that week.