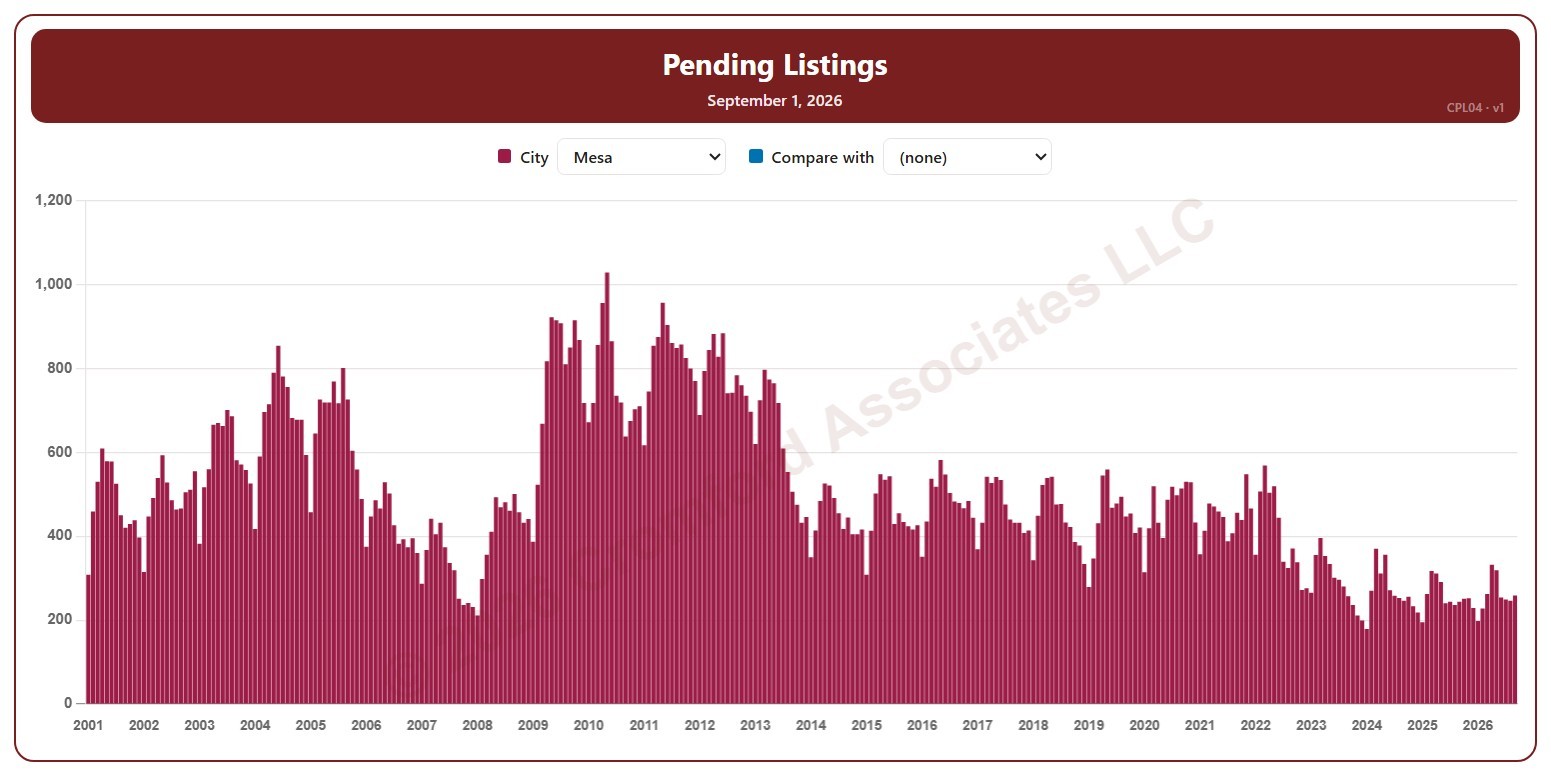
About this chart
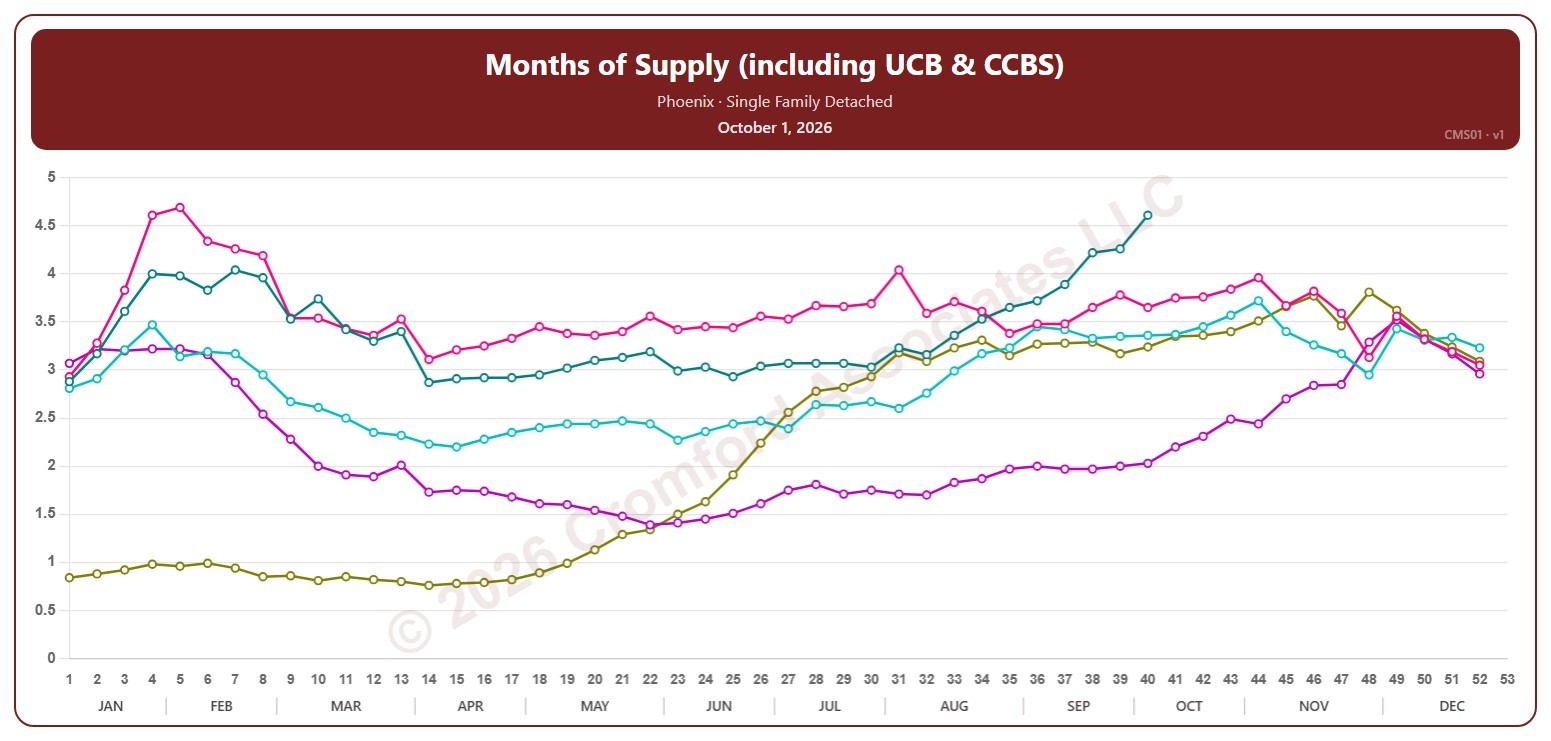
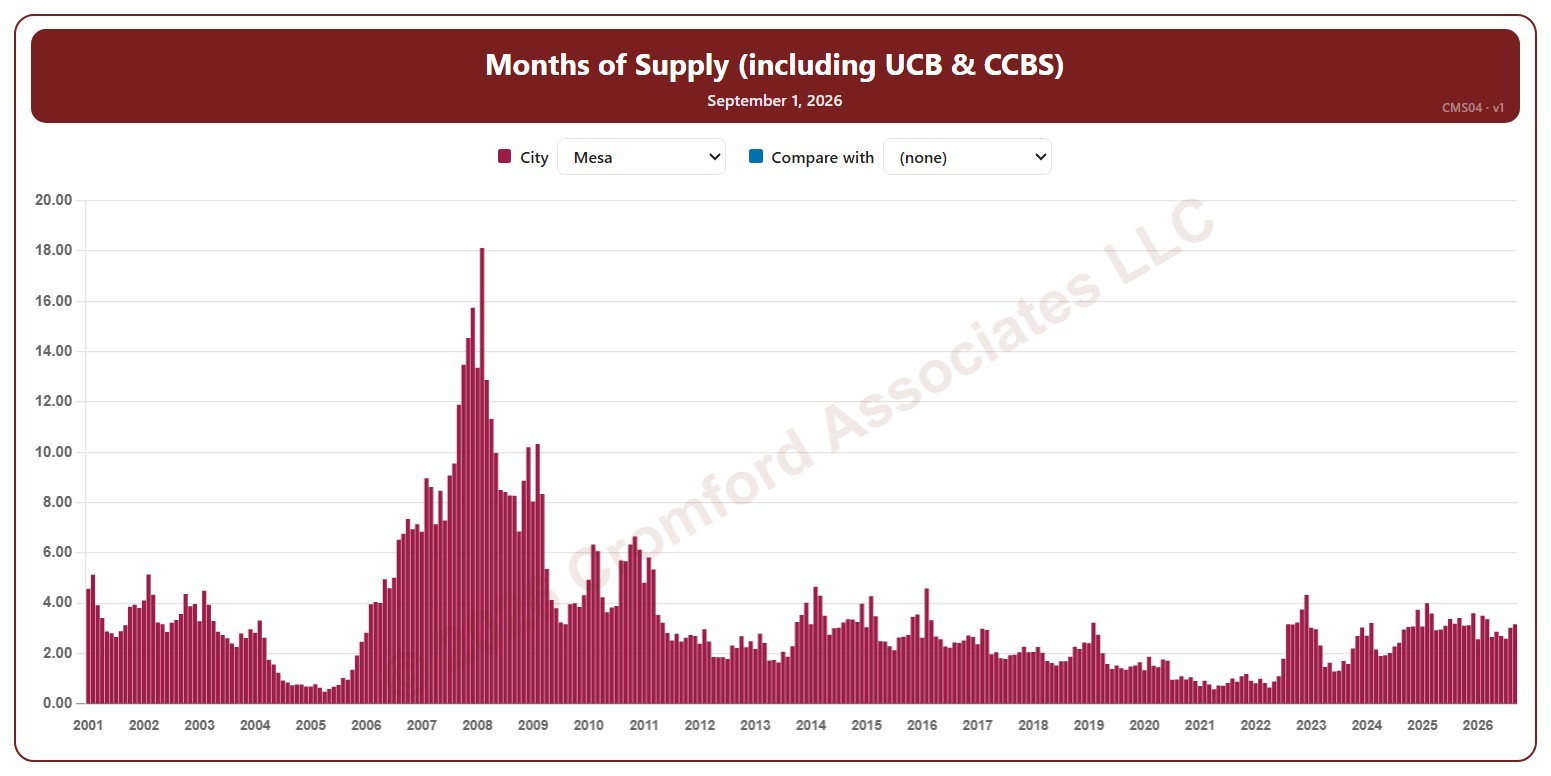
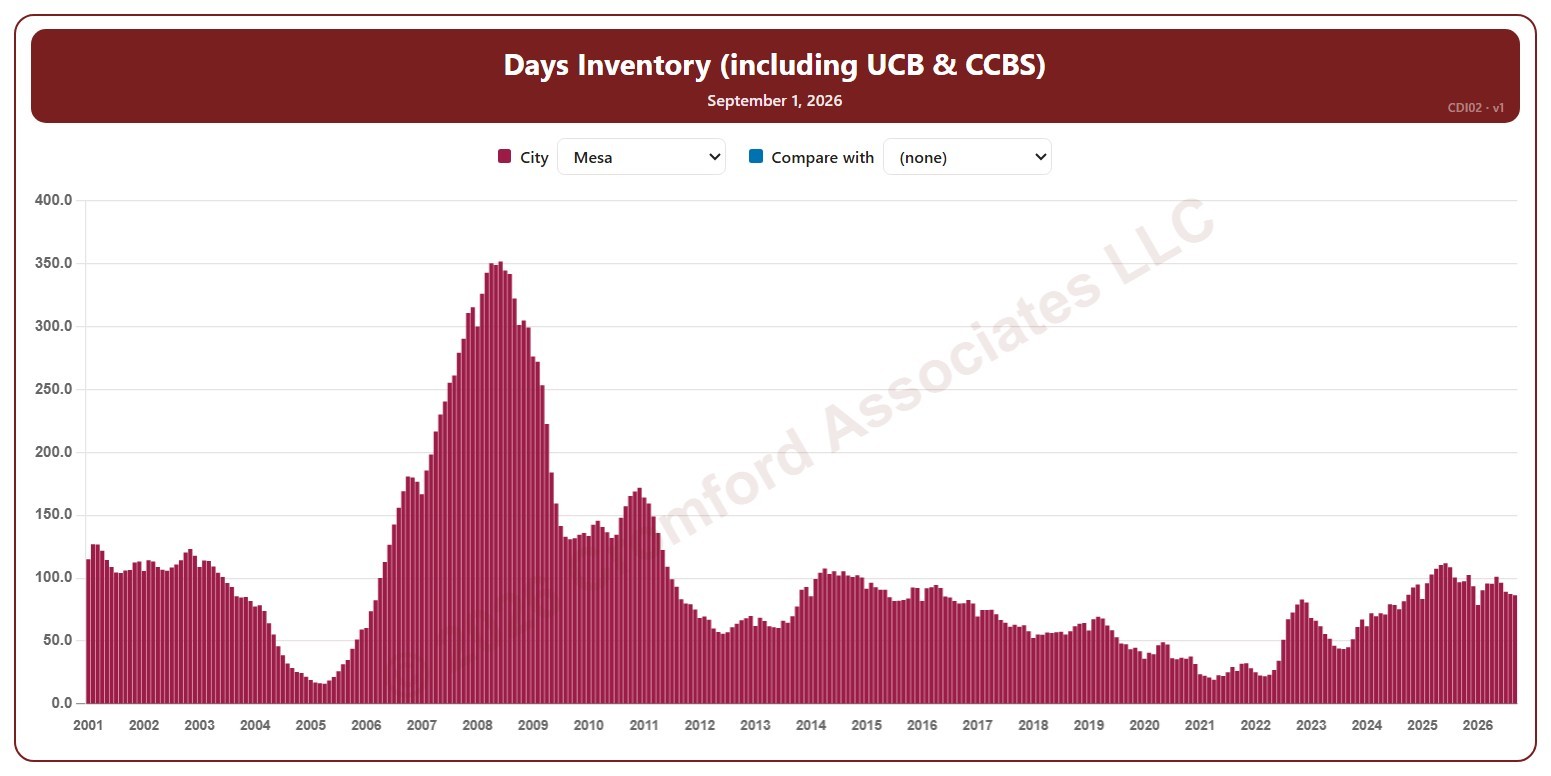
This chart shows days of inventory for single-family detached homes on ARMLS in one city, as one bar per month since January 2001: how many days it would take to sell all the active listings (including UCB / CCBS) at the rate homes sold over the last 12 months, if no new listings came on. Each bar is the reading on the 1st of the month. The lower the number, the tighter the supply.
It opens on Mesa. Pick any of 41 cities from the City list, and use Compare with to add a second city alongside it.
Hover over a bar to see the exact figure for that month.