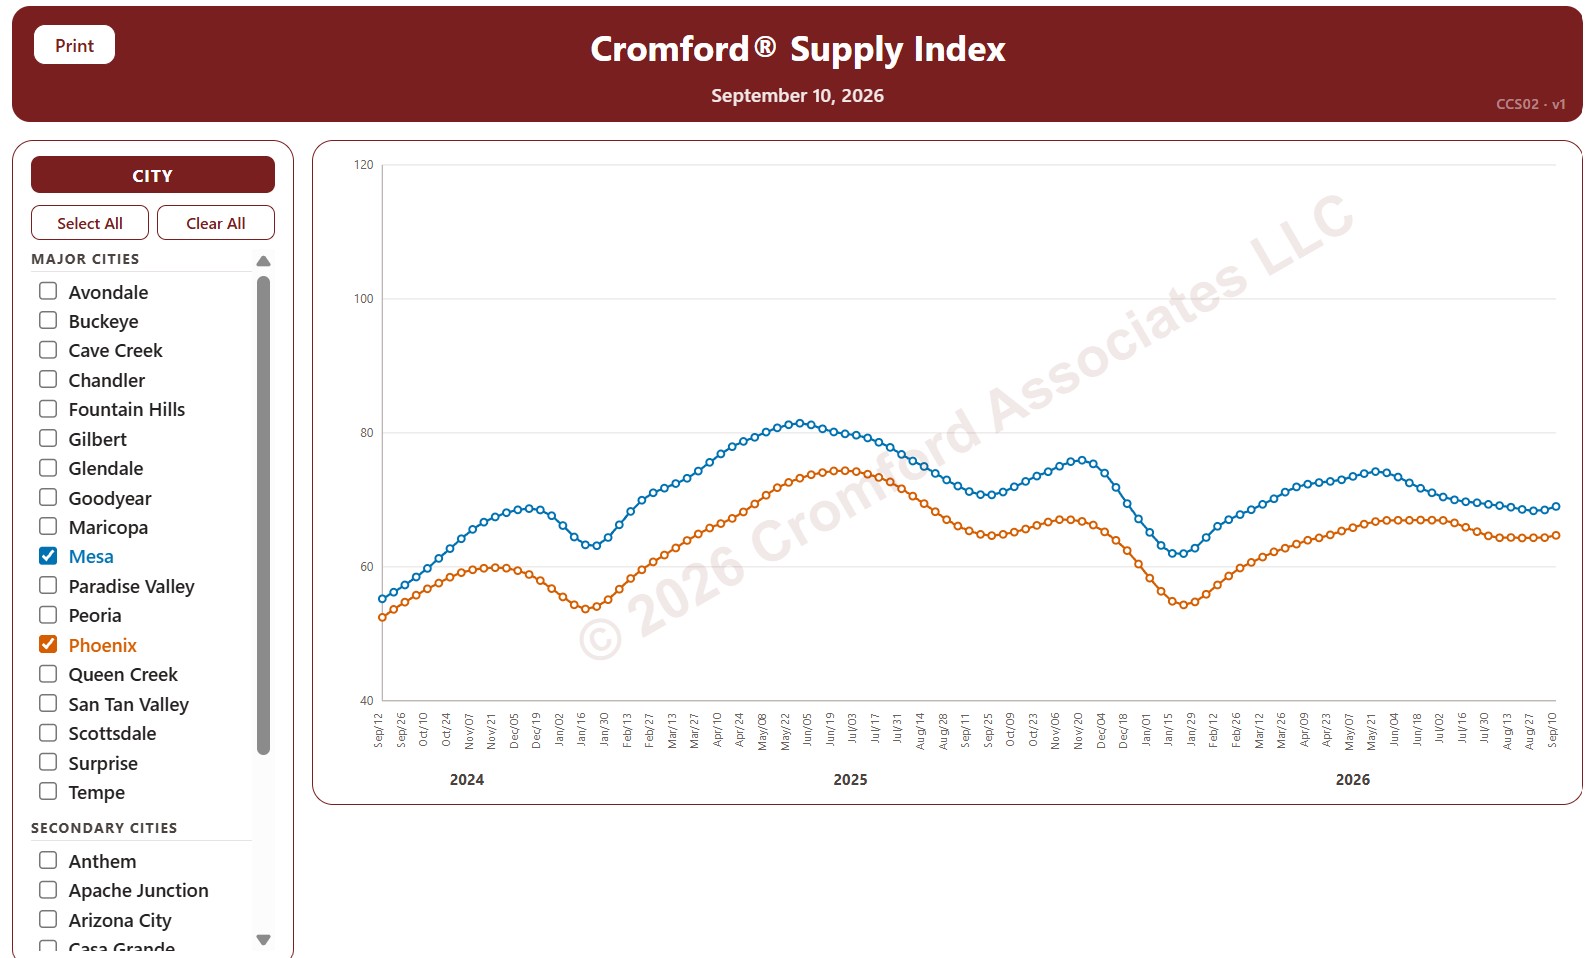
Cromford® Supply Index by City

About this chart

This chart tracks the Cromford® Supply Index for 34 cities in and around Greater Phoenix over the last 24 months, one point per week (each Thursday), for single-family detached resale homes listed on ARMLS. Above 100 means more supply than usual, below 100 less supply than usual, and 100 means supply is close to normal. Low supply favors sellers; high supply favors buyers.

The 18 major cities are drawn as solid lines and the 16 secondary cities as dashed lines. It opens on Mesa and Phoenix; use the city check boxes, or Select All and Clear All, to choose which cities are shown.

Hover over a line to see the exact figure for that week.
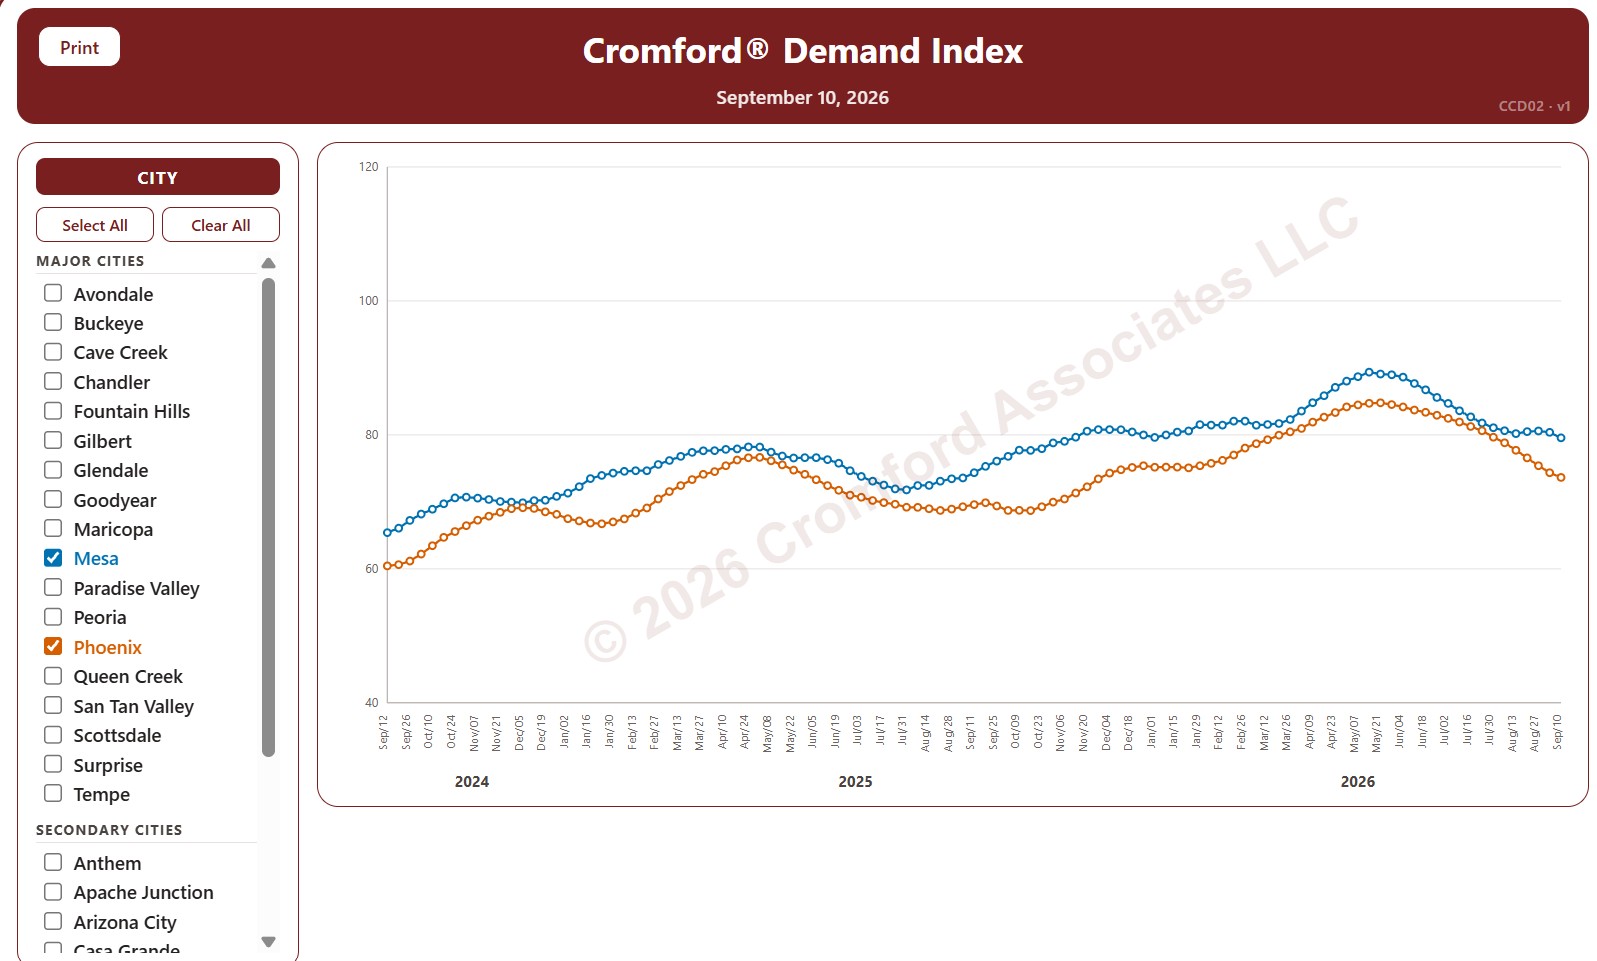
Cromford® Demand Index by City

About this chart

This chart tracks the Cromford® Demand Index for 34 cities in and around Greater Phoenix over the last 24 months, one point per week (each Thursday), for single-family detached resale homes listed on ARMLS. Above 100 means more demand than usual, below 100 less demand than usual, and 100 means demand is close to normal.

The 18 major cities are drawn as solid lines and the 16 secondary cities as dashed lines. It opens on Mesa and Phoenix; use the city check boxes, or Select All and Clear All, to choose which cities are shown.

Hover over a line to see the exact figure for that week.
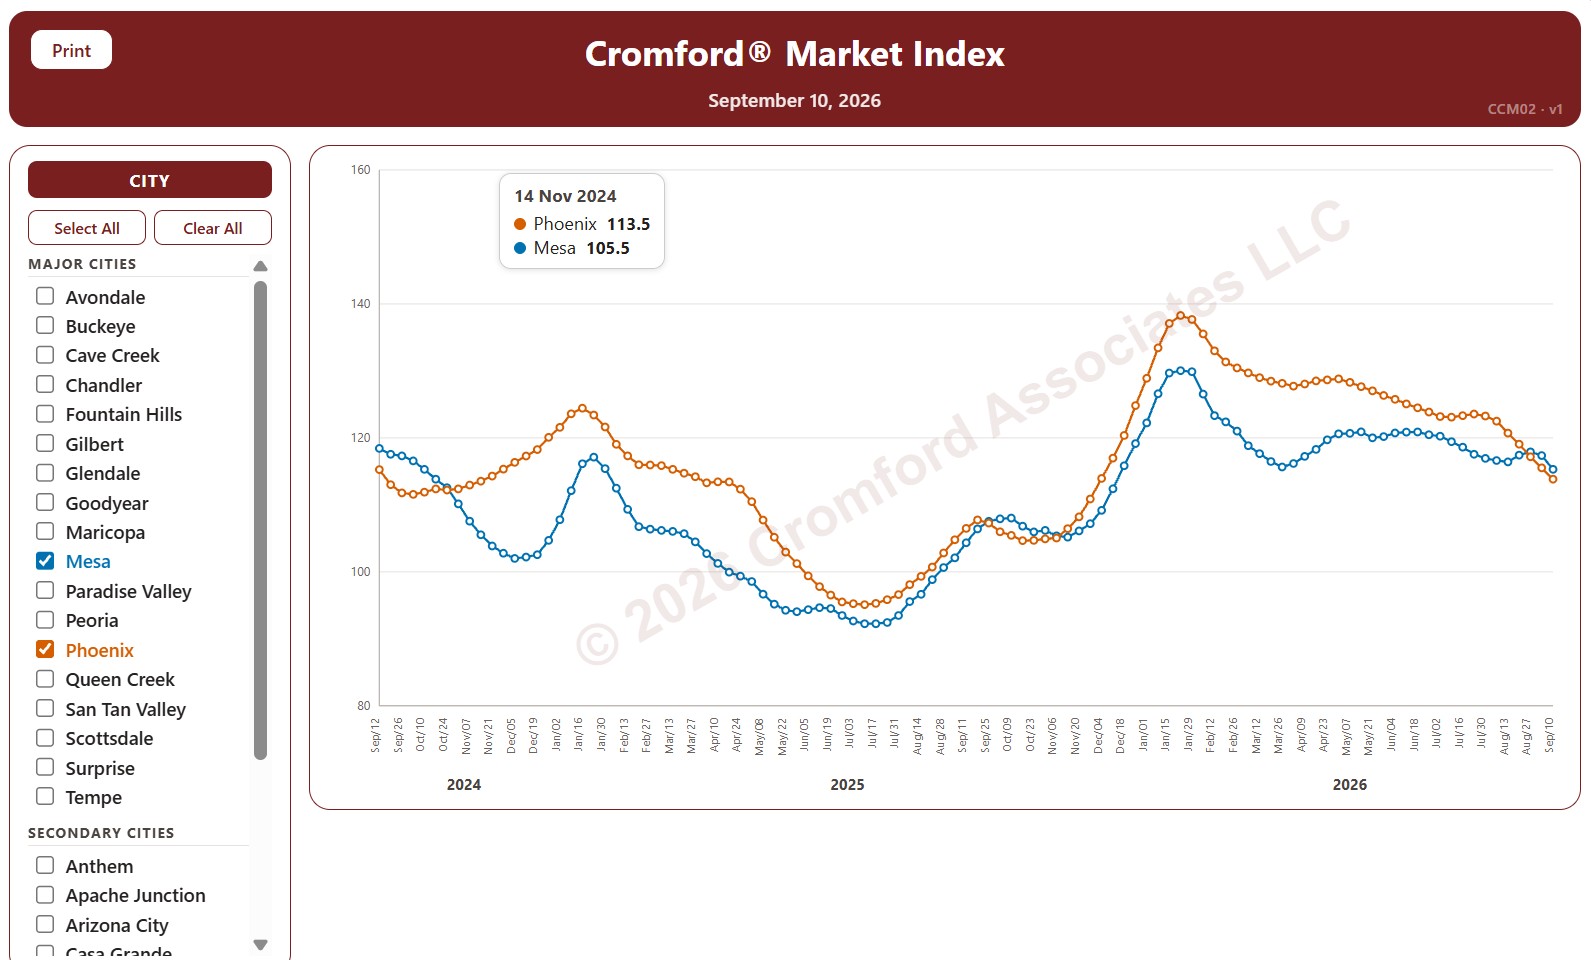
Cromford® Market Index by City

About this chart

This chart tracks the Cromford® Market Index for 34 cities in and around Greater Phoenix over the last 24 months, one point per week (each Thursday). It covers single-family detached resale homes listed on ARMLS. The 18 major cities are drawn as solid lines and the 16 secondary cities as dashed lines.

A reading above 110 means the city’s market favors sellers, below 90 it favors buyers, and between 90 and 110 the market is balanced. The index looks ahead, so the direction of a line shows which way the balance between buyers and sellers is moving.

Use the city check boxes, or Select All and Clear All, to choose which cities are shown. Hover over a line to see the exact reading for that week.

Market Dashboard

About this chart

This dashboard summarizes the current state of the residential market for all areas and types covered by ARMLS. It is measured daily and shows where the market stands today; for longer-term trends, use the individual charts in the Analysis section.

Use Select Type of Data to switch between 14 views: Sale Price / Sq Ft, Cromford® Index, Inventory, Active Listings, Under Contract, Expired Listings, Canceled Listings, List Price / Sq Ft, Closed Listings, Dollar Volume, Days on Market, Success Rate, Square Feet, and Sale Price $.

Each tile compares a recent figure with an earlier one and is colored to show whether the change is good for sellers, bad for sellers, or neither. The chart beneath the tiles shows the last 13 months, month by month. Hover over it to see each figure.

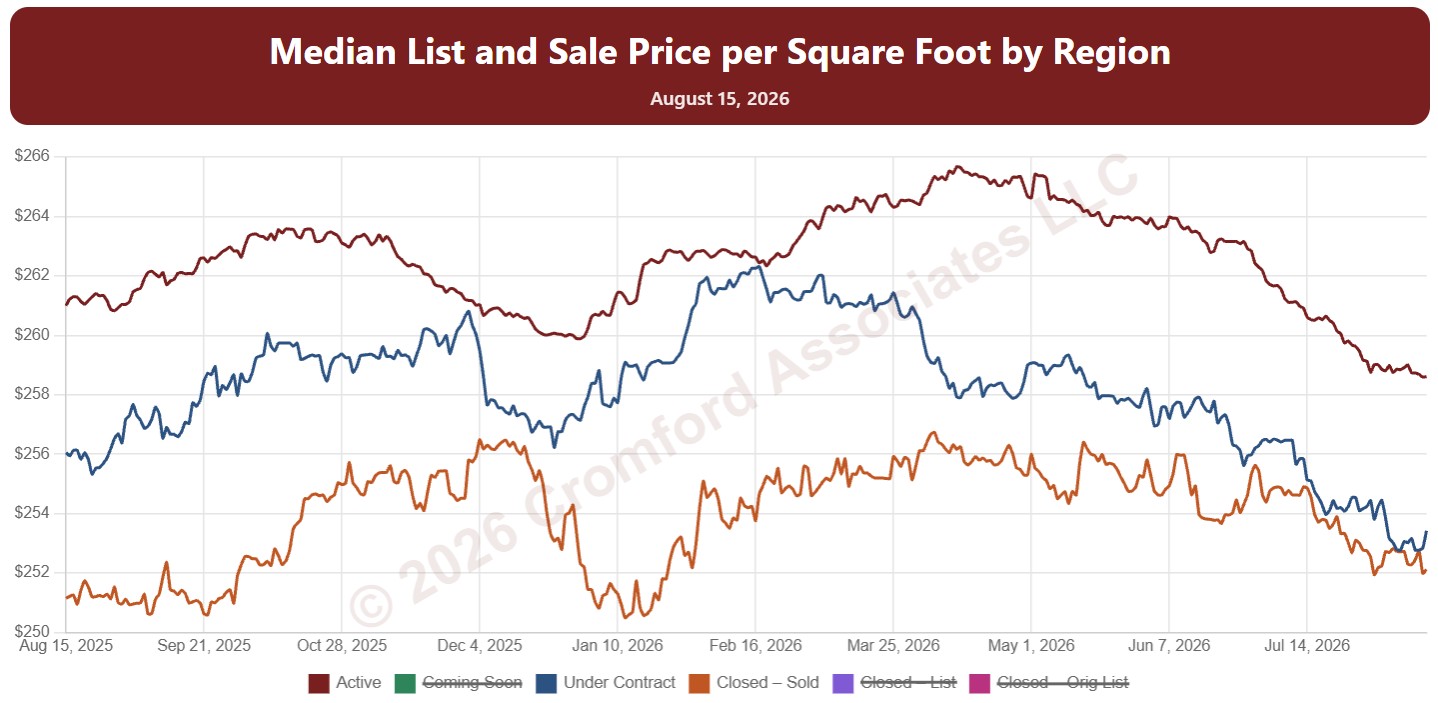
Median List Price per Square Foot by Region

About this chart

This chart shows median price per square foot every day over the last 12 months, with one line each for Active, Coming Soon, and Under Contract listings (their list prices) and three for homes that closed: the sale price, the final list price, and the original list price.

Reading the lines together shows the gap between what sellers ask and what buyers pay, and how much prices were cut along the way.

It opens with every region included. Use the Region panel to focus on one region or compare a combination of them. Narrow it with the Dwelling Type, Transaction Type, and New / Resale boxes and the list price, home size, and year built sliders.

Hover over the chart to see each figure for that day.

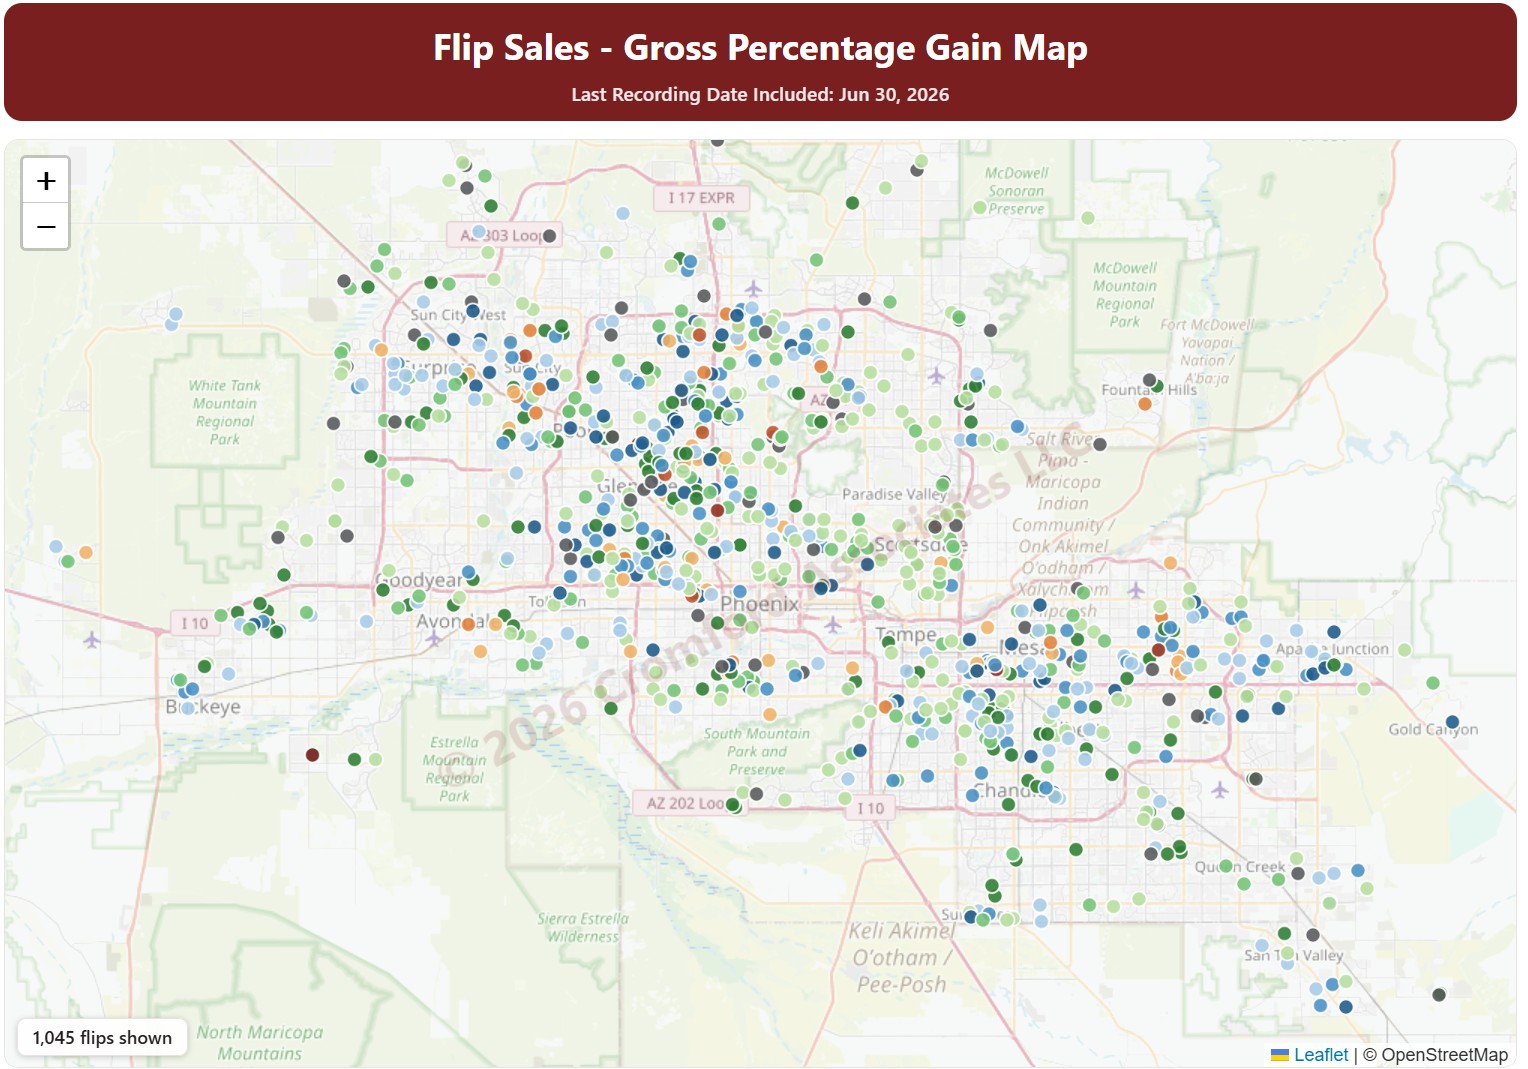
Flip Sales – Gross Percentage Gain Map

About this chart

This map shows fix-and-flip resales in Maricopa and Pinal Counties: homes bought, usually renovated, and resold by an investor. Each dot is one flip, colored by the gross percentage gain between the purchase price and the resale price.

Purchases by Opendoor and OfferPad are left out by default; tick them under Buyers to include them. Use the County, City, and ZIP Code panels and the Property Type, hold days, profit, and sales price filters to narrow the flips shown.

The Last Month, Last 3 Months, Last 6 Months, and Full range buttons, and the arrows, set the dates covered.

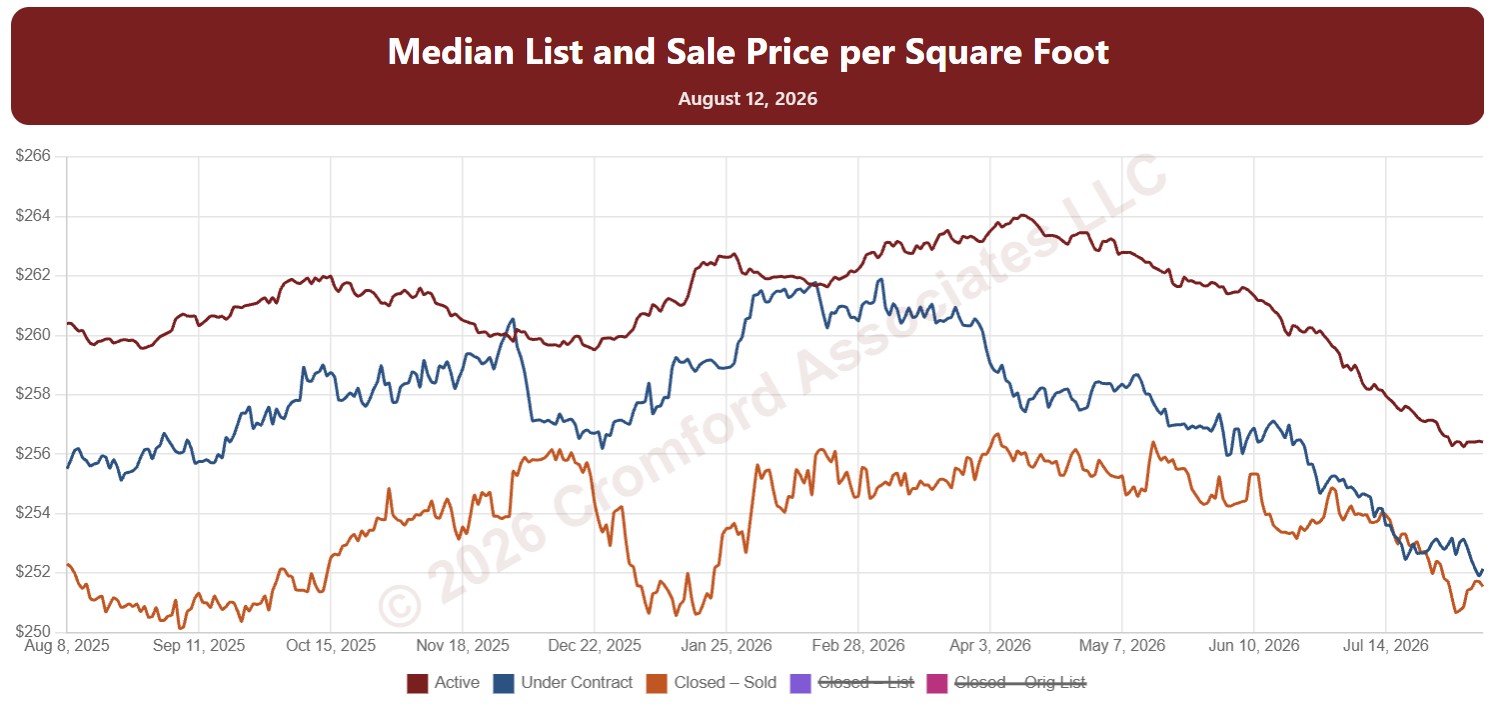
Median Price per Square Foot by City and ZIP Code

About this chart

This chart shows median price per square foot every day over the last 12 months, with one line each for Active, Coming Soon, and Under Contract listings (their list prices) and three for homes that closed: the sale price, the final list price, and the original list price.

Reading the lines together shows the gap between what sellers ask and what buyers pay, and how much prices were cut along the way.

It opens on Maricopa and Pinal Counties with every city and ZIP code included. Use the County, City, and ZIP panels to focus on any area, from a whole county down to a single ZIP code. Narrow it with the Dwelling Type, Transaction Type, and New / Resale boxes and the list price, home size, and year built sliders.

Hover over the chart to see each figure for that day.

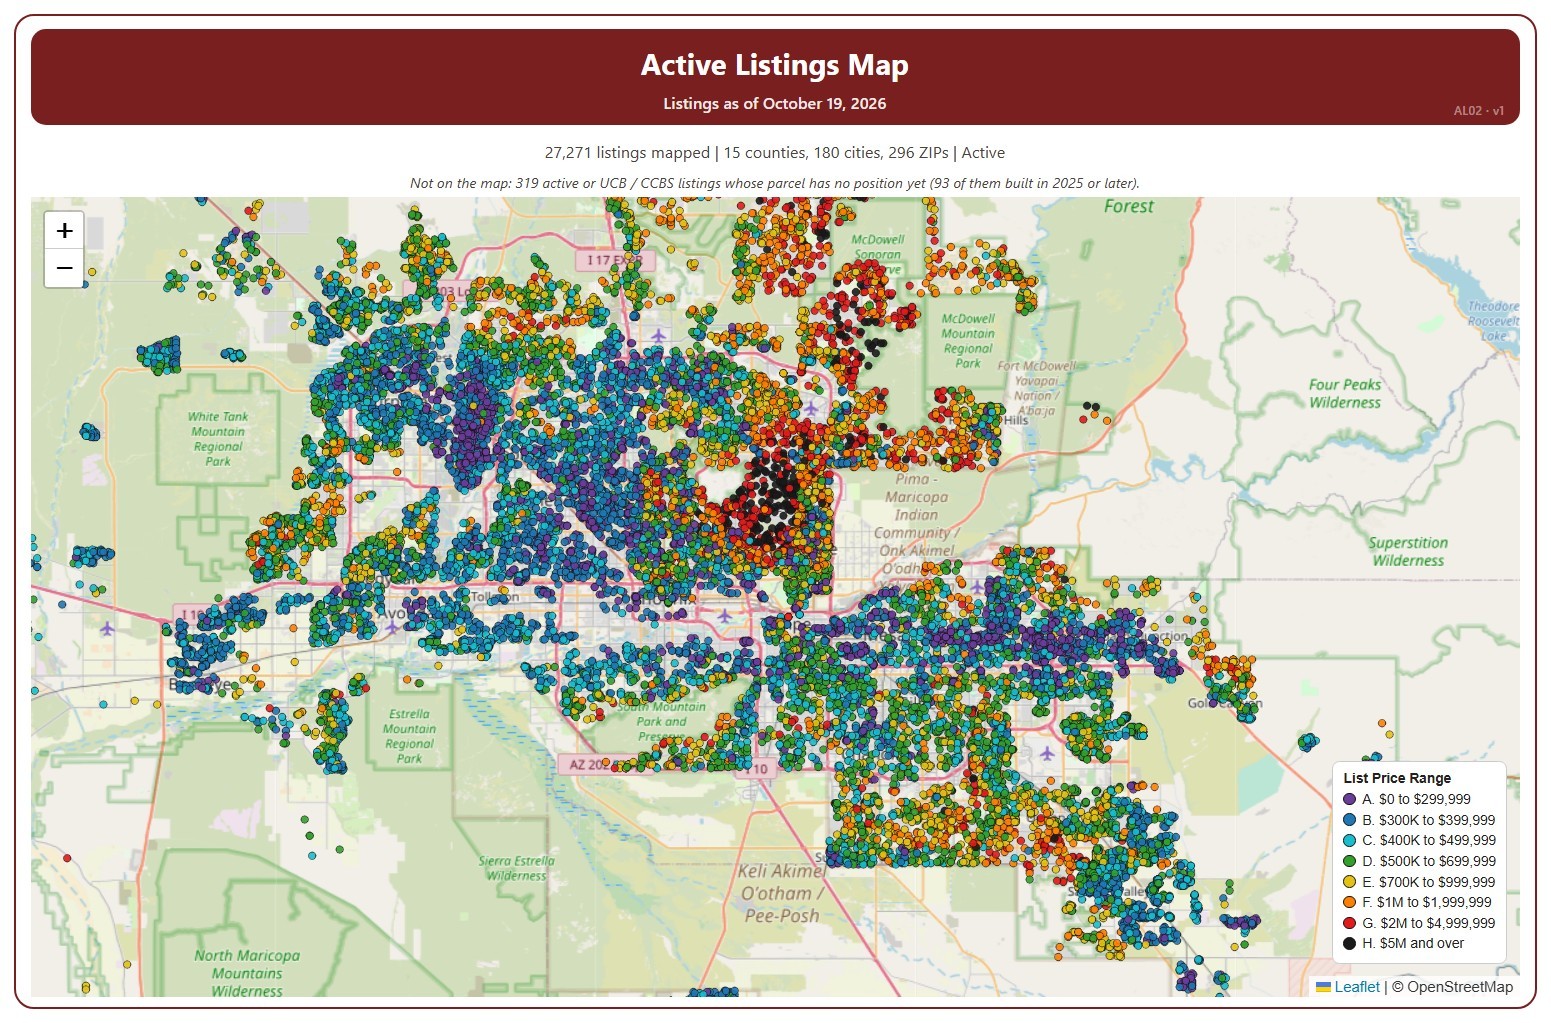
Active Listings Map

About this chart

This map shows every home listed for sale or coming soon on ARMLS across Arizona today, one dot per listing, coloured by its list price range, from A (under $300,000) to H ($5 million and over).

It opens on Active and Coming Soon listings in every county; tick UCB / CCBS in the Status box to add listings under contract with a contingency. Tick or untick counties, cities, and ZIP codes to change the area, and use the Price Range boxes to show or hide a range. The map is updated every day.

Narrow it further with the Dwelling Type, Transaction Type, and New / Resale boxes and the list price, home size, year built, and days on market sliders. A listing whose parcel has no map position yet is not shown; the note above the map says how many.

Hover over a dot to see the address, list price, status, dwelling and transaction type, size, year built, days on market, and listing office.

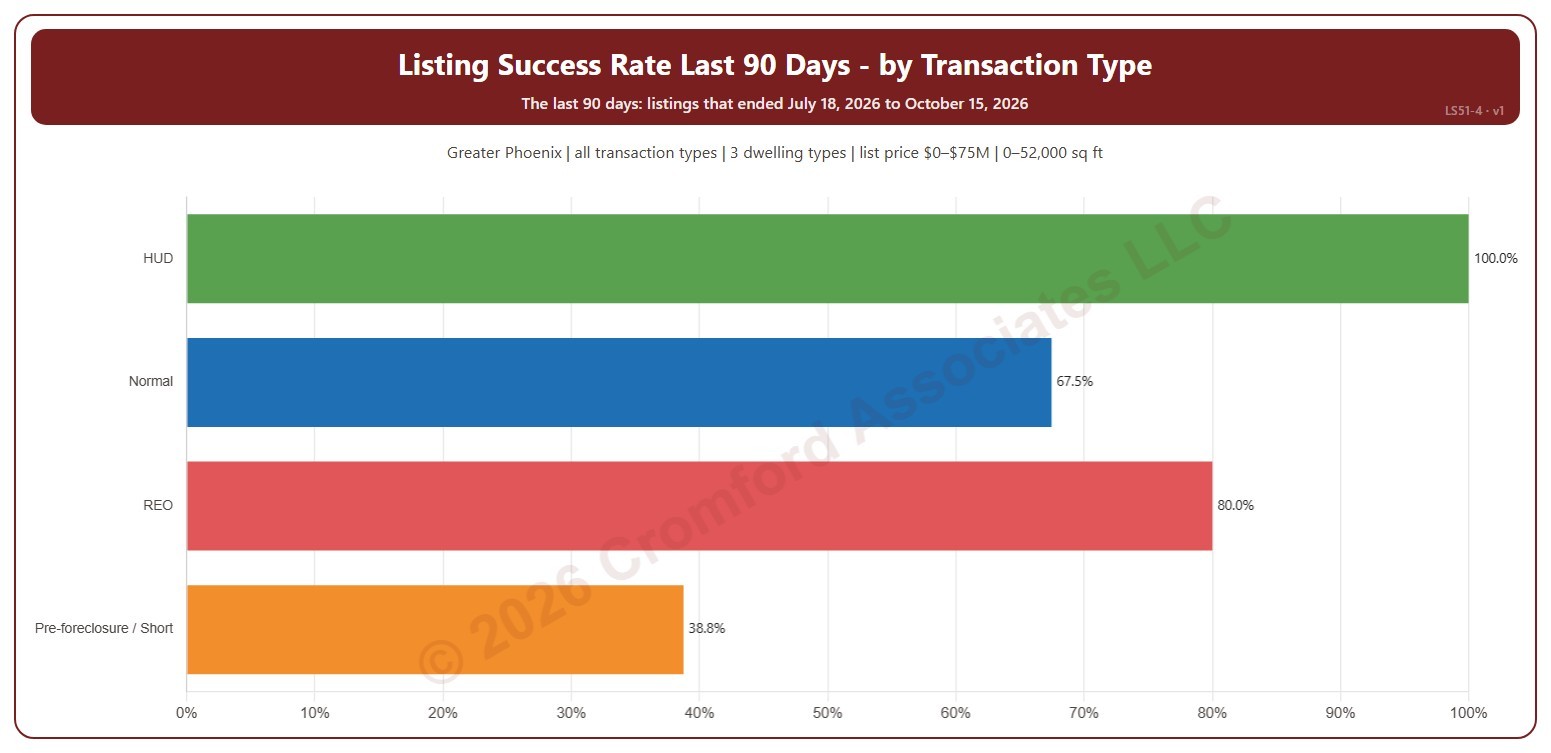
Listing Success Rate by Transaction Type

About this chart

This chart shows the listing success rate over the last 90 days for each transaction type: normal sales, REO, pre-foreclosure / short sales, and HUD. The listing success rate is the share of listings that closed, out of all the listings that ended: closed, expired, or cancelled. Each listing counts once, in the month (or window) its listing ended: the closing date for a closing, the expiration for an expired listing, the cancellation for a cancelled one.

It covers the 90 days of listings that ended up to the newest one; the heading shows the exact dates. The chart is updated every day.

It opens on the Greater Phoenix area: the counties, cities, and ZIP codes that make it up are ticked to start with. Tick or untick any of them to change the area, including counties beyond Greater Phoenix. It opens on all four transaction types; untick any to leave them out. Narrow it further with the Dwelling Type and New / Resale boxes and the list price, home size, and year built sliders.

Hover over a bar to see the rate, the listings that closed, and those that expired or were cancelled.

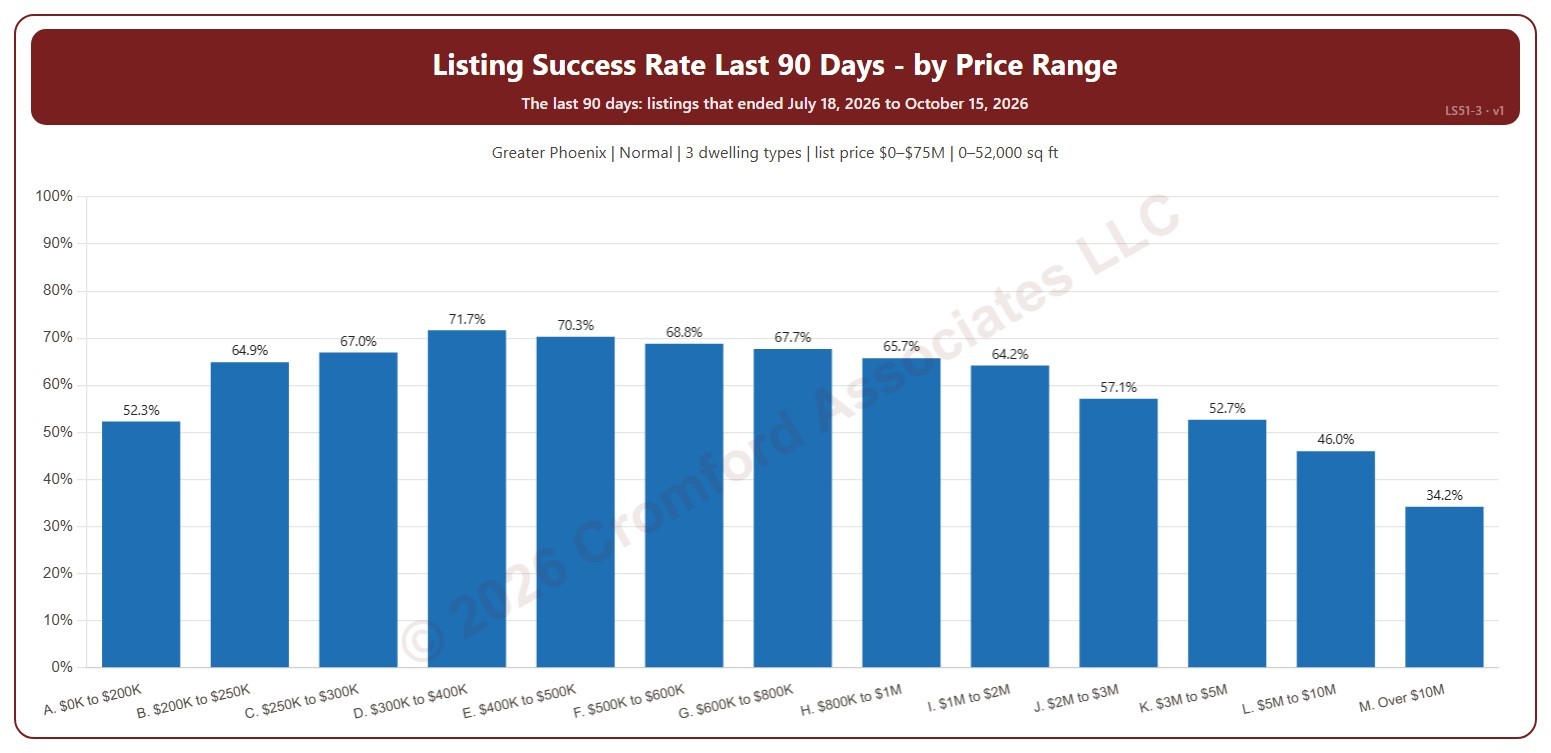
Listing Success by Price Range

About this chart

This chart shows the listing success rate over the last 90 days in each list price range, from $200K and under to over $10M. The listing success rate is the share of listings that closed, out of all the listings that ended: closed, expired, or cancelled. Each listing counts once, in the month (or window) its listing ended: the closing date for a closing, the expiration for an expired listing, the cancellation for a cancelled one.

It covers the 90 days of listings that ended up to the newest one; the heading shows the exact dates. The chart is updated every day.

It opens on the Greater Phoenix area: the counties, cities, and ZIP codes that make it up are ticked to start with. Tick or untick any of them to change the area, including counties beyond Greater Phoenix. It opens on normal sales; tick other transaction types to add them. Narrow it further with the Dwelling Type and New / Resale boxes and the list price, home size, and year built sliders.

Hover over a bar to see the rate, the listings that closed, and those that expired or were cancelled.