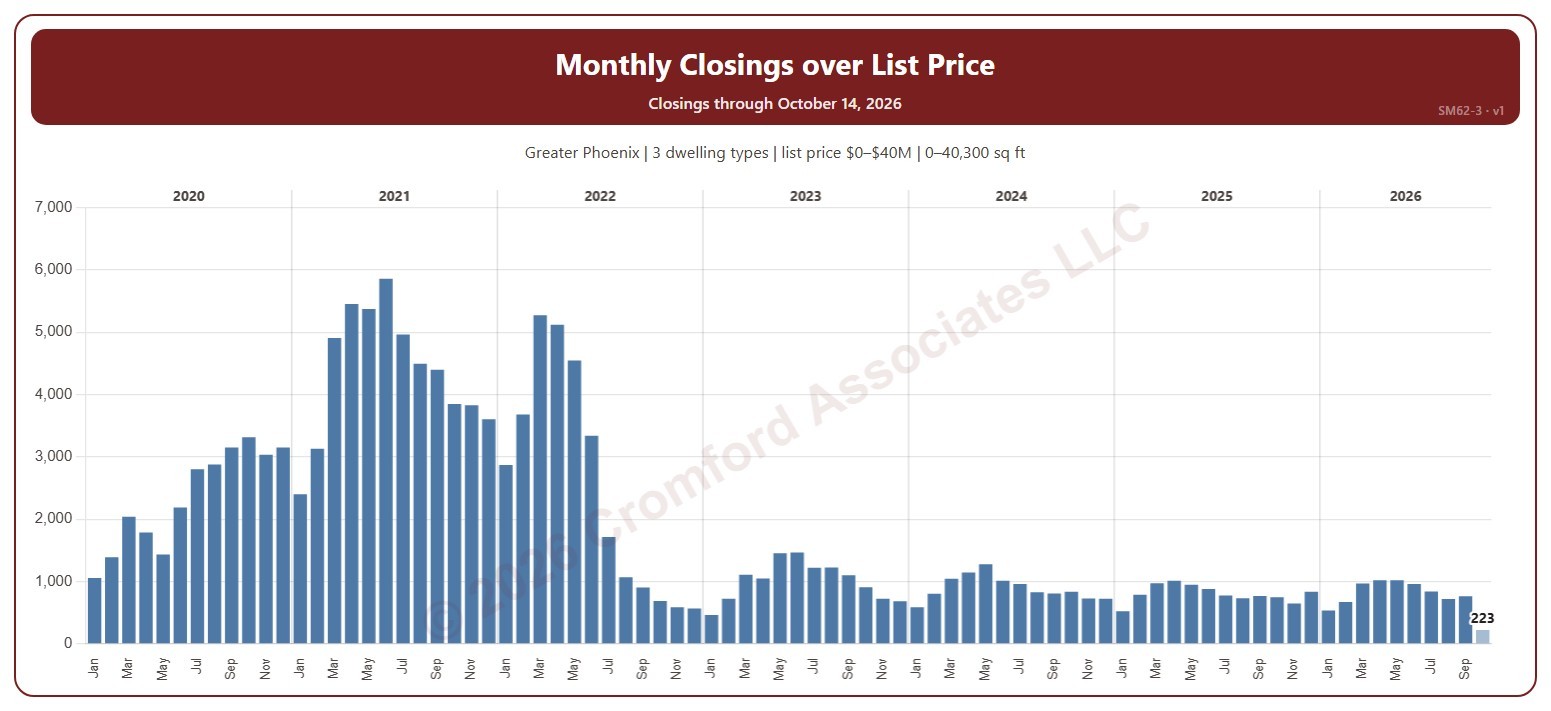
Monthly Closings over List Price

About this chart

This chart shows the number of homes that closed over list price each month. A home closed over list price when its sale price was higher than its list price on its ARMLS listing; the amount over is the sale price minus the list price.

It opens on January 2020 to date; drag the handles of the date slider under the chart to choose the months shown, as far back as January 2000. The newest month is the month so far, drawn in a lighter shade. The chart is updated every day.

It opens on the Greater Phoenix area: the counties, cities, and ZIP codes that make it up are ticked to start with. Tick or untick any of them to change the area, including counties beyond Greater Phoenix. Narrow it further with the Dwelling Type, Transaction Type, and New / Resale boxes and the list price, home size, and year built sliders.

Hover over a bar to see the number over list price, all closings, and the percentage that month.
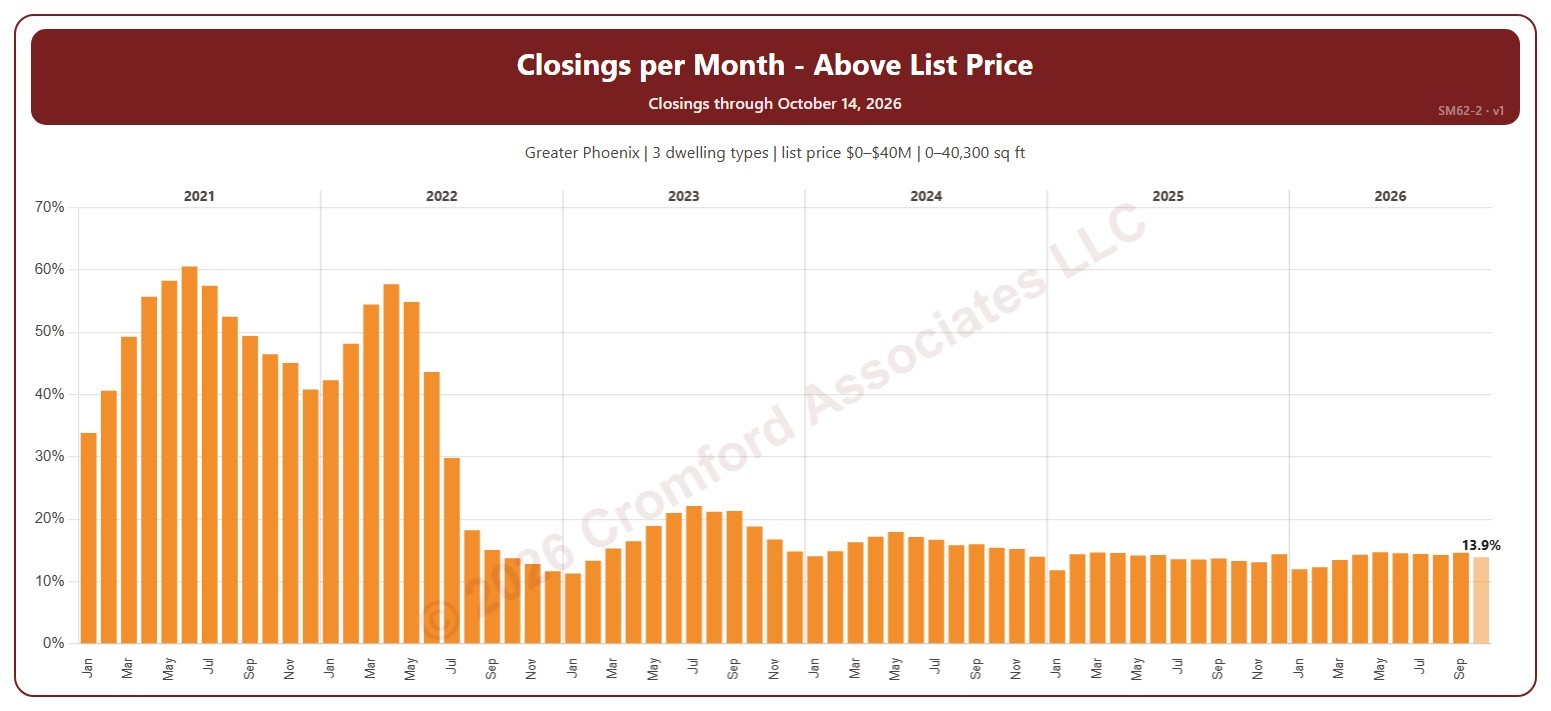
Closings per Month – Above List Price

About this chart

This chart shows the percentage of the homes closed each month that closed over list price. A home closed over list price when its sale price was higher than its list price on its ARMLS listing; the amount over is the sale price minus the list price.

It opens on January 2021 to date; drag the handles of the date slider under the chart to choose the months shown, as far back as January 2000. The newest month is the month so far, drawn in a lighter shade. The chart is updated every day.

It opens on the Greater Phoenix area: the counties, cities, and ZIP codes that make it up are ticked to start with. Tick or untick any of them to change the area, including counties beyond Greater Phoenix. Narrow it further with the Dwelling Type, Transaction Type, and New / Resale boxes and the list price, home size, and year built sliders.

Hover over a bar to see the percentage, the number over list price, and all closings that month.

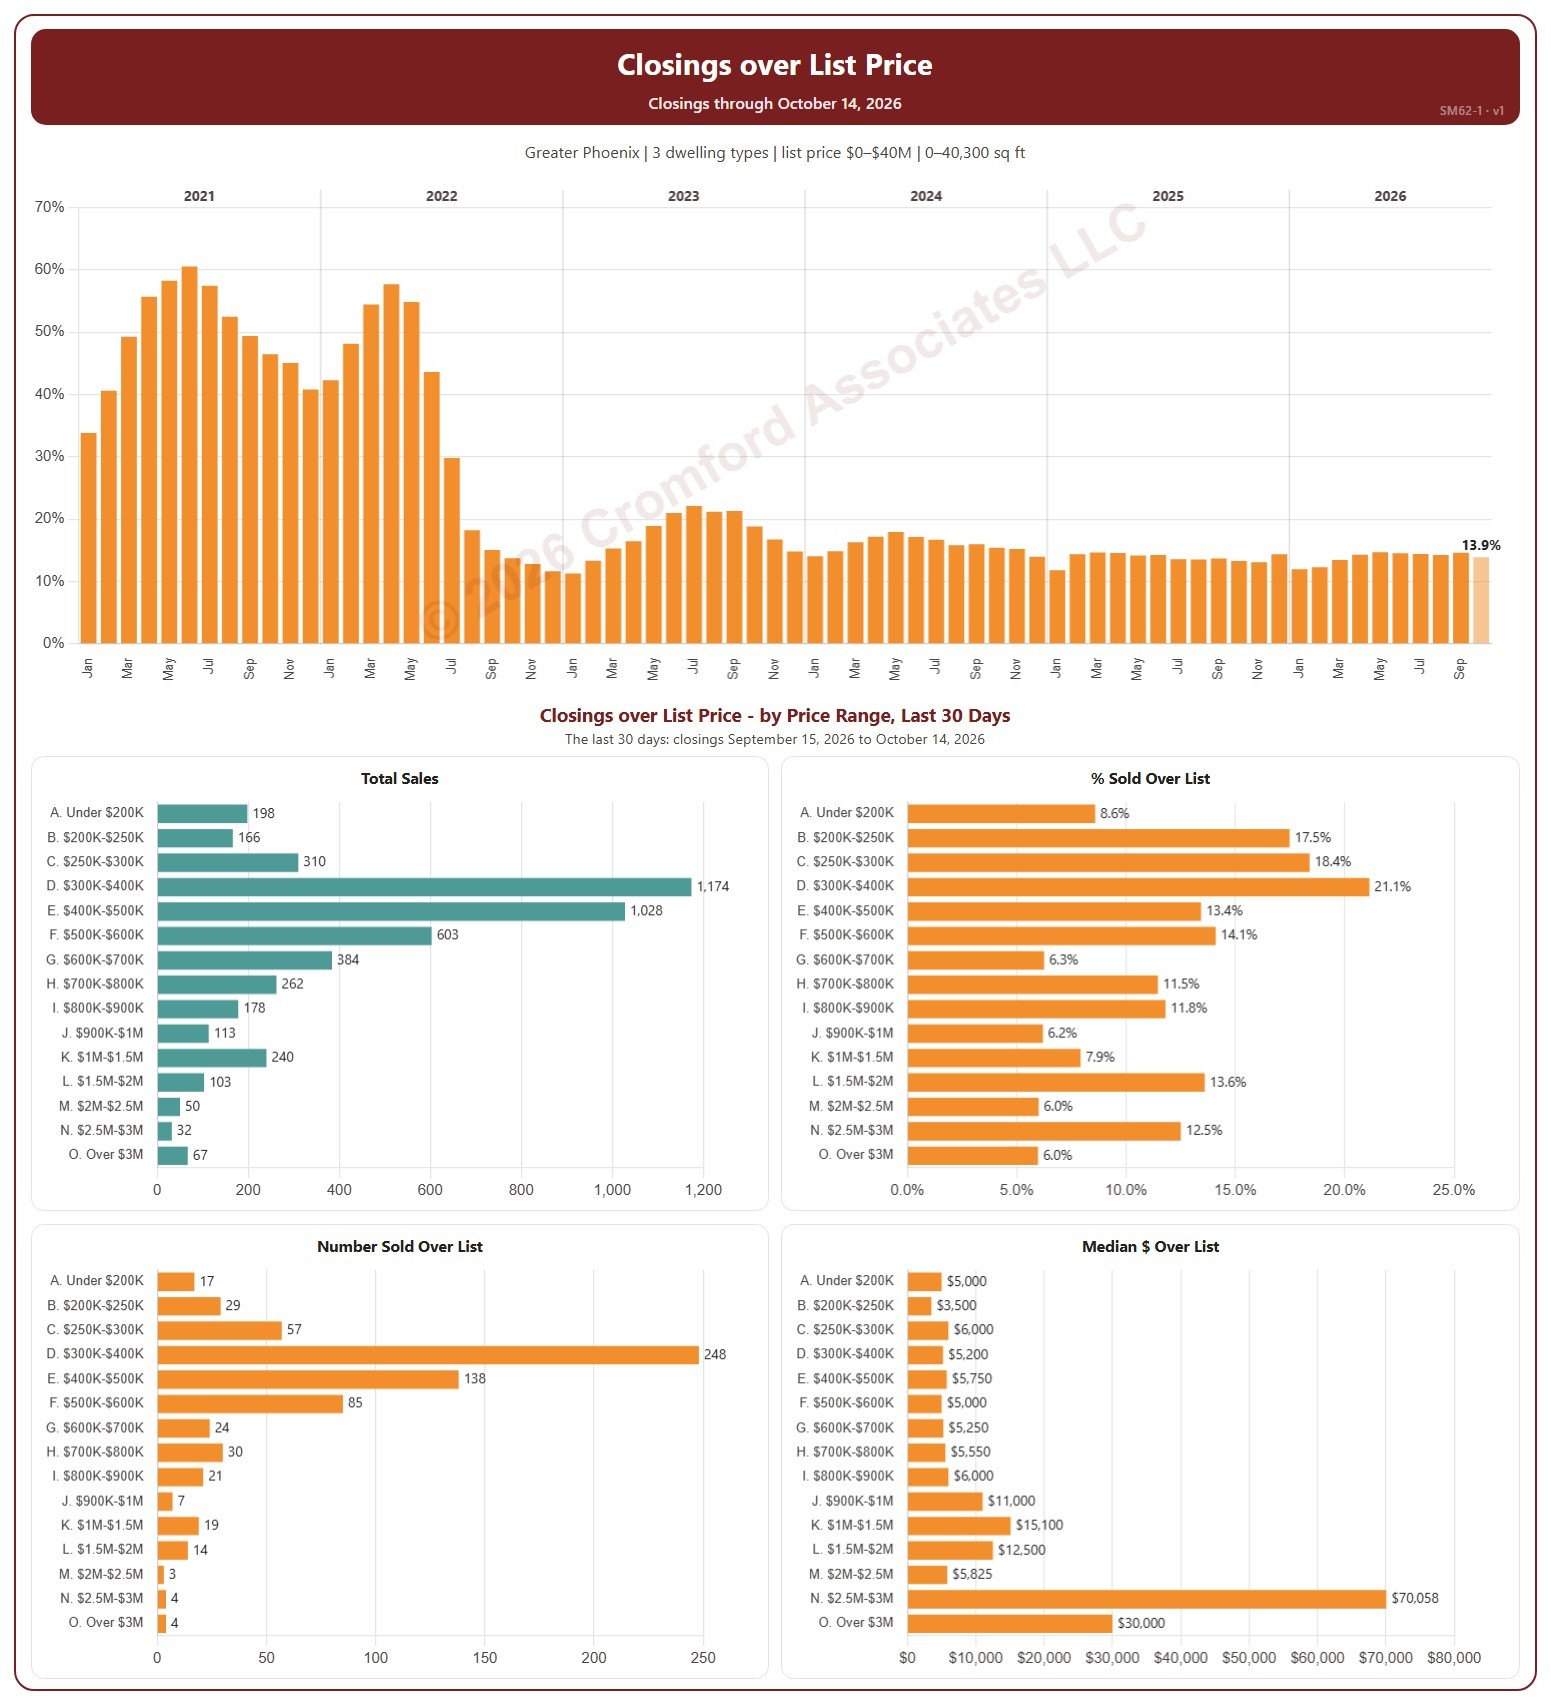
Closings over List Price

About this chart

This dashboard shows how many homes closed over their list price. The top chart shows the percentage of each month’s closings that were over list price. Under it, four charts break the last 30 days of closings down by list price range, from under $200K to over $3M: all closings, the percentage over list price, the number over list price, and the median amount over list price. A home closed over list price when its sale price was higher than its list price on its ARMLS listing; the amount over is the sale price minus the list price.

It opens on January 2021 to date; drag the handles of the date slider under the chart to choose the months shown, as far back as January 2000. The newest month is the month so far, drawn in a lighter shade. The chart is updated every day. The 30 days run up to the newest closing; the heading shows the exact dates. A price range with only a few closings over list price can show an unusual median.

It opens on the Greater Phoenix area: the counties, cities, and ZIP codes that make it up are ticked to start with. Tick or untick any of them to change the area, including counties beyond Greater Phoenix. Narrow it further with the Dwelling Type, Transaction Type, and New / Resale boxes and the list price, home size, and year built sliders.

Hover over a bar to see its figures.

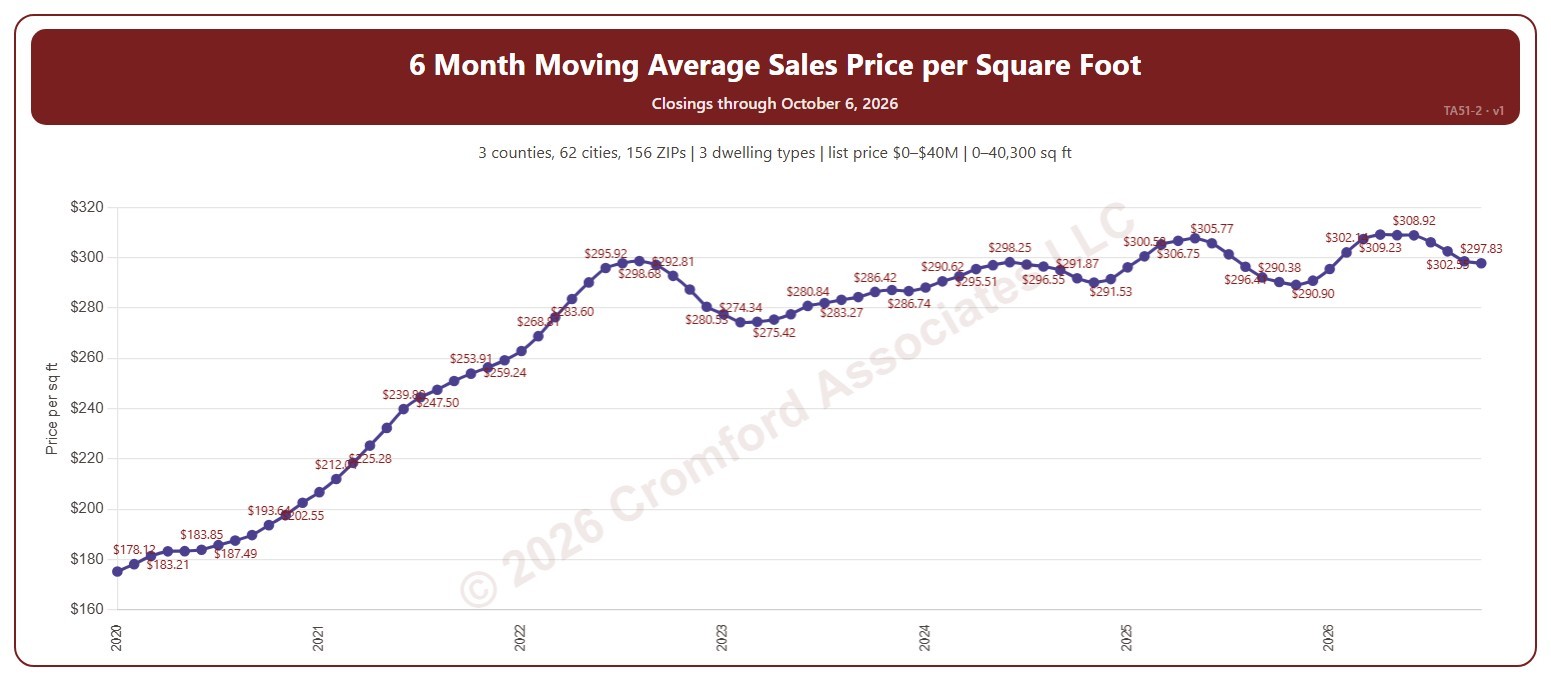
6 Month Moving Average Sales Price per Square Foot

About this chart

This chart shows the average sales price per square foot of the homes that closed through ARMLS over the 6 months ending with each calendar month: a 6-month moving average, across all the square feet sold. Price per square foot lets you compare homes of different sizes. The 6-month average balances responsiveness against noise.

It opens on the years since 2020; tick any year back to 2000 in the Year panel. The newest month is the month so far.

It opens on the Greater Phoenix area: the counties, cities, and ZIP codes that make it up are ticked to start with. Tick or untick any of them to change the area, including counties beyond Greater Phoenix. Narrow it further with the Dwelling Type (condo, mobile, single family), Transaction Type, and New / Resale boxes and the list price, home size, and year built sliders.

Hover over the chart to see the figures for that month.

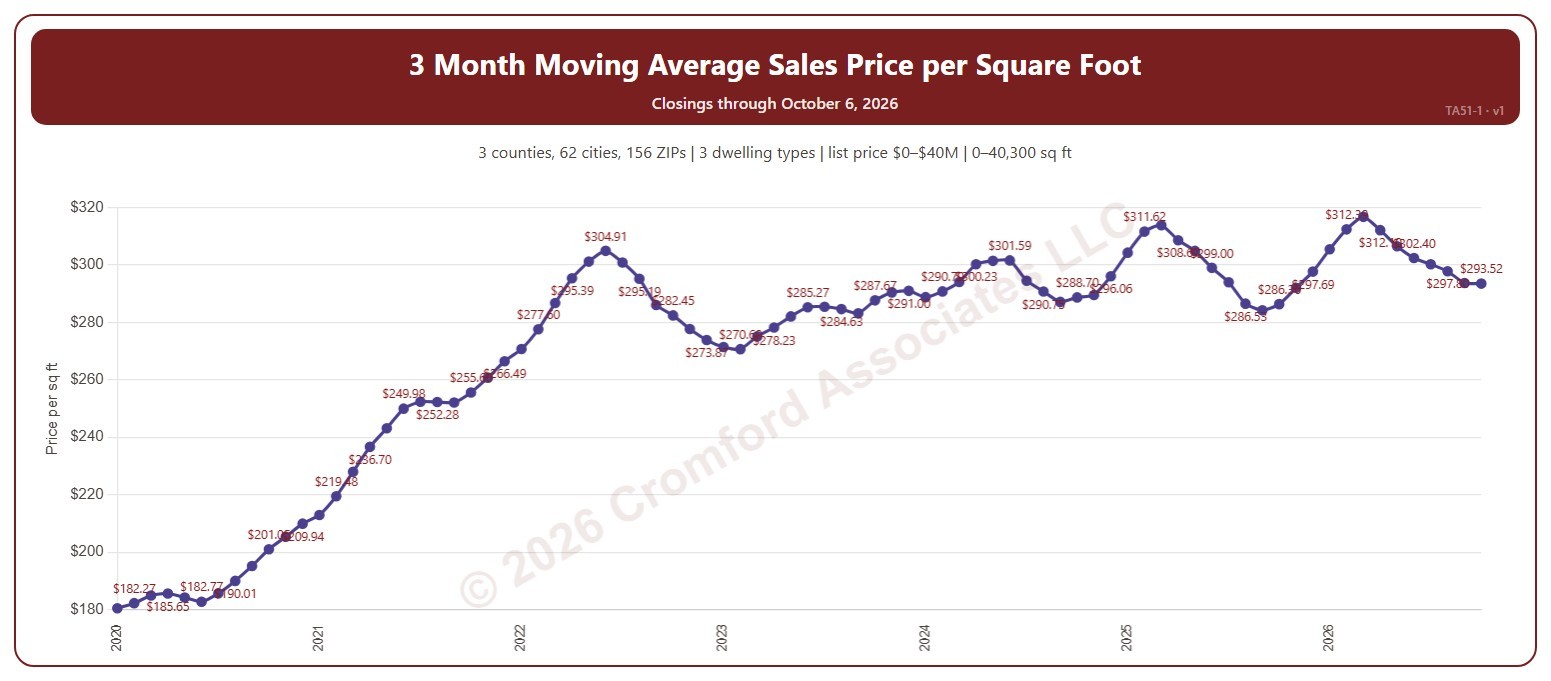
3 Month Moving Average Sales Price per Square Foot

About this chart

This chart shows the average sales price per square foot of the homes that closed through ARMLS over the 3 months ending with each calendar month: a 3-month moving average, across all the square feet sold. Price per square foot lets you compare homes of different sizes. The 3-month average reacts quickly to changes in price.

It opens on the years since 2020; tick any year back to 2000 in the Year panel. The newest month is the month so far.

It opens on the Greater Phoenix area: the counties, cities, and ZIP codes that make it up are ticked to start with. Tick or untick any of them to change the area, including counties beyond Greater Phoenix. Narrow it further with the Dwelling Type (condo, mobile, single family), Transaction Type, and New / Resale boxes and the list price, home size, and year built sliders.

Hover over the chart to see the figures for that month.

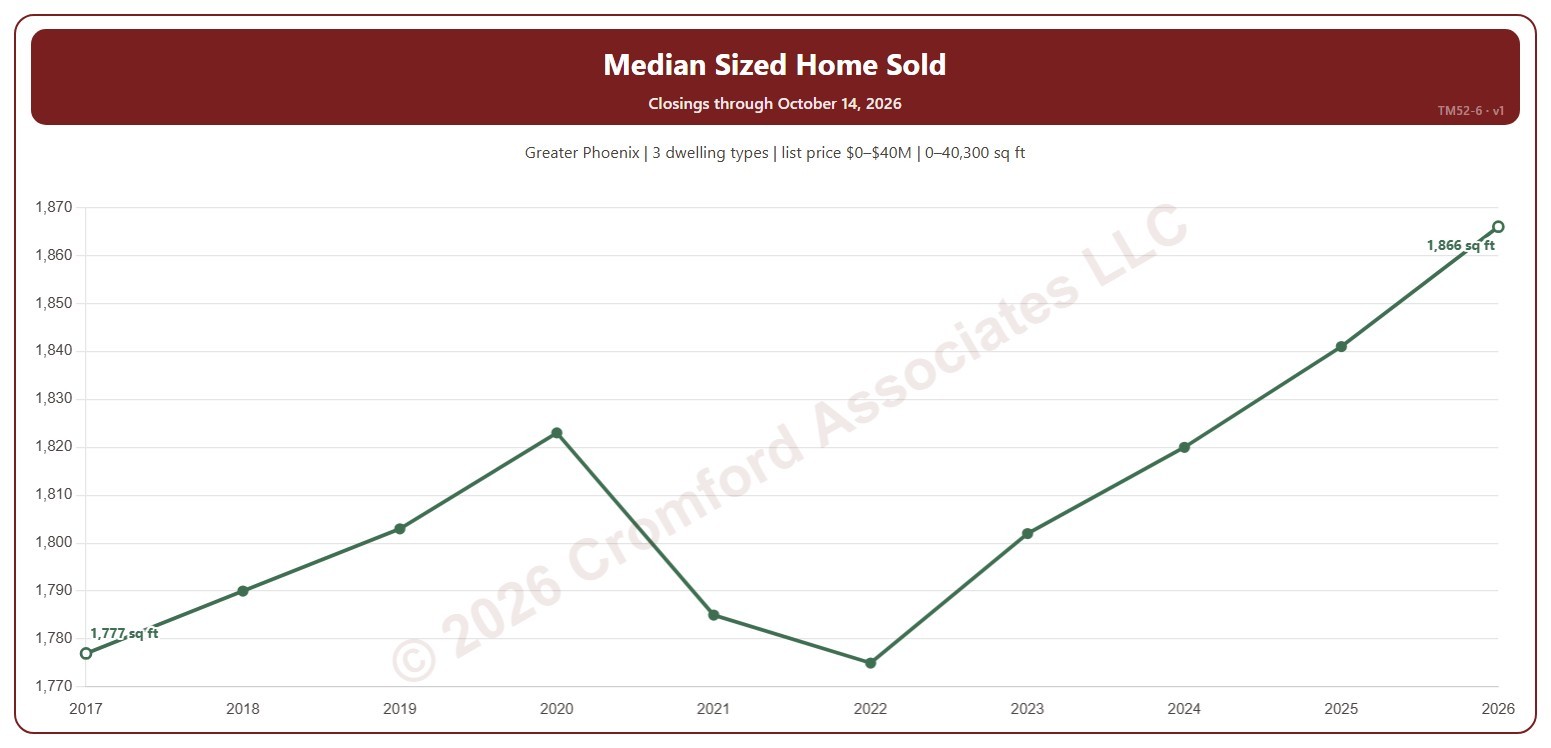
Median-Sized Home Sold

About this chart

This chart shows the median size, in square feet, of the homes that closed on ARMLS each year: half were larger and half smaller. The newest year is the year so far.

It opens on January 2017 to date; drag the handles of the date slider under the chart to choose the years shown, as far back as 2000. The chart is updated every day.

It opens on the Greater Phoenix area: the counties, cities, and ZIP codes that make it up are ticked to start with. Tick or untick any of them to change the area, including counties beyond Greater Phoenix. Narrow it further with the Dwelling Type, Transaction Type, and New / Resale boxes and the list price, home size, and year built sliders.

Hover over the line to see the median size and the number of closings that year.

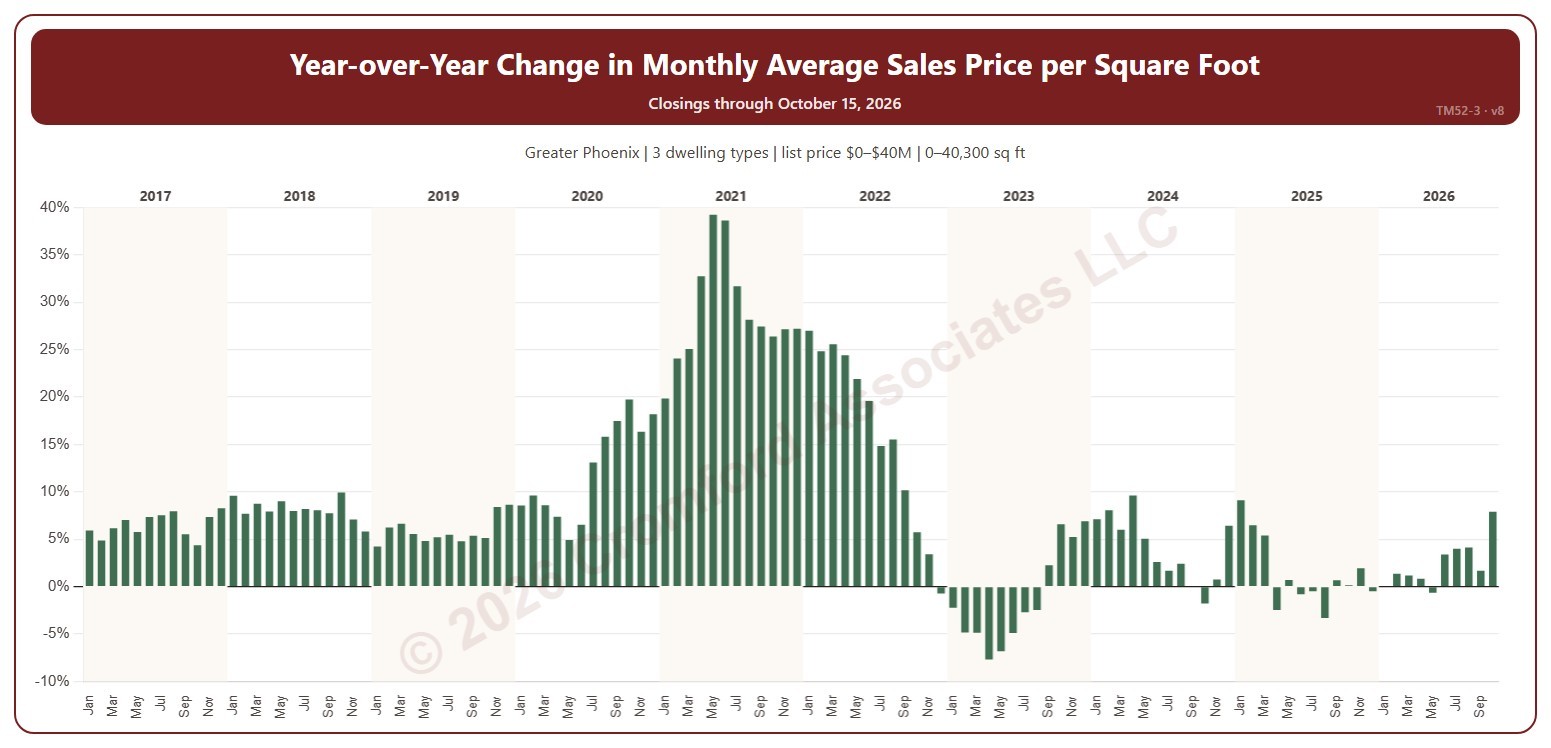
Year-over-Year Change: Monthly Average Sales Price per Square Foot

About this chart

This chart shows the year-over-year change in the average sales price per square foot: each month compared with the same month a year earlier, as a percentage. Sales price per square foot is the total of the sale prices divided by the total of the homes’ square footage, over the homes that closed on ARMLS in the period.

It opens on January 2017 to date; drag the handles of the date slider under the chart to choose the months shown, as far back as January 2001. The chart is updated every day.

It opens on the Greater Phoenix area: the counties, cities, and ZIP codes that make it up are ticked to start with. Tick or untick any of them to change the area, including counties beyond Greater Phoenix. Narrow it further with the Dwelling Type, Transaction Type, and New / Resale boxes and the list price, home size, and year built sliders.

Hover over a bar to see the change and both months’ figures.

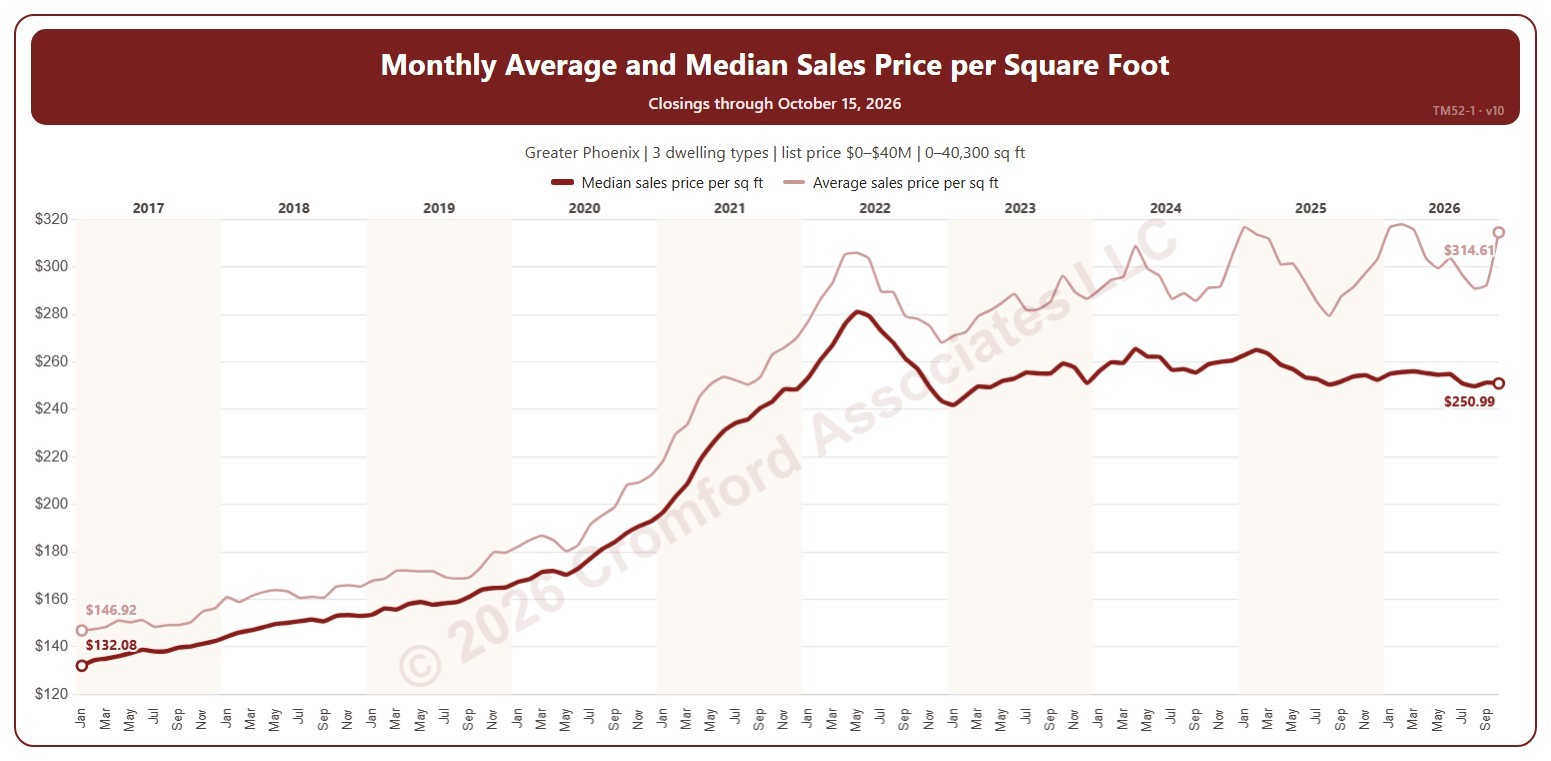
Monthly Average and Median Sales Price per Square Foot – Long Term

About this chart

This chart shows the average sales price per square foot of the homes that closed each month. Sales price per square foot is the total of the sale prices divided by the total of the homes’ square footage, over the homes that closed on ARMLS in the period.

It opens on January 2017 to date; drag the handles of the date slider under the chart to choose the months shown, as far back as January 2000. The chart is updated every day. The newest month is the month so far.

It opens on the Greater Phoenix area: the counties, cities, and ZIP codes that make it up are ticked to start with. Tick or untick any of them to change the area, including counties beyond Greater Phoenix. Narrow it further with the Dwelling Type, Transaction Type, and New / Resale boxes and the list price, home size, and year built sliders.

Hover over the line to see the figure and the number of closings for that month.

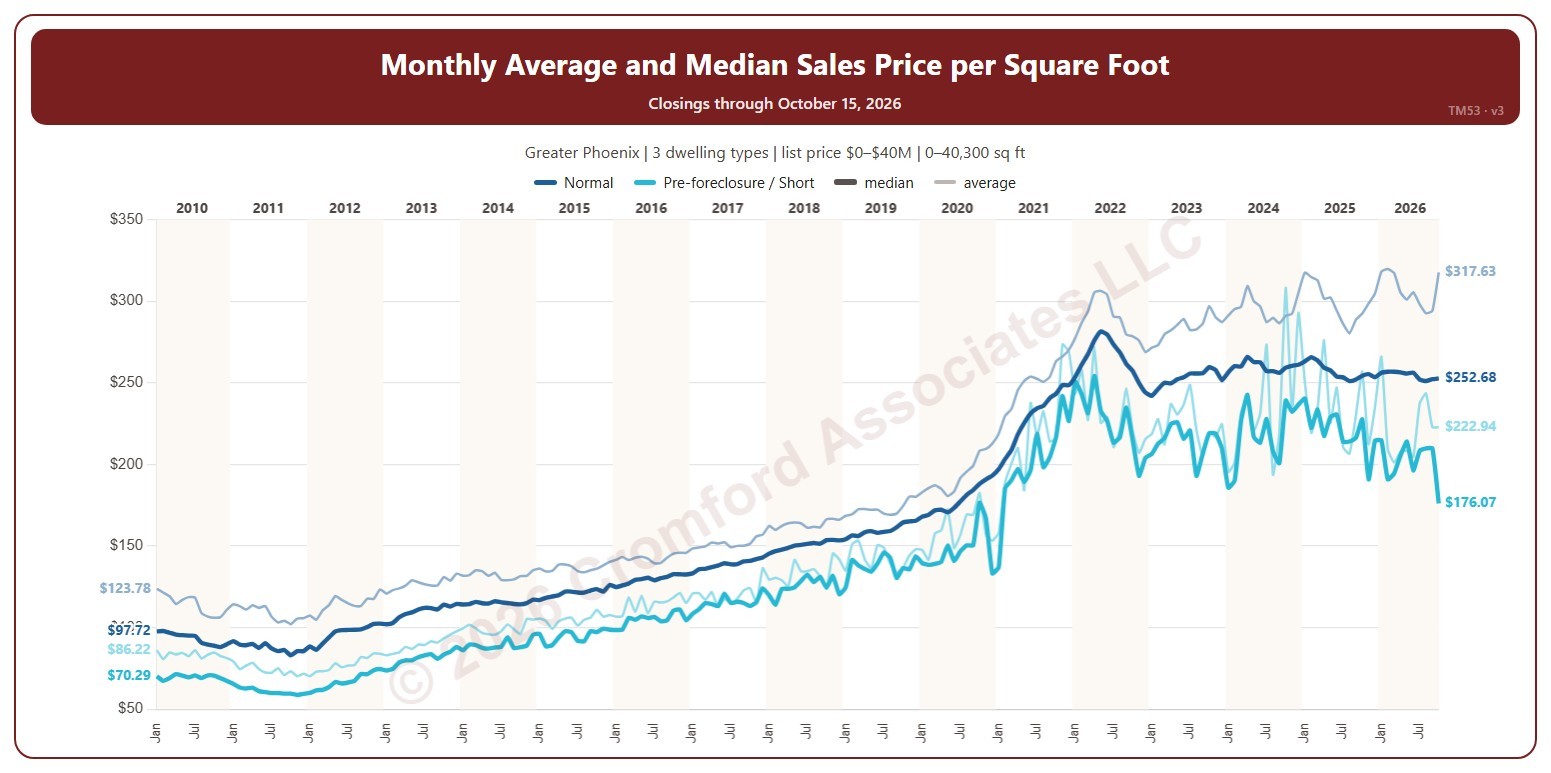
Monthly Average and Median Sales Price per Square Foot

About this chart

This chart shows the average sales price per square foot of the homes that closed on ARMLS each month, a line per transaction type: the total of the sale prices divided by the total of the homes’ square footage. It opens on normal sales and pre-foreclosure / short sales; tick REO or HUD in the Transaction Type box to add their lines.

It opens on January 2010 to date; drag the handles of the date slider under the chart to choose the months shown, as far back as January 2000. The newest month is the month so far. A transaction type with only a few closings in a month can swing widely. The chart is updated every day.

It opens on the Greater Phoenix area: the counties, cities, and ZIP codes that make it up are ticked to start with. Tick or untick any of them to change the area, including counties beyond Greater Phoenix. Narrow it further with the Dwelling Type and New / Resale boxes and the list price, home size, and year built sliders.

Hover over the chart to see each line’s figure and number of closings that month.