Cromford® Price Index by City – Daily – Recorded Sales

About this chart

The Cromford® Price Index measures how much home prices have changed compared with the same point a year earlier, for comparable homes. This version is built from every home sale recorded in Maricopa and Pinal Counties, including sales that never went through the MLS, rather than from ARMLS closings. It is measured every day, and each point covers the sales recorded in the month up to that day. Above zero, prices are higher than a year ago; below zero, they are lower.

Recordings take a few days to be loaded, and one county can run behind the other, so the chart stops three days before the newest recording loaded for both counties. That usually puts it one to two weeks behind the ARMLS version (PICT01).

Unlike the median sales price or the median price per square foot, the index is not moved by changes in which homes happen to sell. A month in which more large homes sell, or more small ones, does not show up as a rise or fall in prices. It counts resales only: a new home’s first sale is left out, so every year compares the same kind of sale.

To keep every figure reliable, a point is shown only where at least 100 homes sold in the month and in the same month a year earlier. For the same reason the County and City lists offer only the areas that reached 100 sales in every month of the last two years, and smaller cities are grouped as Other cities in their county. Dwelling Type offers Single Family and Other, which covers every other kind of home.

Each year has its own line, laid out by day of the year, so you can compare this year with earlier years at the same point in the season. It opens on both counties and the last three years; tick any year back to 2002 in the Year panel. The Inflation (CPI) option compares prices in today’s dollars, using national or Phoenix inflation. Hover over a line to see the figure for that day and the number of sales behind it.

Cromford® Price Index by City – Daily

About this chart

The Cromford® Price Index measures how much home prices have changed compared with the same point a year earlier, for comparable homes. This version is measured every day, and each point covers the homes that closed in the month up to that day, so it shows a change in direction within weeks. The S&P CoreLogic Case-Shiller index covers three months and is published two months later. Above zero, prices are higher than a year ago; below zero, they are lower.

Unlike the median sales price or the median price per square foot, the index is not moved by changes in which homes happen to sell. A month in which more large homes sell, or more small ones, does not show up as a rise or fall in prices.

To keep every figure reliable, a point is shown only where at least 100 homes closed in the month and in the same month a year earlier. For the same reason the County and City lists offer only the areas that reached 100 closings in every month of the last two years, and smaller cities are grouped as Other cities in their county. Dwelling Type offers Single Family and Other, which covers every other kind of home. For a smaller area, use the 12-month version (PICZ01) or the 3-month version (PICZ03).

Each year has its own line, laid out by day of the year, so you can compare this year with earlier years at the same point in the season. It opens on Maricopa and Pinal Counties and the last three years; tick any year back to 2002 in the Year panel. It counts resales only: a new home’s first sale is left out, so every year compares the same kind of sale. The Inflation (CPI) option compares prices in today’s dollars, using national or Phoenix inflation.

It is updated every day and runs to the last day whose closings are fully in. Hover over a line to see the figure for that day and the number of sales behind it.

Sales Price per Square Foot Against the 2001-2004 Trend and 4% and 5% a Year

About this chart

This chart compares the sales price per square foot of 1,500 to 2,000 sq ft homes that closed each month since January 2001 with four lines that show where prices would be at a steady rate of growth. The median is the middle of each home’s sale price divided by its square footage. The average is the total of the sale prices divided by the total of the square footage. Prices are not adjusted for inflation.

The 2001-2004 trend takes the rate that best fits the monthly figures from January 2001 through December 2004 and carries it forward to today. The 2001-2003 trend does the same through December 2003. Both are shown because prices began to climb much faster in 2004, which lifts the 2001-2004 rate well above the 2001-2003 rate. The 5% and 4% lines grow at those rates each year from the same January 2001 figure as the 2001-2004 trend.

Lines from chooses whether the trend and rate lines are fitted to the median or the average; it opens on the median. The rates are worked out for the homes selected, so they change with the filters, and the legend shows the current ones. If the filters leave too few closings in 2001-2004, the lines are not drawn. The date slider under the chart changes the months shown, not the rates.

It opens on the Greater Phoenix area: the counties, cities, and ZIP codes that make it up are ticked to start with. Tick or untick any of them to change the area, including counties beyond Greater Phoenix. Use the home size slider to choose another size, and narrow it further with the Dwelling Type, Transaction Type, and New / Resale boxes and the list price and year built sliders.

It shows complete months only and is updated every day. Click a line in the legend to hide or show it. Hover over the chart to see each line’s figure and the number of closings for that month. Press Ctrl and point at the chart to mark the same month in every year; press Ctrl again to clear.

6 Month Rolling Median Sales Price

About this chart

This chart shows the median sales price over six months, month by month: each point is the median of every closing in that month and the five months before it. The median sales price is the middle sale price of the homes that closed on ARMLS in the period: half sold for more and half for less. New homes are included. EM52-1 shows the median for each single month.

It opens on January 2021 to date; drag the handles of the date slider under the chart to choose the months shown, as far back as June 2000. The newest month counts its closings so far. The chart is updated every day.

It opens on the Greater Phoenix area: the counties, cities, and ZIP codes that make it up are ticked to start with. Tick or untick any of them to change the area, including counties beyond Greater Phoenix. Narrow it further with the Dwelling Type, Transaction Type, and New / Resale boxes and the list price, home size, and year built sliders.

Hover over the line to see the six months counted, the median, the lowest and highest sale, and the number of closings. Press Ctrl and point at the line to mark the same month in every year; press Ctrl again to clear.

Median Sales Price Map by Region

About this chart

This map colors each region by the median sales price of its closings over the time frame chosen, in 14 price ranges. Every ZIP code in a region takes the region’s color, so each region reads as one block, with its boundary drawn over it. A ZIP code in two regions is striped in both regions’ colors. The median sales price is the middle sale price of the homes that closed on ARMLS in the period: half sold for more and half for less. New homes are included. EM52-6 shows the same map by ZIP code.

It opens on the last 3 months to the newest closing, zoomed to the Greater Phoenix regions; use the Time Frame buttons over the map for the last day, week, month, 3 months, year, or 5 years. Click a price range in the legend to hide or show it. The map is updated every day.

It opens on the eight Greater Phoenix regions, every ZIP code in them. Use the Region boxes to pick any of the 19 regions: the eight Greater Phoenix regions and the eleven Rest of Arizona regions, from Tucson to the White Mountains. A ZIP code in two regions counts in both. Other areas (unticked to start with) adds the ZIP codes that are in no region. Some Rest of Arizona regions have few closings on ARMLS, so their medians can swing. Changing the County, City, or ZIP boxes limits the map to the areas ticked there as well. Narrow it further with the Dwelling Type, Transaction Type, and New / Resale boxes and the list price, home size, and year built sliders. Tick a Rest of Arizona region and zoom out to see it.

Hover over a ZIP code to light up its region and see the region’s median, its number of closings, and its price range.

Closings over List Price by ZIP Code

About this chart

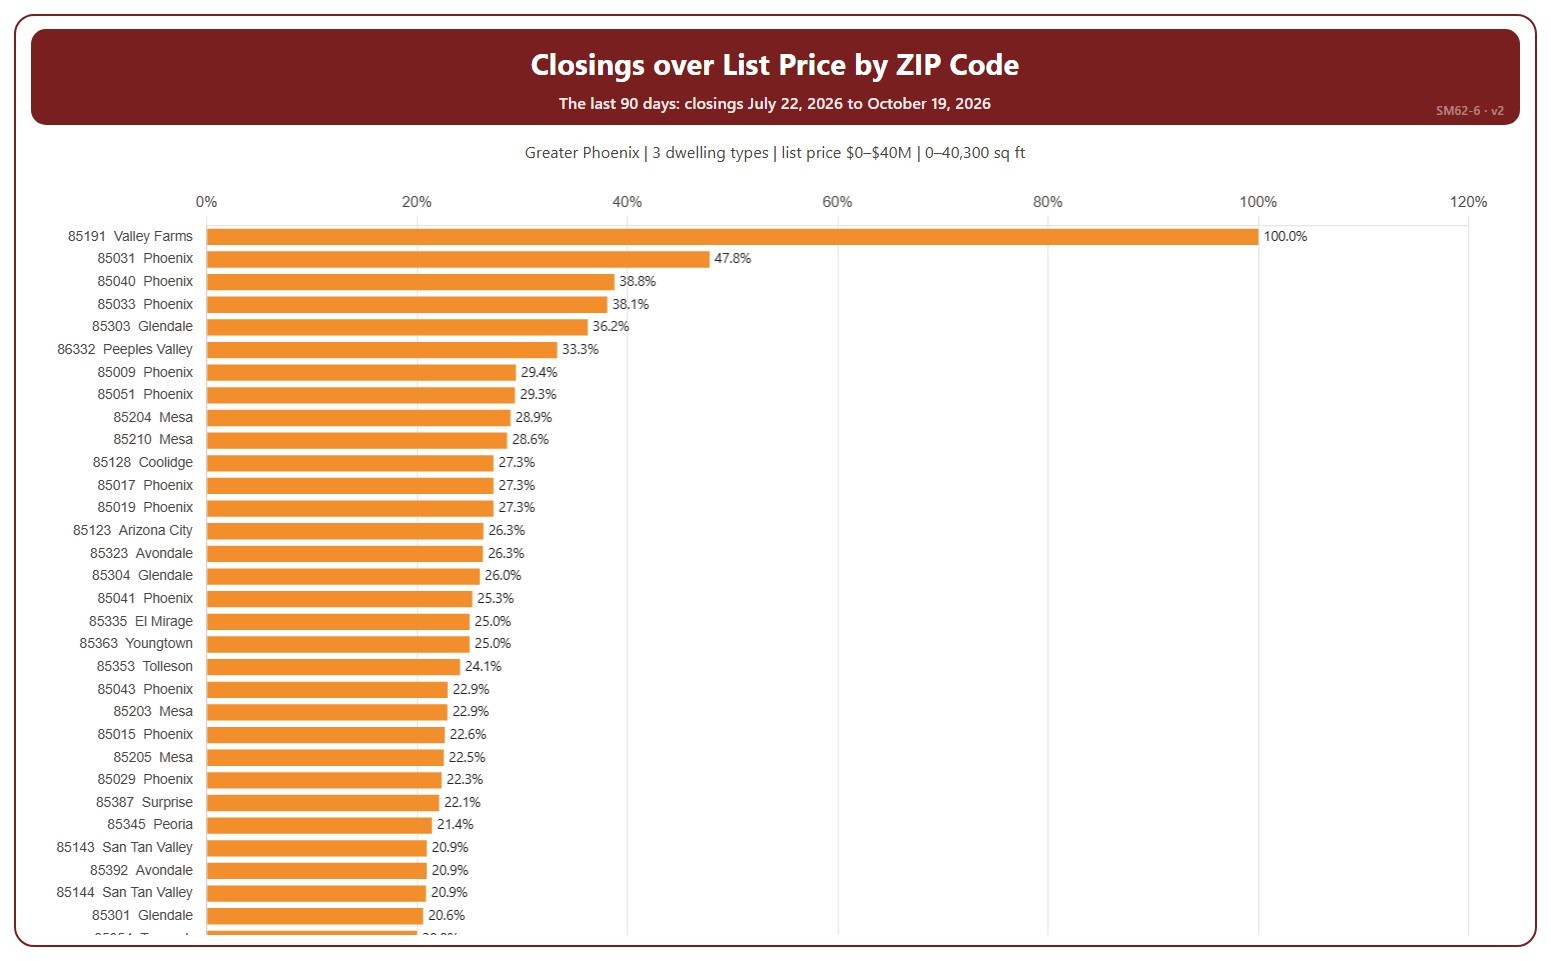
This chart ranks ZIP codes by the percentage of their closings that closed over list price in the last 90 days, highest first. Each ZIP code is shown with the city most of its closings are in. A home closed over list price when its sale price was higher than its list price on its ARMLS listing; the amount over is the sale price minus the list price. A ZIP code with only a few closings can show 0% or 100%.

It covers the 90 days of closings up to the newest one; the heading shows the exact dates. Scroll inside the chart to see every ZIP code; a printed copy runs over as many pages as it needs. The chart is updated every day.

It opens on the Greater Phoenix area: the counties, cities, and ZIP codes that make it up are ticked to start with. Tick or untick any of them to change the area, including counties beyond Greater Phoenix. Narrow it further with the Dwelling Type, Transaction Type, and New / Resale boxes and the list price, home size, and year built sliders.

Hover over a bar to see the percentage, the number over list price, and all closings in that ZIP code.

Closings over List Price by City

About this chart

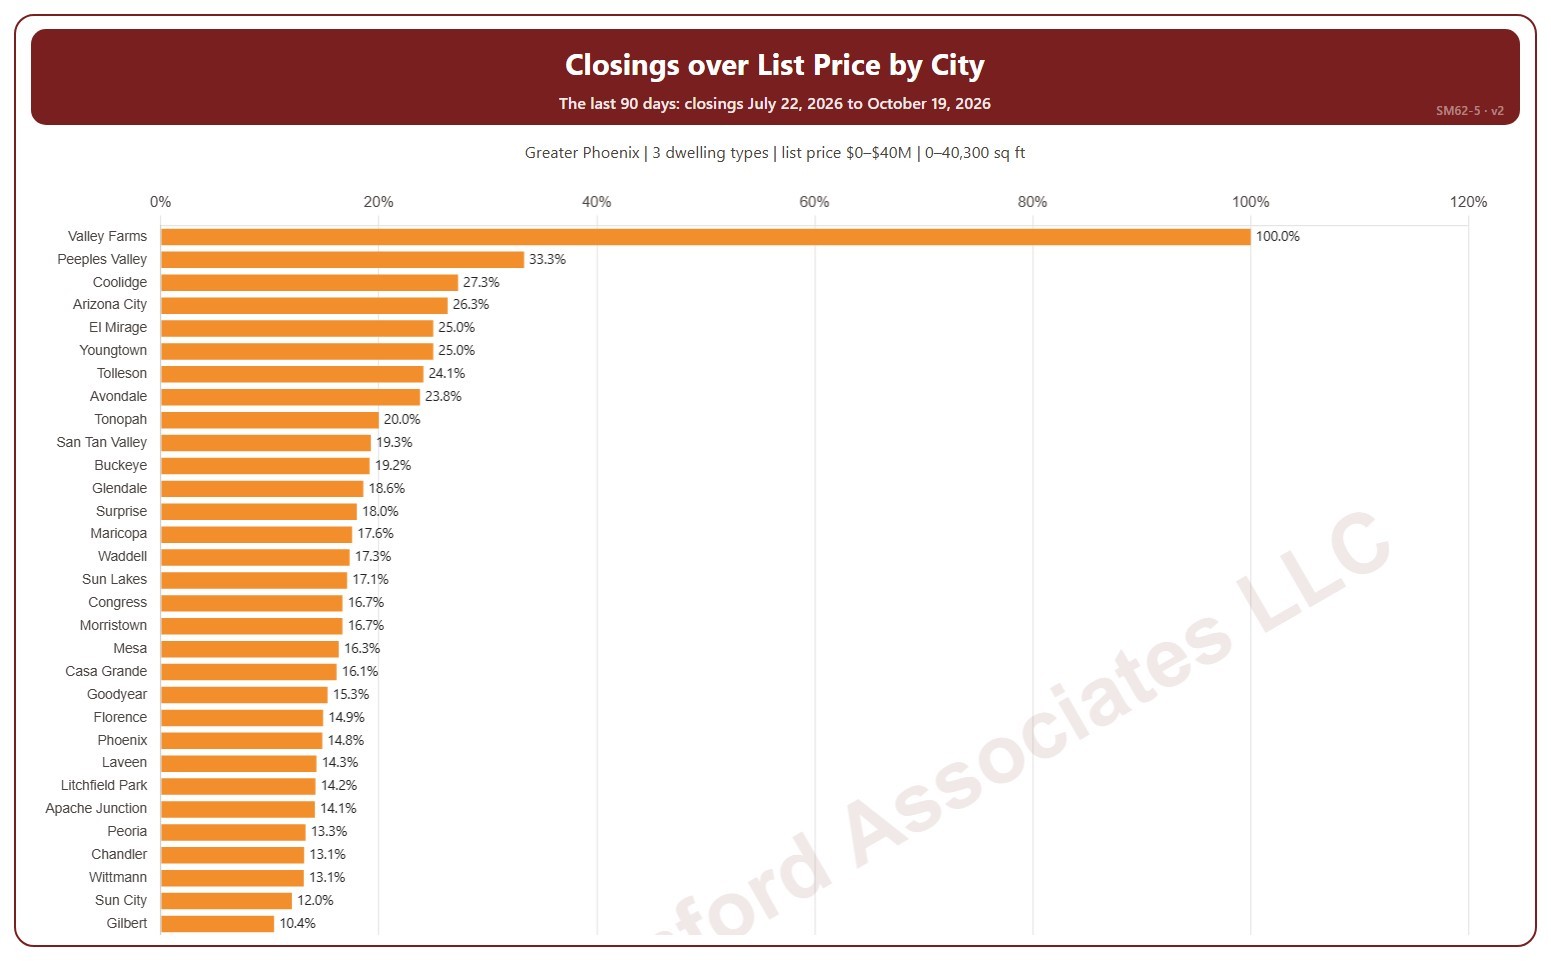
This chart ranks cities by the percentage of their closings that closed over list price in the last 90 days, highest first. A home closed over list price when its sale price was higher than its list price on its ARMLS listing; the amount over is the sale price minus the list price. A city with only a few closings can show 0% or 100%.

It covers the 90 days of closings up to the newest one; the heading shows the exact dates. Scroll inside the chart to see every city; a printed copy runs over as many pages as it needs. The chart is updated every day.

It opens on the Greater Phoenix area: the counties, cities, and ZIP codes that make it up are ticked to start with. Tick or untick any of them to change the area, including counties beyond Greater Phoenix. Narrow it further with the Dwelling Type, Transaction Type, and New / Resale boxes and the list price, home size, and year built sliders.

Hover over a bar to see the percentage, the number over list price, and all closings in that city.

Phoenix Urban Village Snapshot

About this chart

This table shows 38 measures of the market for single-family detached homes in each of 14 of the City of Phoenix’s urban villages, one village at a time. Pick the village from the box at the top. Rio Vista, the fifteenth village, has too few sales to include.

Each measure is shown today, a month ago, a quarter ago, a year ago, and two years ago, and earlier dates back to January 2018 can be chosen from the date box. The ST and LT marks compare today with last month and with last year, colored by whether the change favors sellers or buyers.

Urban villages are planning areas inside the City of Phoenix, so every home in them is also counted in Phoenix. Laveen Urban Village is not the same as the postal city of Laveen, and Paradise Valley Urban Village is not the Town of Paradise Valley.

Year-to-Date Dollar Volume

About this chart

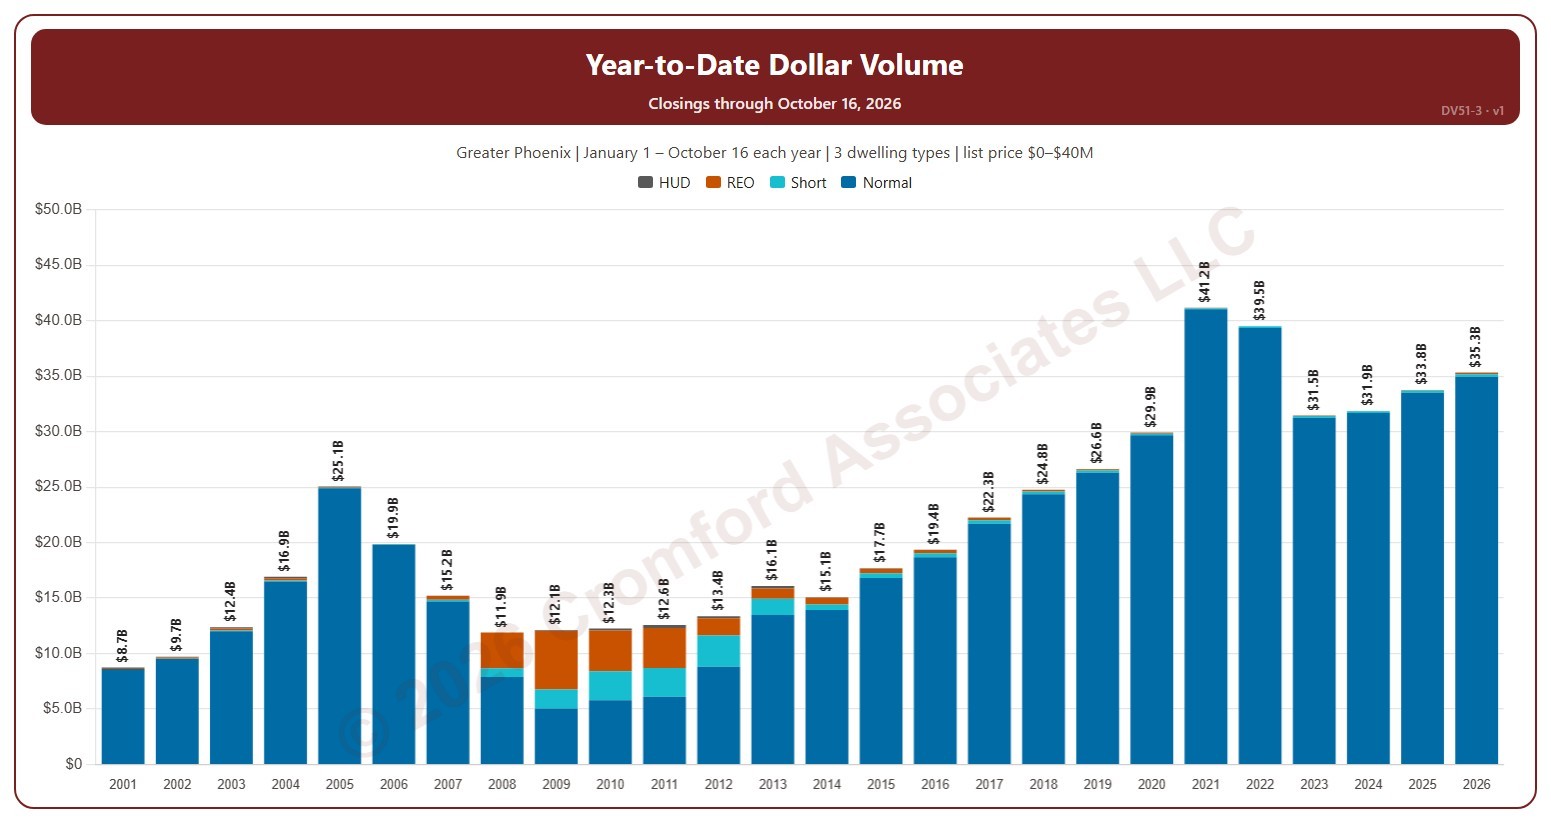
This chart compares the dollar volume of closings year to date: every year is cut to 1 January – the day of the latest closing, so this year so far can be read against the same days of earlier years. Dollar volume is the total of the sale prices of the homes that closed on ARMLS, each bar split by transaction type (normal, short sale, lender-owned, HUD).

It opens on 2001 to date; drag the handles of the date slider under the chart to choose the years shown, as far back as 2001. Use the Month box to count only some months of the year. The chart is updated every day.

It opens on the Greater Phoenix area: the counties, cities, and ZIP codes that make it up are ticked to start with. Tick or untick any of them to change the area, including counties beyond Greater Phoenix. Narrow it further with the Dwelling Type, Transaction Type, and New / Resale boxes and the list price, home size, and year built sliders.

Hover over a bar to see each transaction type and the year-to-date total.

Number of Closings with Seller Paid Concessions Noted

About this chart

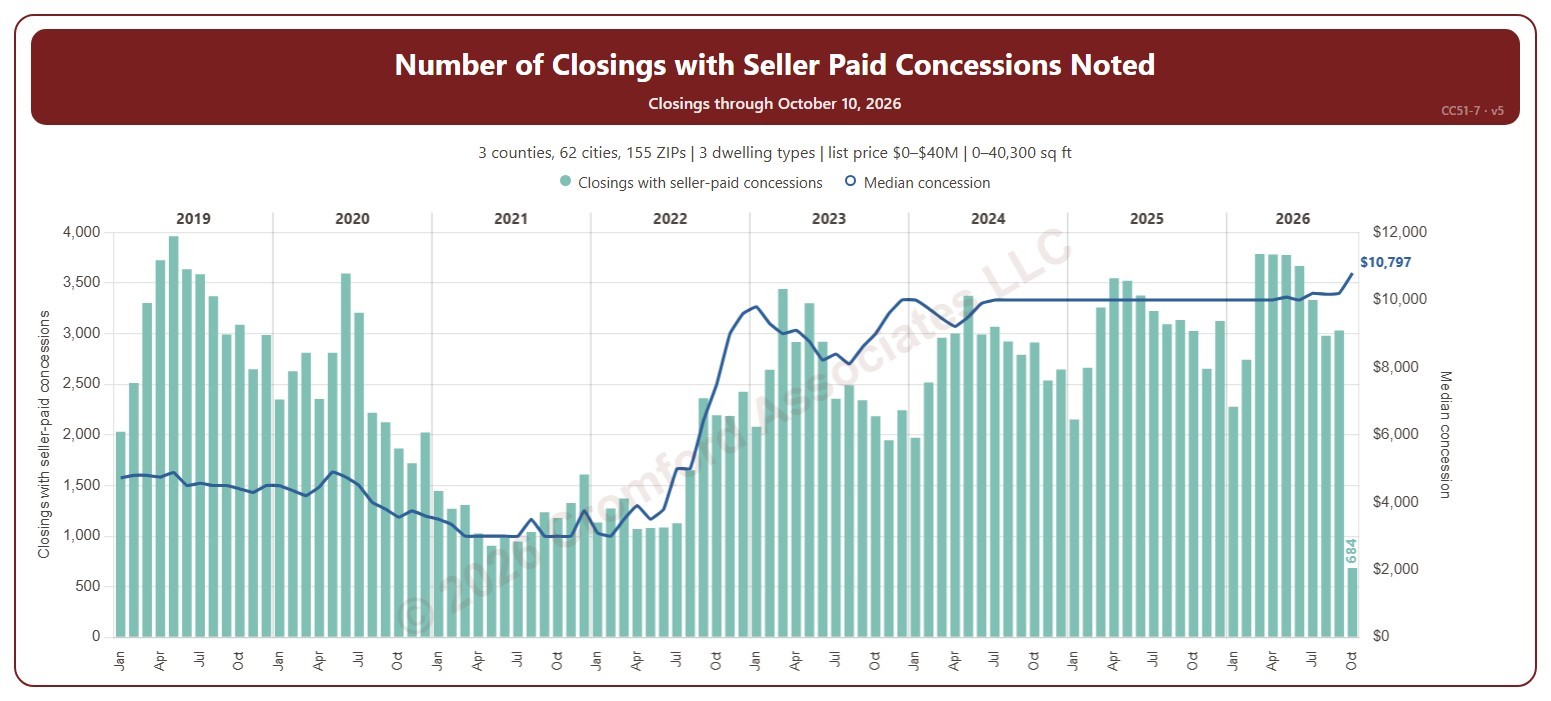
This chart shows the number of closings each month that had a seller-paid concession noted (the bars) and the median dollar amount of those concessions (the line, on the right-hand scale). A seller-paid concession is money the seller agrees to pay toward the buyer’s closing costs or other expenses, as noted on the ARMLS listing when it closes.

It opens on 2019 to date; tick other years in the Year panel to go back as far as 2008. The newest month is the month so far.

It opens on the Greater Phoenix area: the counties, cities, and ZIP codes that make it up are ticked to start with. Tick or untick any of them to change the area, including counties beyond Greater Phoenix. Narrow it further with the Dwelling Type, Transaction Type, and New / Resale boxes and the list price, home size, and year built sliders.

Hover over the chart to see the figures for that month.