About this chart
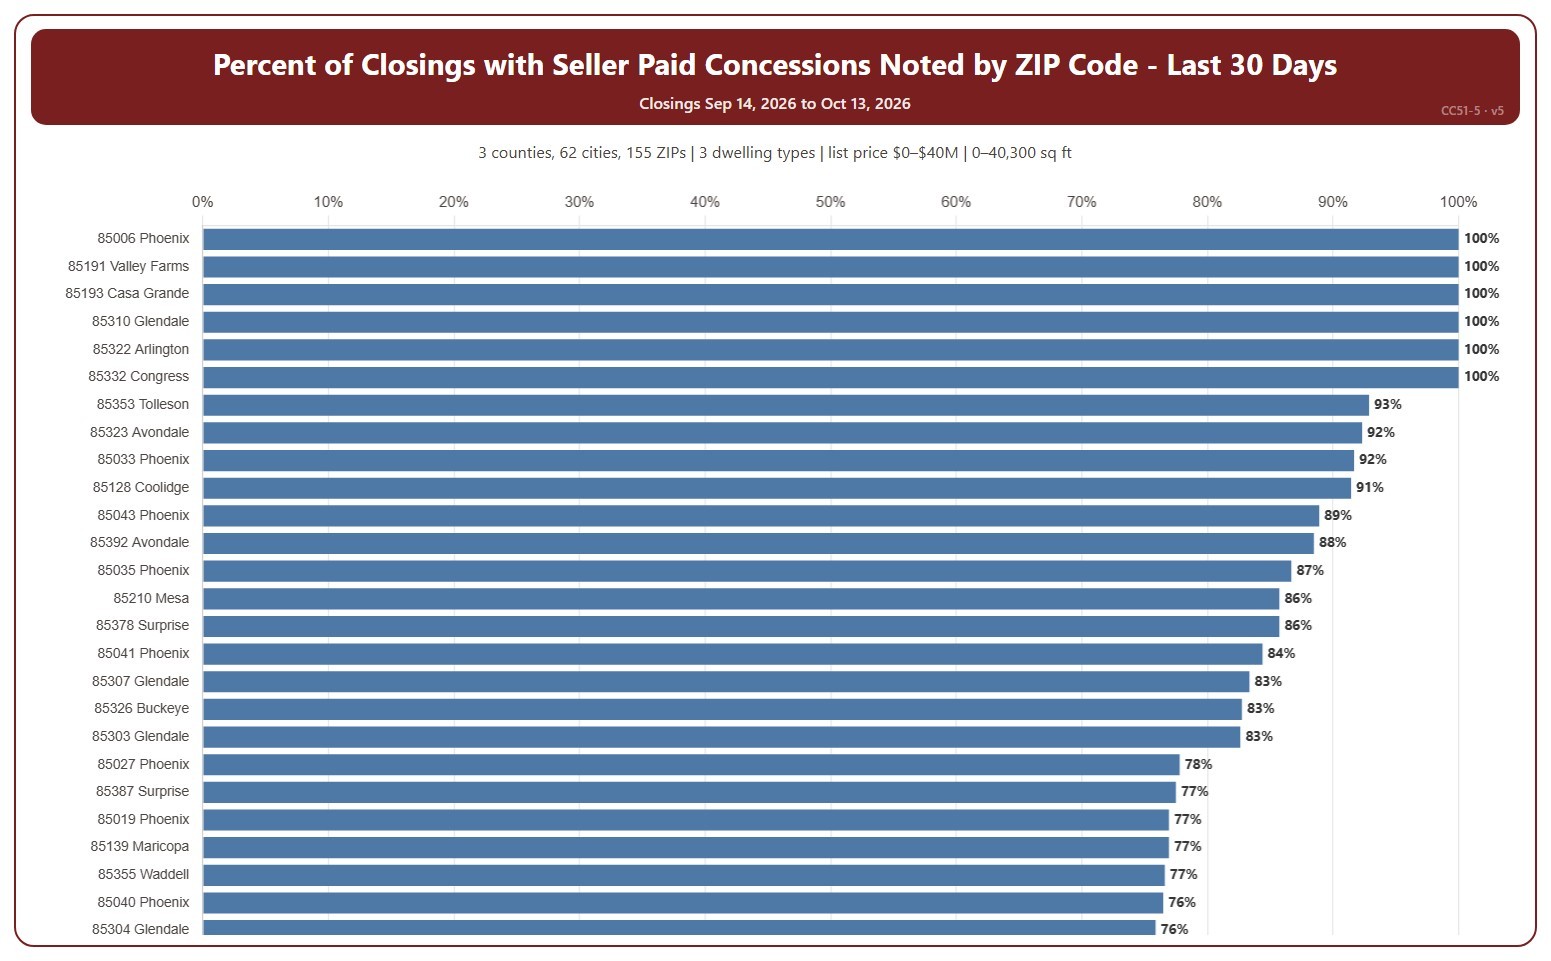
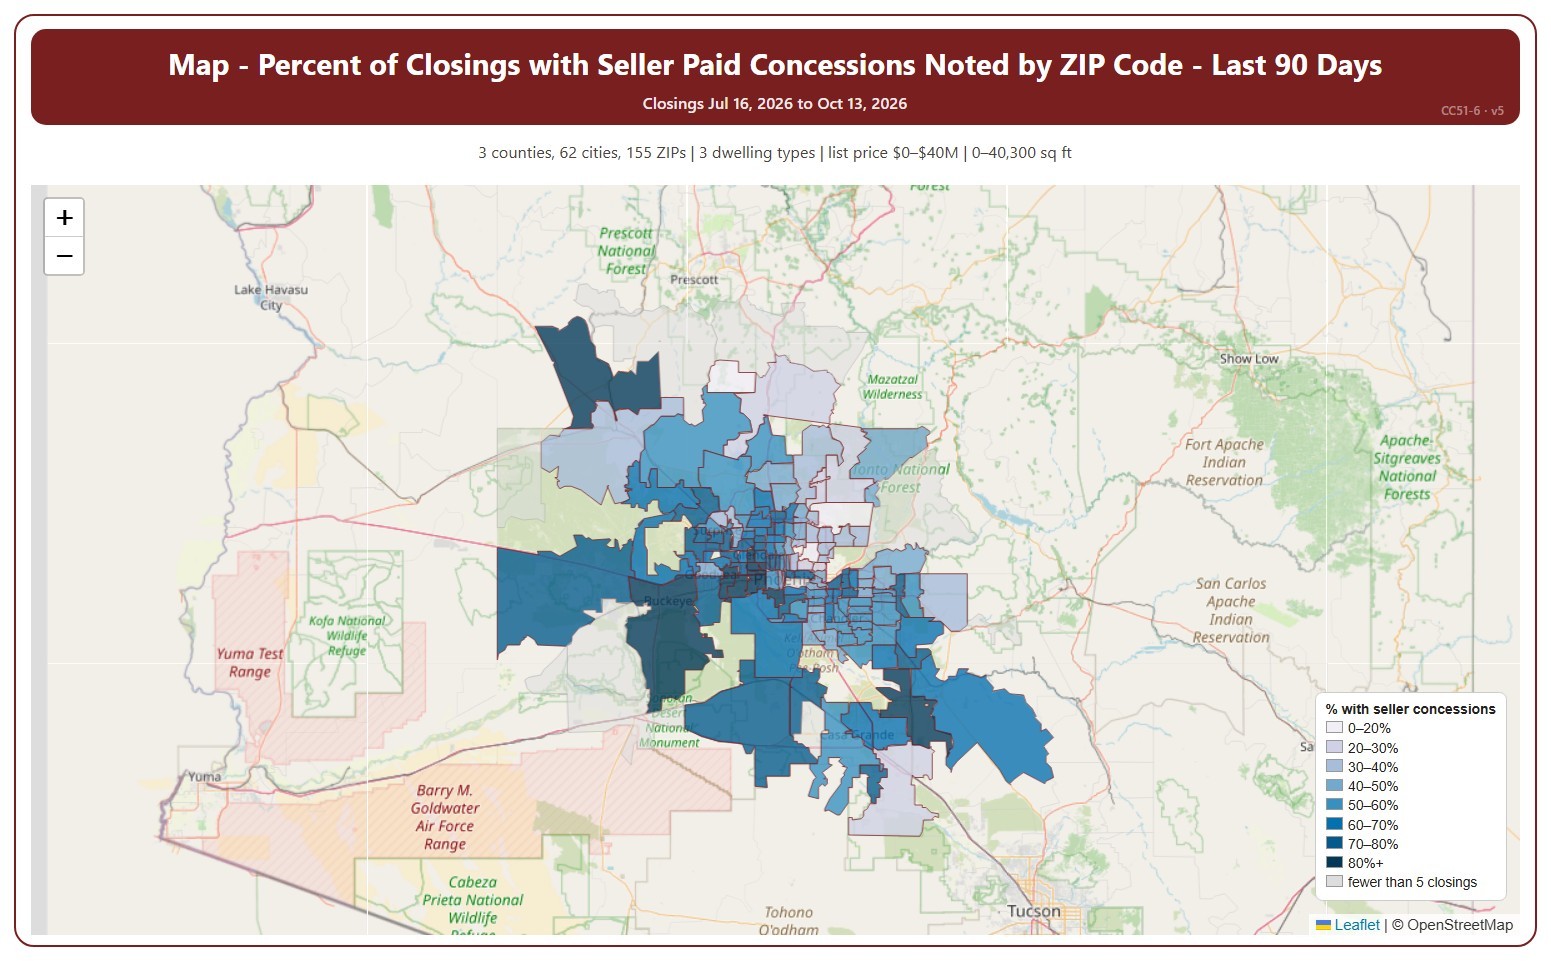
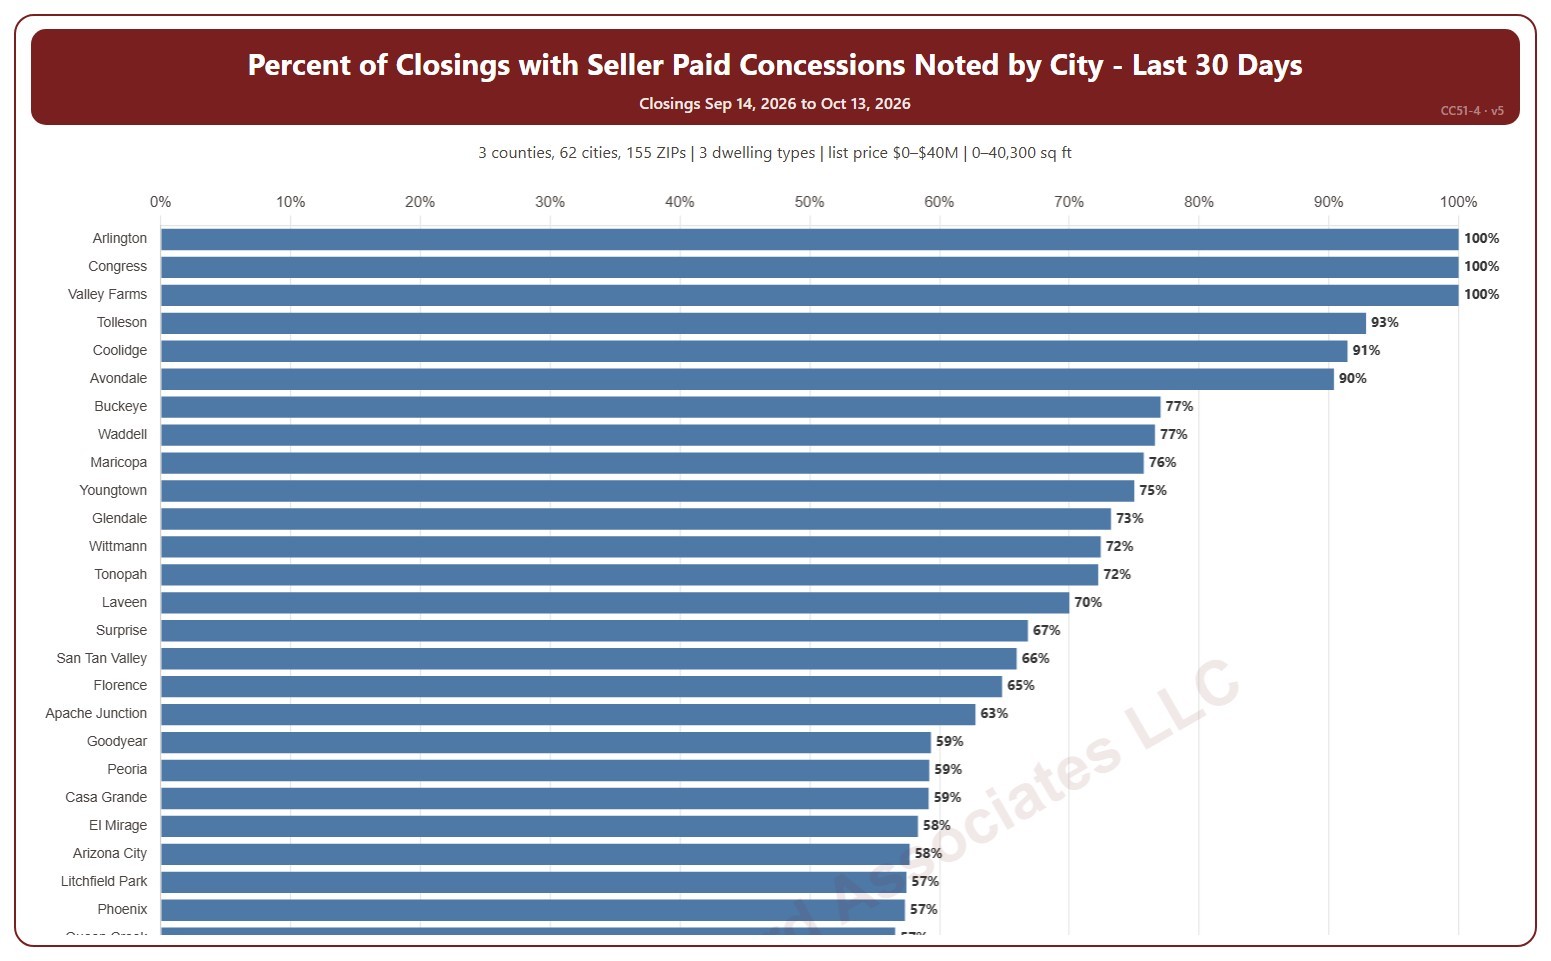
This chart ranks cities by the percentage of recent closings that had a seller-paid concession noted, highest first. A seller-paid concession is money the seller agrees to pay toward the buyer’s closing costs or other expenses, as noted on the ARMLS listing when it closes.
It opens on the last 30 days. Use the Period panel to switch between the last 30 and the last 90 days. The heading shows the exact dates covered. The chart is updated every day. A city with only a few closings can show 0% or 100%; the tooltip gives the count. Scroll inside the chart to see every city.
It opens on the Greater Phoenix area: the counties, cities, and ZIP codes that make it up are ticked to start with. Tick or untick any of them to change the area, including counties beyond Greater Phoenix. Narrow it further with the Dwelling Type, Transaction Type, and New / Resale boxes and the list price, home size, and year built sliders.
Hover over a bar to see the closings with a concession, the total, and the median concession.