About this chart
This chart compares annual appreciation across 34 cities in and around Greater Phoenix over the last 24 months, measured every week, for single-family detached resale homes on ARMLS. Appreciation here is the change in the median sales price per square foot over the last 12 months compared with a year earlier. Above zero, prices are higher than a year ago; below zero, they are lower.
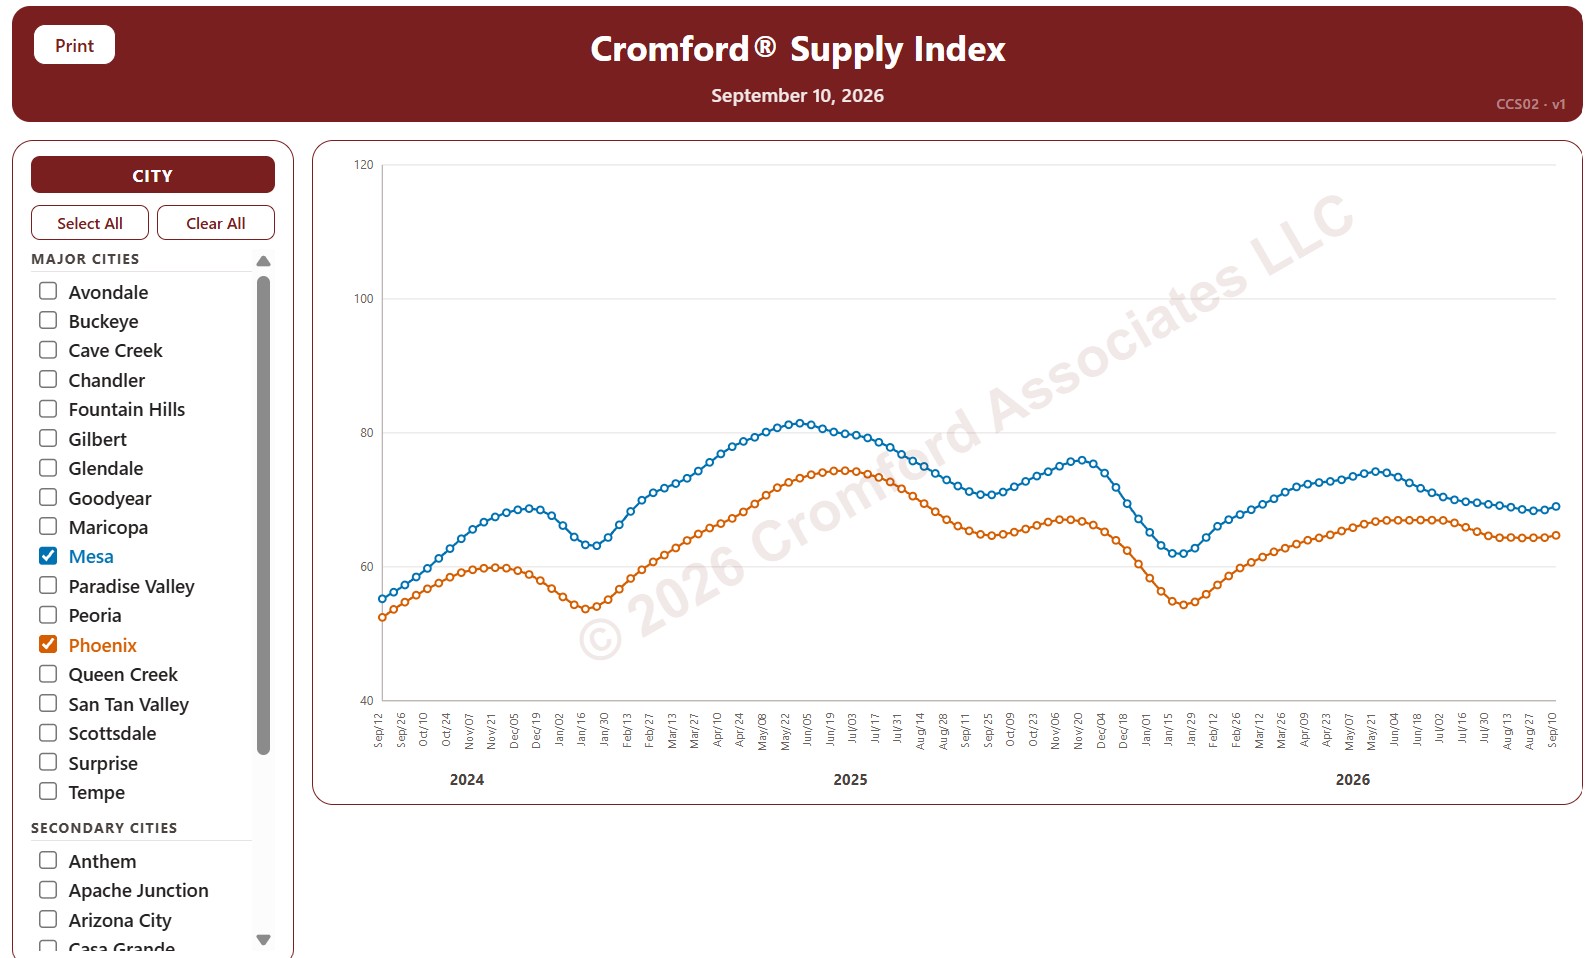
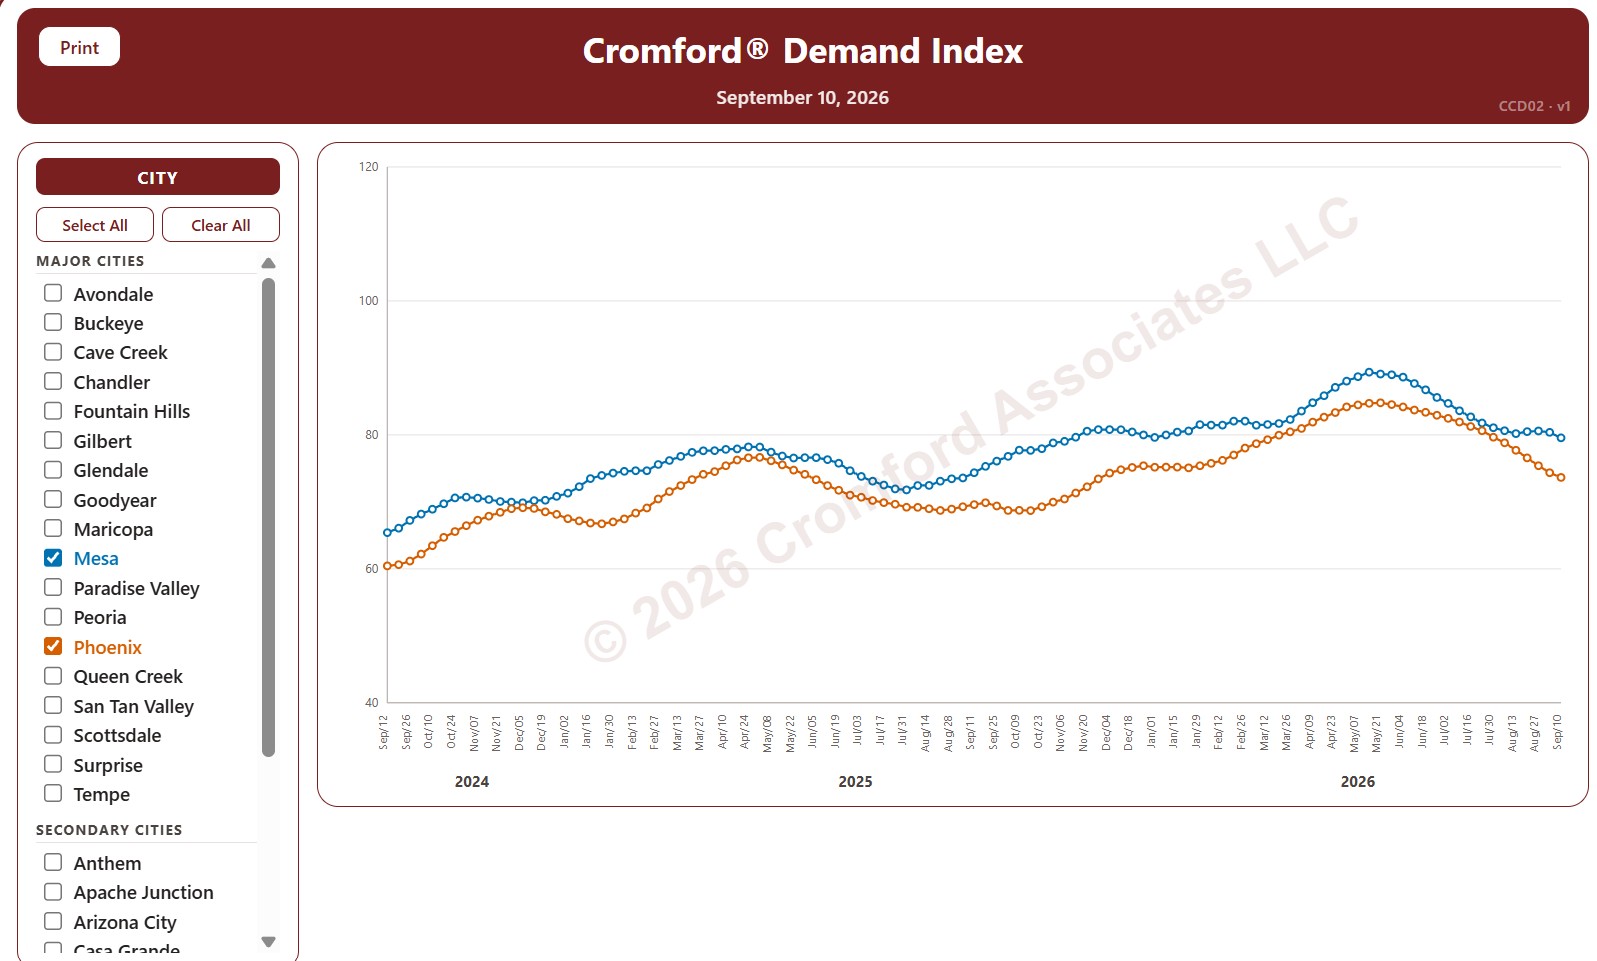
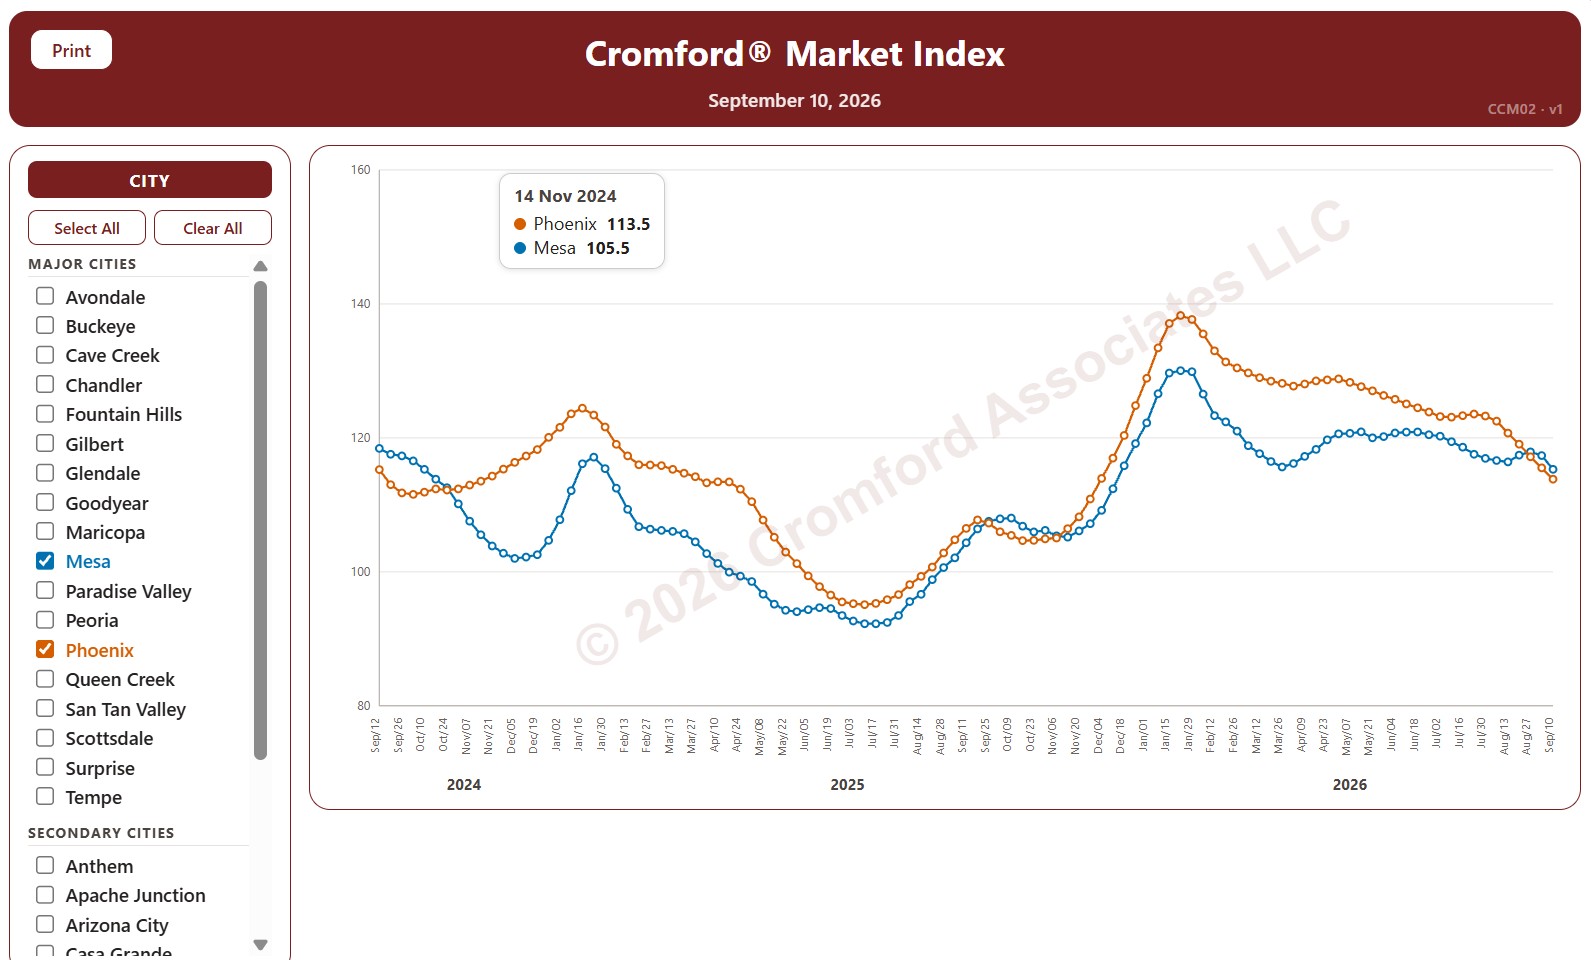
The 18 major cities are drawn as solid lines and the 16 secondary cities as dashed lines. It opens on Mesa and Phoenix; use the city check boxes, or Select All and Clear All, to choose which cities are shown.
Hover over a line to see the exact figure for that week.