Median Days on Market for Closed Listings by Region

About this chart

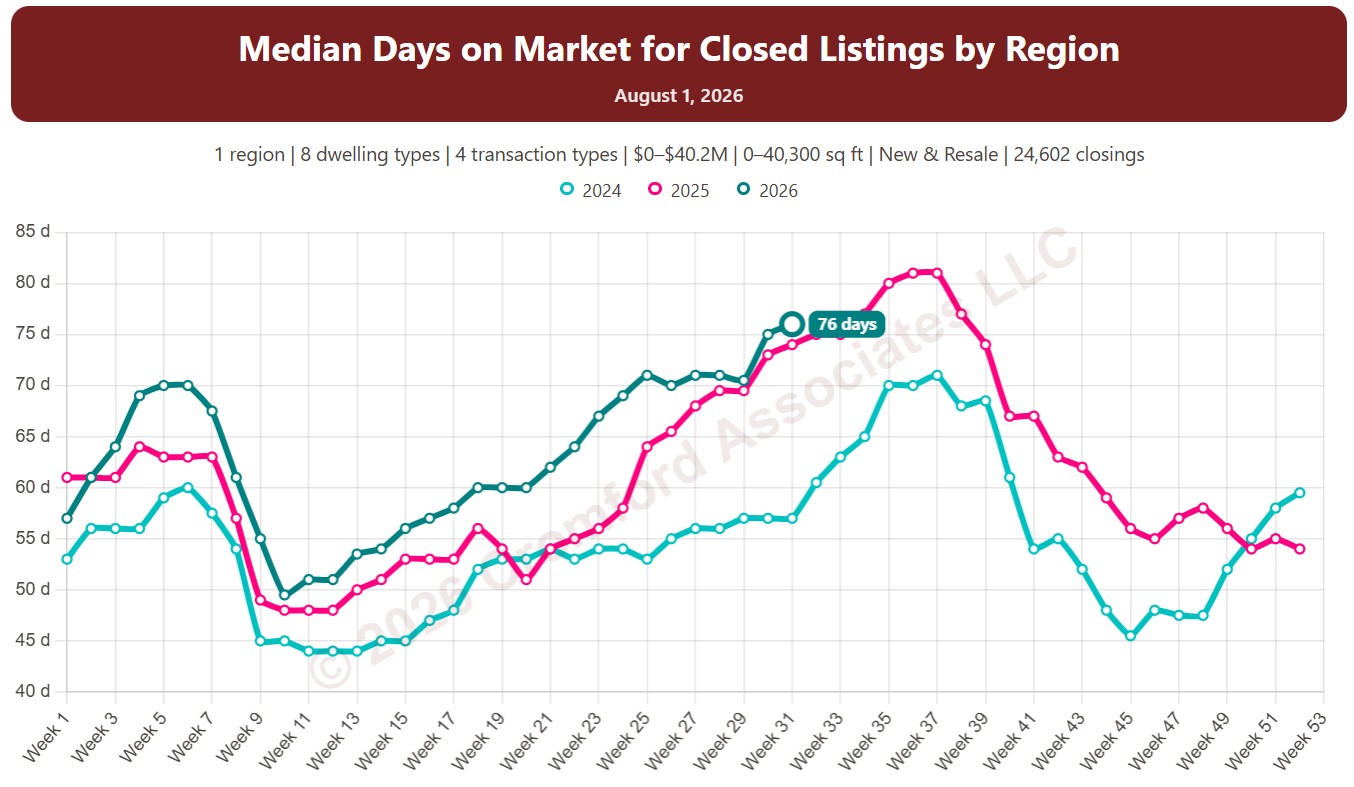
This chart shows the median days on market for homes that closed through ARMLS in the month up to each week, measured every week. Fewer days means homes are selling faster.

Each year has its own line, laid out by week of the year, so you can compare this year with earlier years at the same point in the season. It opens on the last three years; tick any year back to 2001 in the Year panel.

It opens with every region included. Use the Region panel to focus on one region or compare a combination of them. Narrow it with the Dwelling Type, Transaction Type, and New / Resale boxes and the sales price and home size sliders.

Hover over a line to see the exact figure for that week.
Median Days on Market for Closed Listings by City and ZIP Code

About this chart

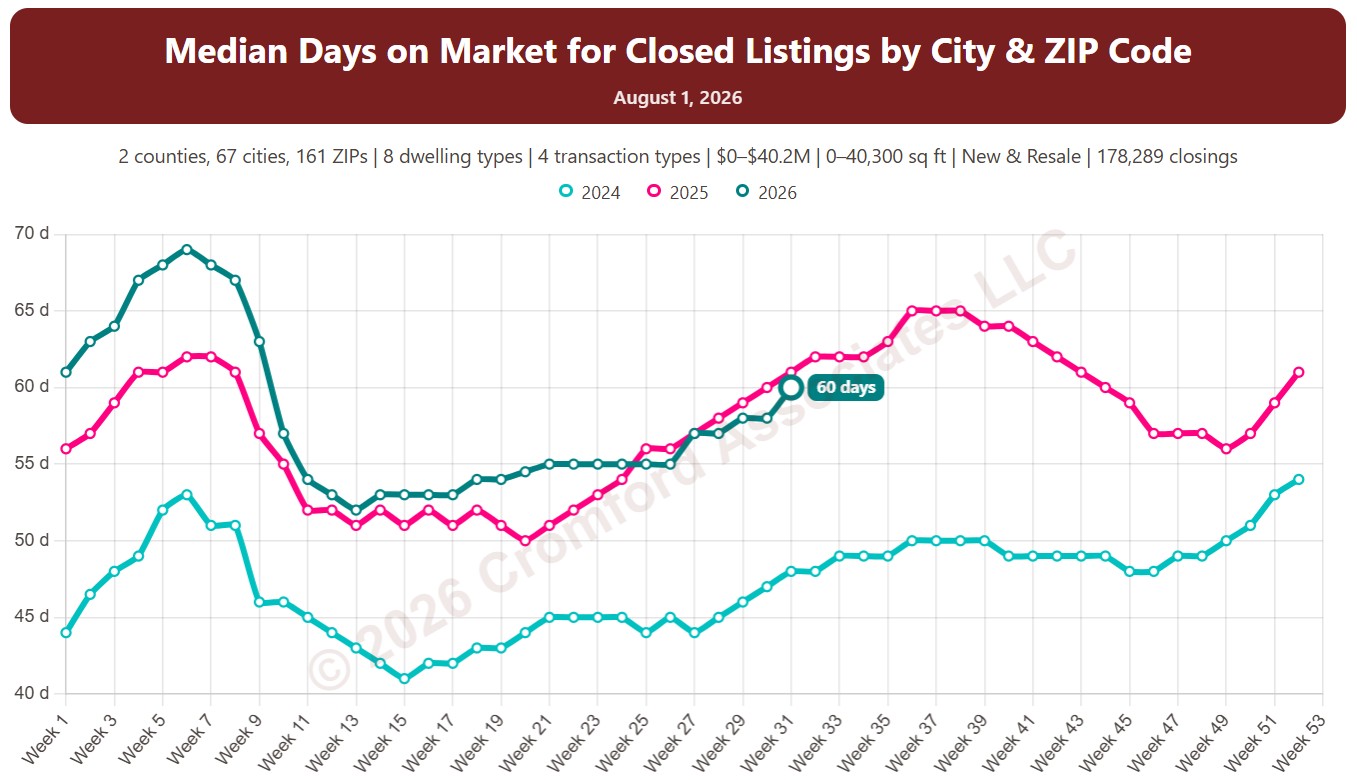
This chart shows the median days on market for homes that closed through ARMLS in the month up to each week, measured every week. Fewer days means homes are selling faster.

Each year has its own line, laid out by week of the year, so you can compare this year with earlier years at the same point in the season. It opens on the last three years; tick any year back to 2001 in the Year panel.

It opens on Maricopa and Pinal Counties with every city and ZIP code included. Use the County, City, and ZIP panels to focus on any area, from a whole county down to a single ZIP code. Narrow it with the Dwelling Type, Transaction Type, and New / Resale boxes and the sales price and home size sliders.

Hover over a line to see the exact figure for that week.
Property Value Estimate

About this chart

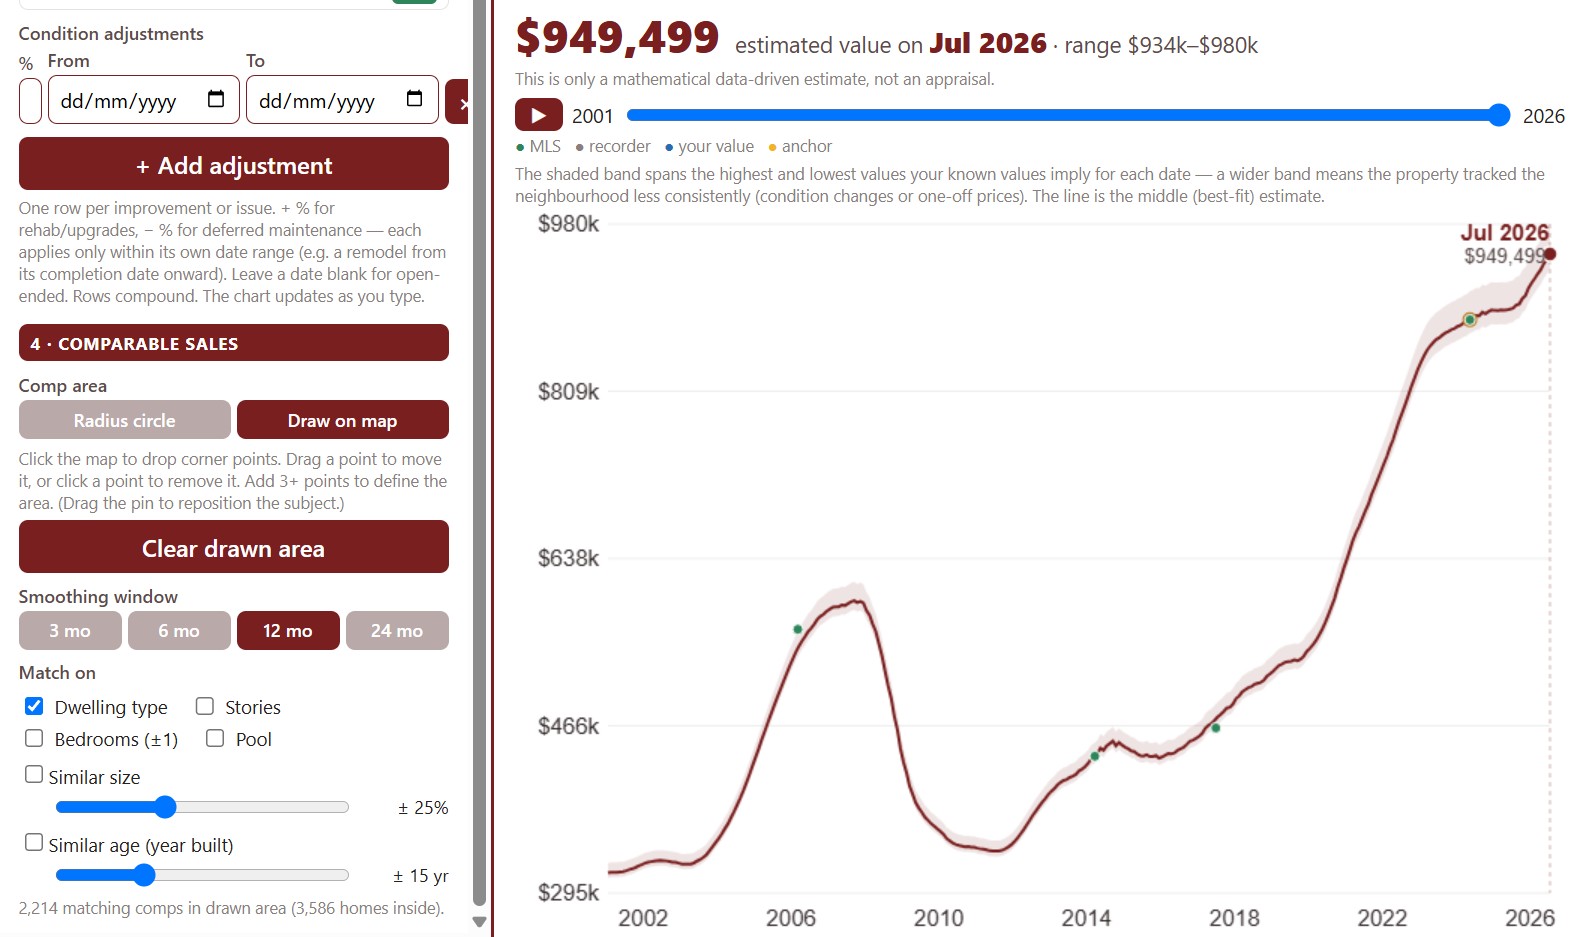
This tool estimates what a home is worth on any date, starting from a value you know on a known date, such as its last sale price, and moving it with the price trend of similar homes sold nearby. It is a data-driven estimate, not an appraisal.

Find the property by address, confirm its details (you know them better than the county does), and choose the estimate basis: a single sale or a blend of its sales. Set the area the comparable sales come from with the radius circle or by drawing on the map.

Add adjustments for upgrades or deferred maintenance, each over its own dates, and the chart updates as you type.

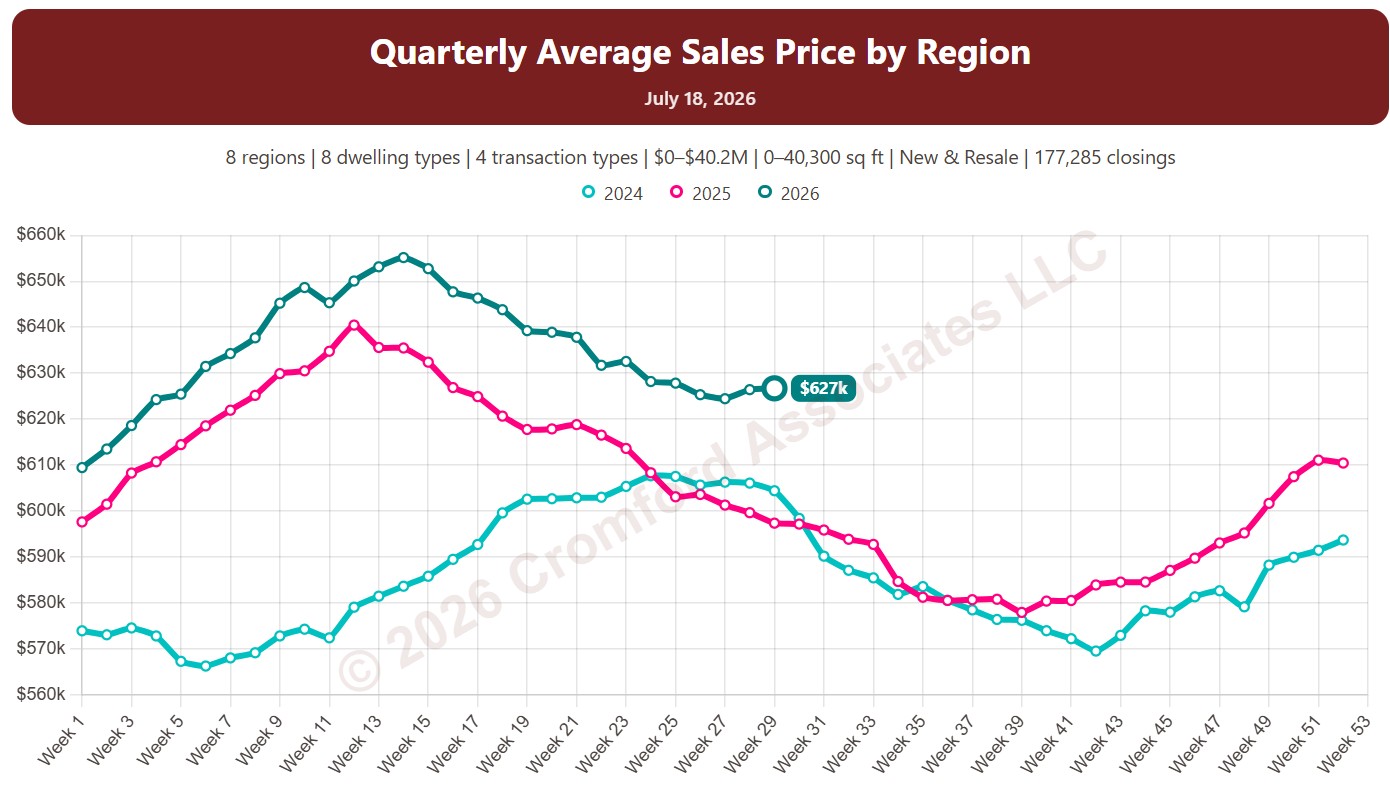
Quarterly Average Sales Price by Region

About this chart

This chart shows the average sales price of homes that closed through ARMLS, measured every week. Each point covers the homes that closed in the three months up to that week. Sales of large, expensive homes pull the average up more than the median, so it usually sits above the median price.

Each year has its own line, laid out by week of the year, so you can compare this year with earlier years at the same point in the season. It opens on the last three years; tick any year back to 2001 in the Year panel.

It opens with every region included. Use the Region panel to focus on one region or compare a combination of them. Narrow it with the Dwelling Type, Transaction Type, and New / Resale boxes and the sales price, home size, and year built sliders. The Inflation (CPI) option restates prices in today’s dollars using national or Phoenix inflation.

Hover over a line to see the exact figure for that week.
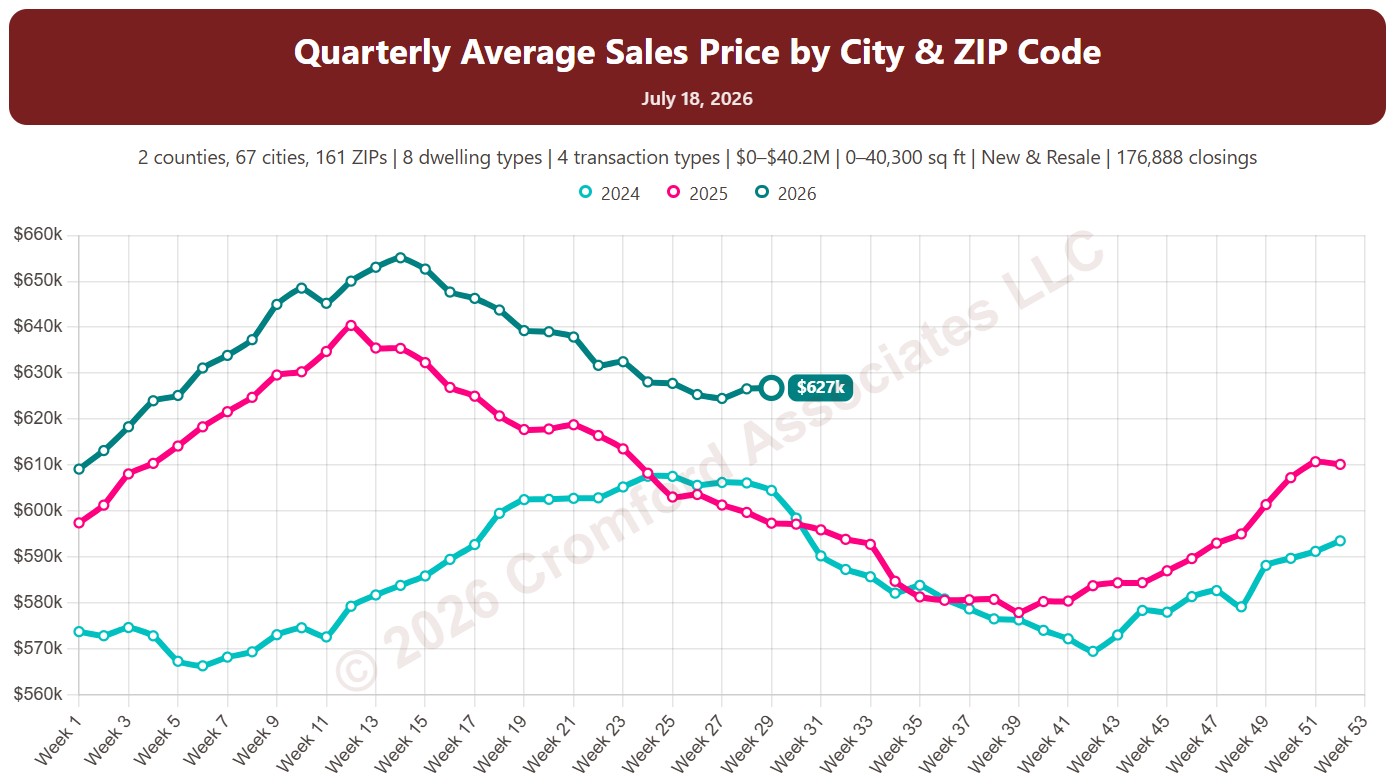
Quarterly Average Sales Price by City and ZIP Code

About this chart

This chart shows the average sales price of homes that closed through ARMLS, measured every week. Each point covers the homes that closed in the three months up to that week. Sales of large, expensive homes pull the average up more than the median, so it usually sits above the median price.

Each year has its own line, laid out by week of the year, so you can compare this year with earlier years at the same point in the season. It opens on the last three years; tick any year back to 2001 in the Year panel.

It opens on Maricopa and Pinal Counties with every city and ZIP code included. Use the County, City, and ZIP panels to focus on any area, from a whole county down to a single ZIP code. Narrow it with the Dwelling Type, Transaction Type, and New / Resale boxes and the sales price, home size, and year built sliders. The Inflation (CPI) option restates prices in today’s dollars using national or Phoenix inflation.

Hover over a line to see the exact figure for that week.
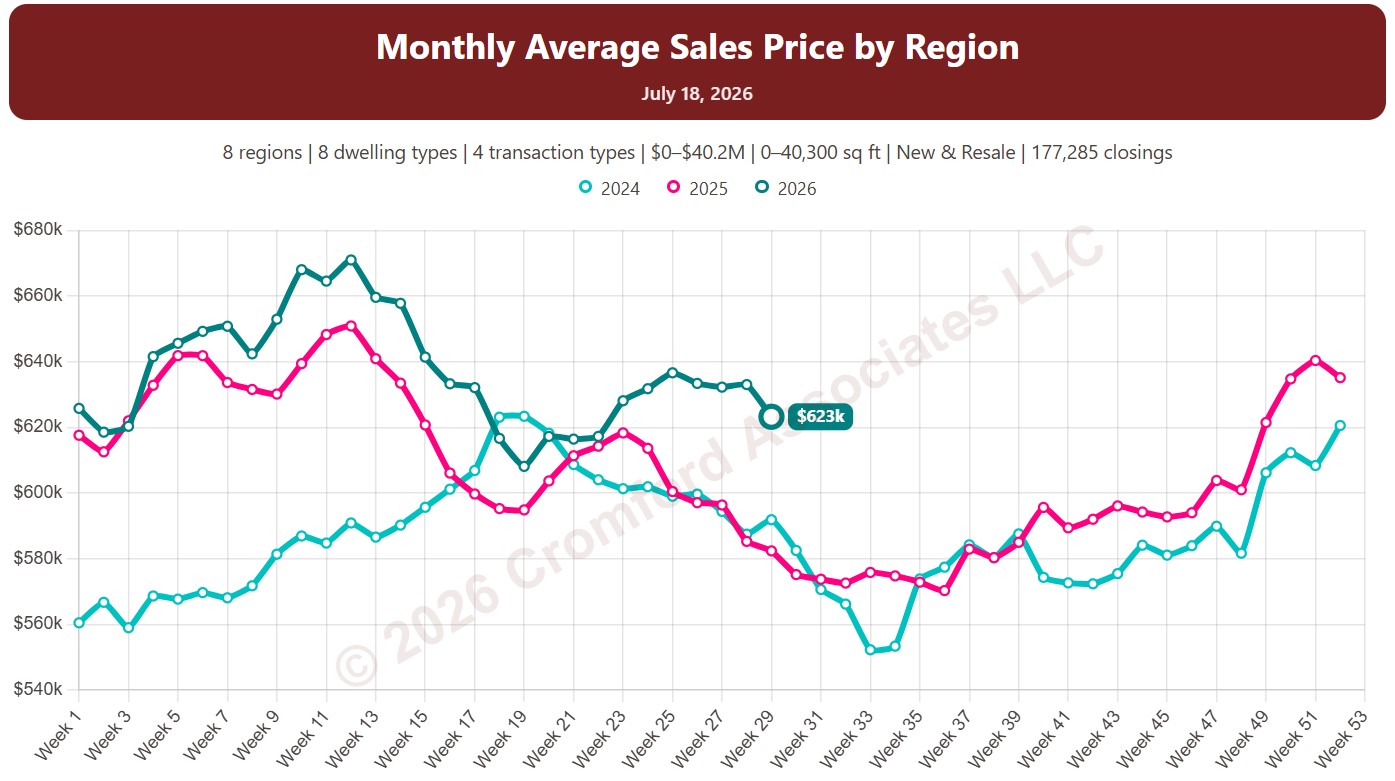
Monthly Average Sales Price by Region

About this chart

This chart shows the average sales price of homes that closed through ARMLS, measured every week. Each point covers the homes that closed in the month up to that week. Sales of large, expensive homes pull the average up more than the median, so it usually sits above the median price.

Each year has its own line, laid out by week of the year, so you can compare this year with earlier years at the same point in the season. It opens on the last three years; tick any year back to 2001 in the Year panel.

It opens with every region included. Use the Region panel to focus on one region or compare a combination of them. Narrow it with the Dwelling Type, Transaction Type, and New / Resale boxes and the sales price, home size, and year built sliders. The Inflation (CPI) option restates prices in today’s dollars using national or Phoenix inflation.

Hover over a line to see the exact figure for that week.
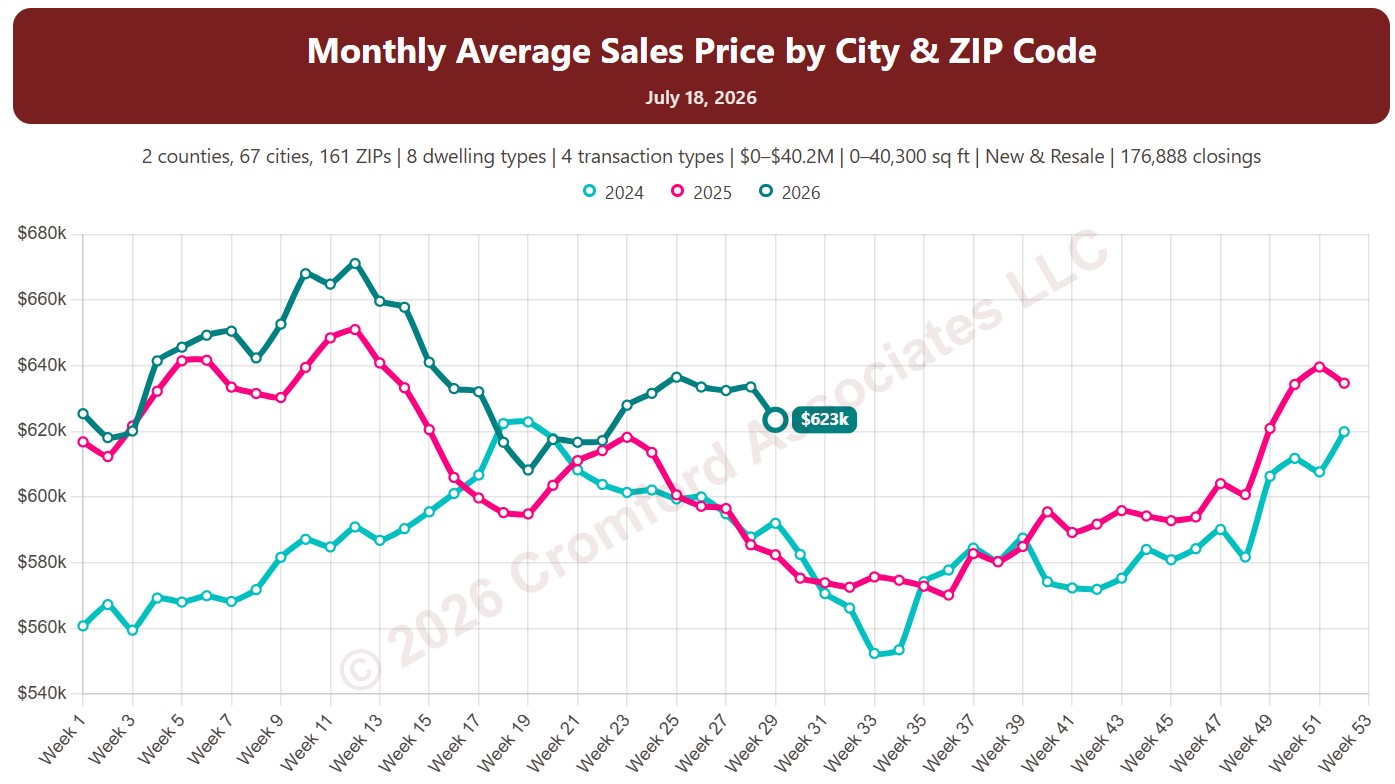
Monthly Average Sales Price by City and ZIP Code

About this chart

This chart shows the average sales price of homes that closed through ARMLS, measured every week. Each point covers the homes that closed in the month up to that week. Sales of large, expensive homes pull the average up more than the median, so it usually sits above the median price.

Each year has its own line, laid out by week of the year, so you can compare this year with earlier years at the same point in the season. It opens on the last three years; tick any year back to 2001 in the Year panel.

It opens on Maricopa and Pinal Counties with every city and ZIP code included. Use the County, City, and ZIP panels to focus on any area, from a whole county down to a single ZIP code. Narrow it with the Dwelling Type, Transaction Type, and New / Resale boxes and the sales price, home size, and year built sliders. The Inflation (CPI) option restates prices in today’s dollars using national or Phoenix inflation.

Hover over a line to see the exact figure for that week.
Annual Average Sales Price by Region

About this chart

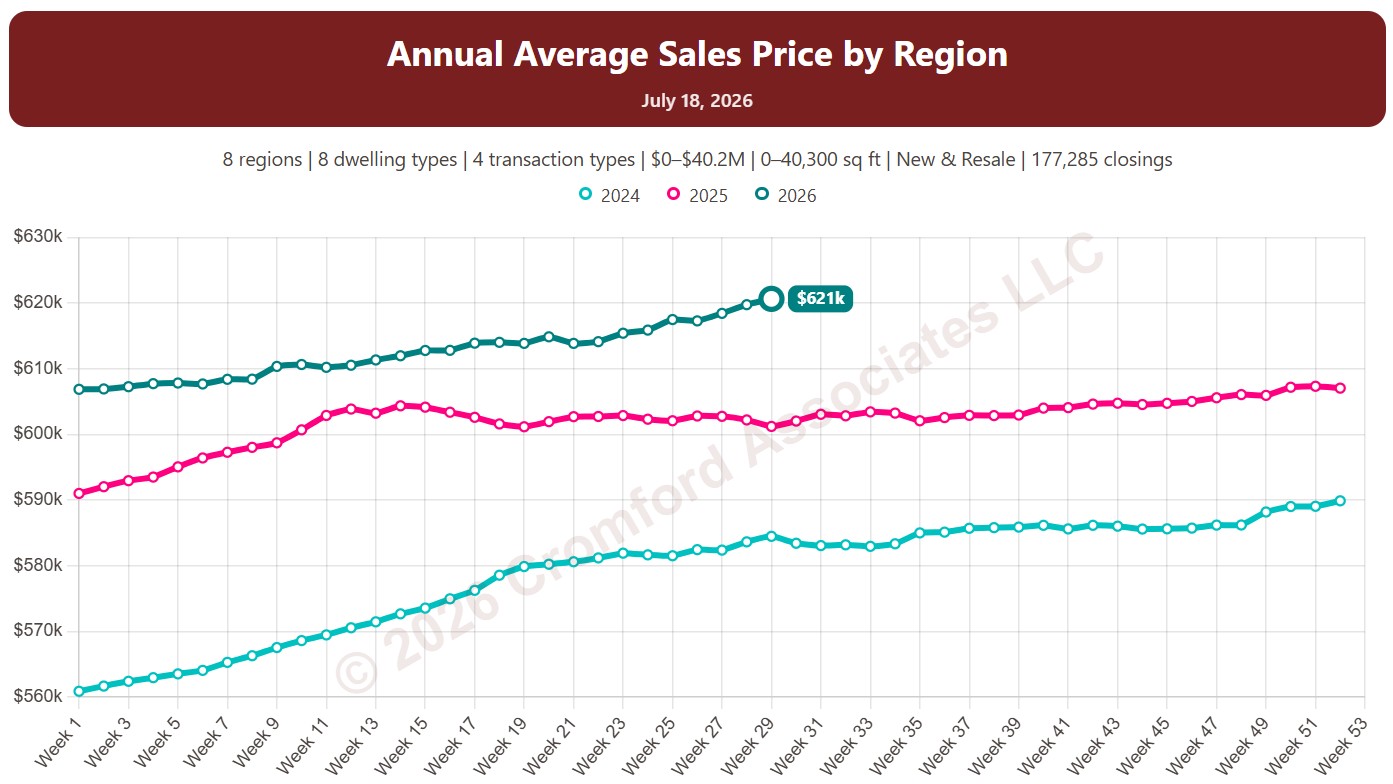
This chart shows the average sales price of homes that closed through ARMLS, measured every week. Each point covers the homes that closed in the 12 months up to that week. Sales of large, expensive homes pull the average up more than the median, so it usually sits above the median price.

Each year has its own line, laid out by week of the year, so you can compare this year with earlier years at the same point in the season. It opens on the last three years; tick any year back to 2001 in the Year panel.

It opens with every region included. Use the Region panel to focus on one region or compare a combination of them. Narrow it with the Dwelling Type, Transaction Type, and New / Resale boxes and the sales price, home size, and year built sliders. The Inflation (CPI) option restates prices in today’s dollars using national or Phoenix inflation.

Hover over a line to see the exact figure for that week.
Median Price per Square Foot for Active Listings and Listings Under Contract by Region

About this chart

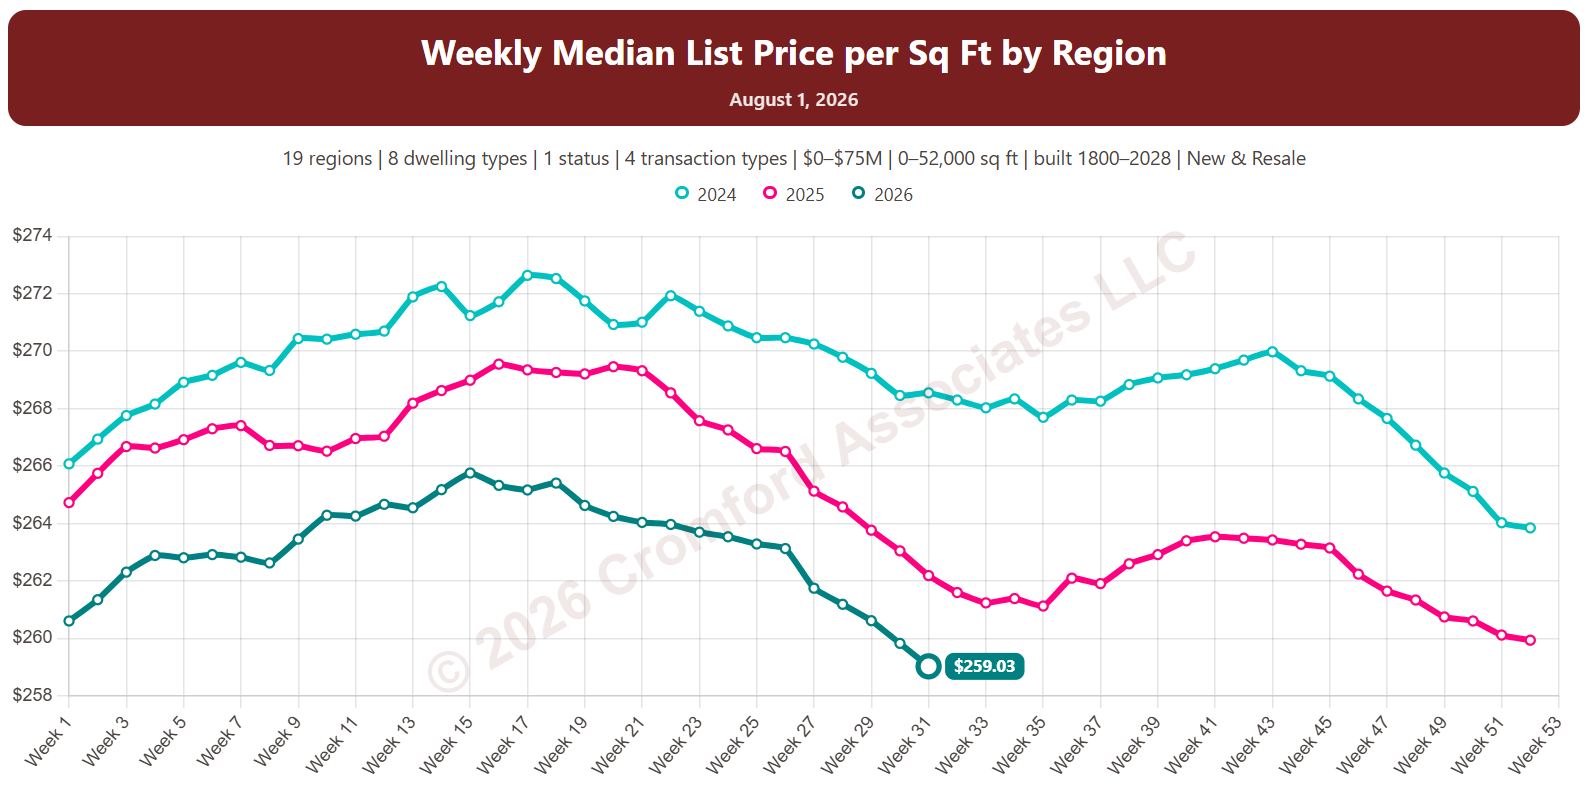
This chart shows the median list price per square foot of homes listed on ARMLS, measured every week (on Saturdays). It shows what sellers are asking.

By default it covers Active listings. Tick Coming Soon, Pending, UCB / CCBS, or Temp Off Market in the List Status panel to look at those listings instead or as well.

Each year has its own line, laid out by week of the year, so you can compare this year with earlier years at the same point in the season. It opens on the last three years; tick any year back to 2011 in the Year panel.

It opens with every region included. Use the Region panel to focus on one region or compare a combination of them. Narrow it with the Dwelling Type, List Status, Transaction Type, and New / Resale boxes and the list price, home size, and year built sliders. The Inflation (CPI) option restates prices in today’s dollars using national or Phoenix inflation.

Hover over a line to see the exact figure for that week.
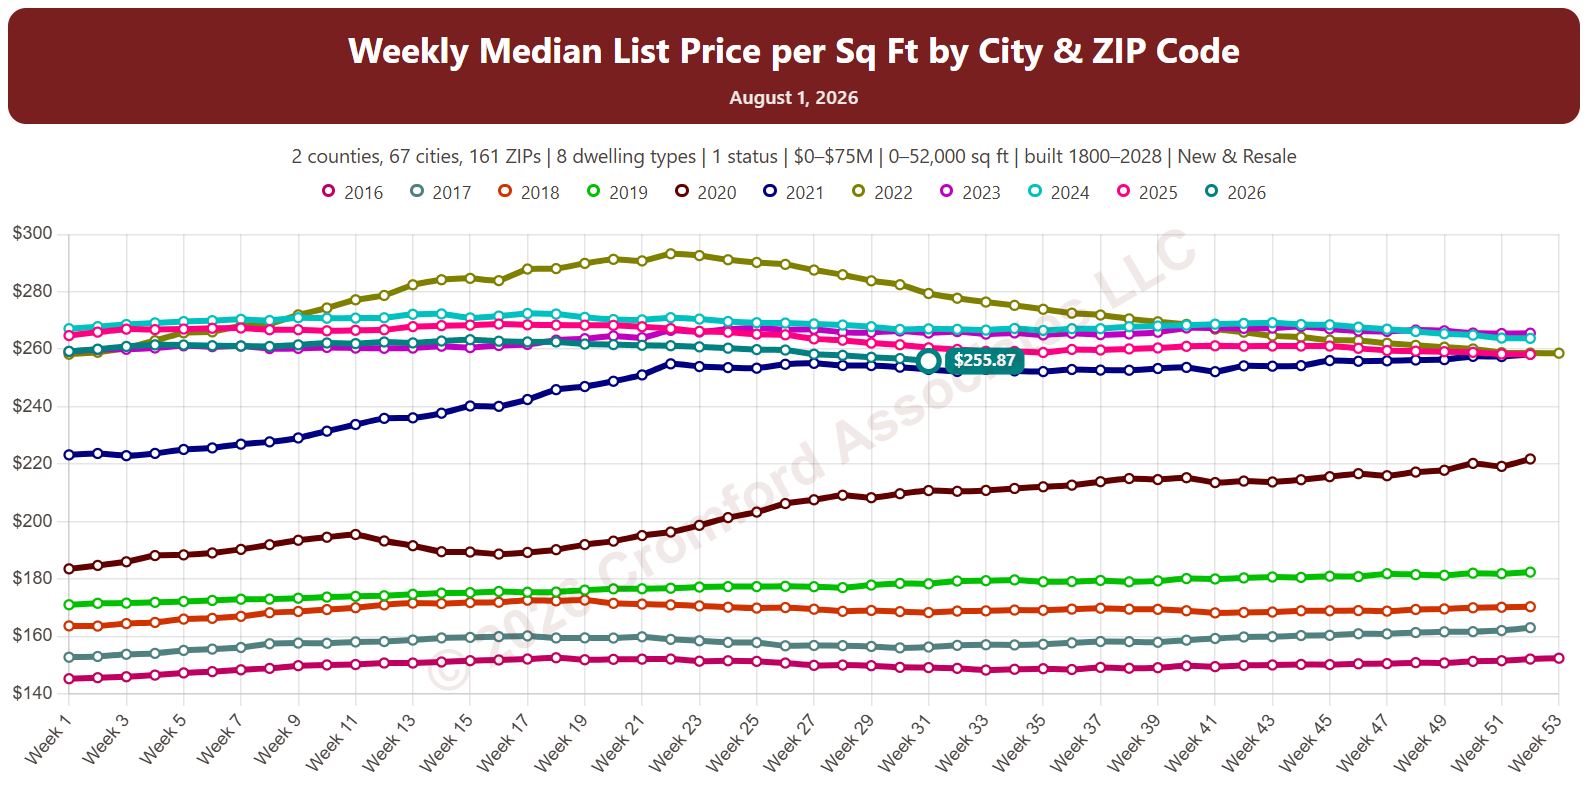
Median Price per Square Foot for Active & Under Contract Listings by City and ZIP Code

About this chart

This chart shows the median list price per square foot of homes listed on ARMLS, measured every week (on Saturdays). It shows what sellers are asking.

By default it covers Active listings. Tick Coming Soon, Pending, UCB / CCBS, or Temp Off Market in the List Status panel to look at those listings instead or as well.

Each year has its own line, laid out by week of the year, so you can compare this year with earlier years at the same point in the season. It opens on the last three years; tick any year back to 2011 in the Year panel.

It opens on Maricopa and Pinal Counties with every city and ZIP code included. Use the County, City, and ZIP panels to focus on any area, from a whole county down to a single ZIP code. Narrow it with the Dwelling Type, List Status, Transaction Type, and New / Resale boxes and the list price, home size, and year built sliders. The Inflation (CPI) option restates prices in today’s dollars using national or Phoenix inflation.

Hover over a line to see the exact figure for that week.