Market Conditions Dashboard

About this chart

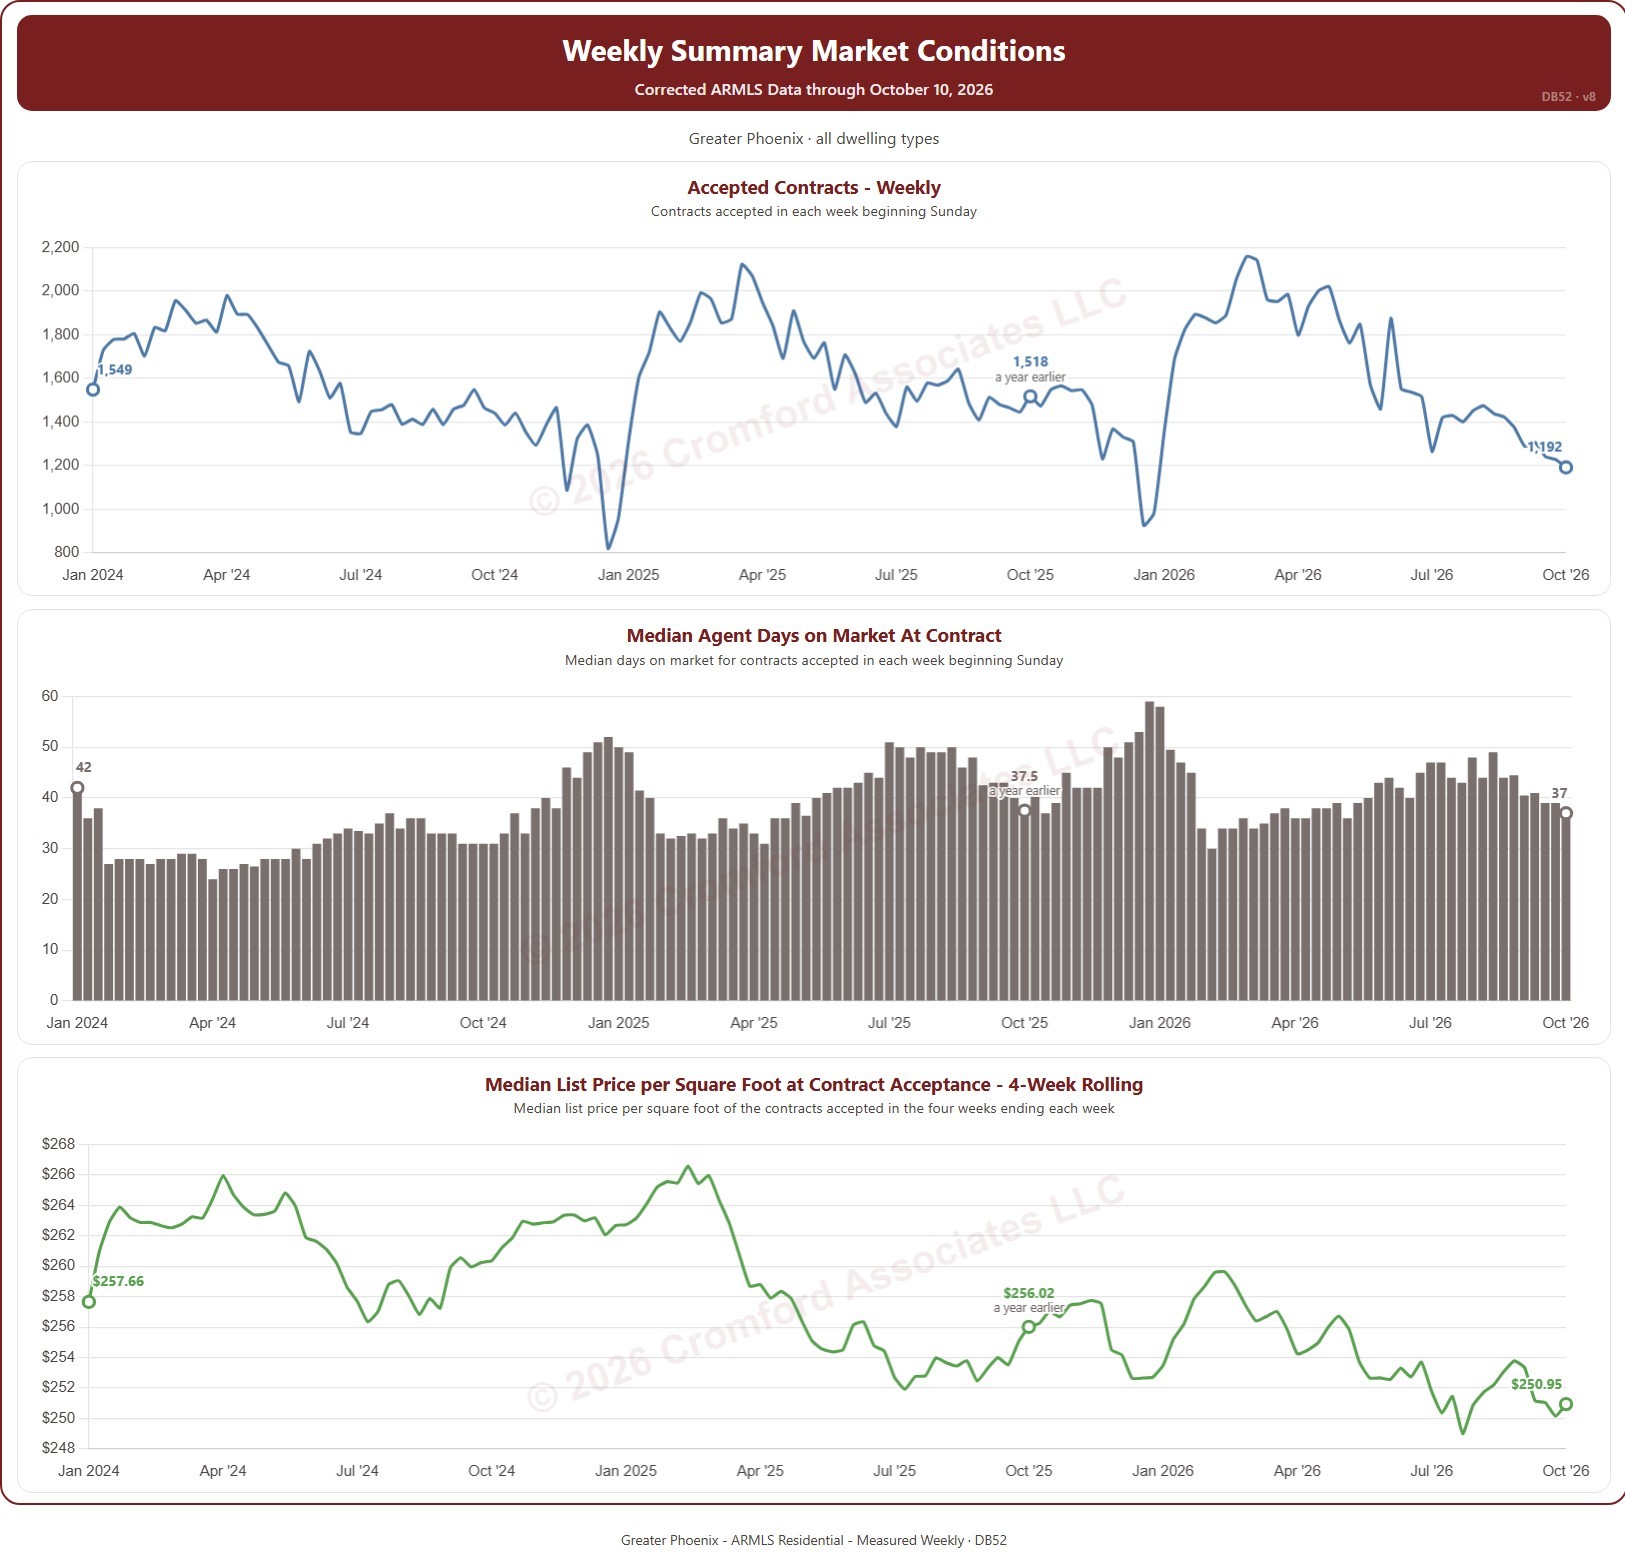
This dashboard tracks the contracts accepted on ARMLS each week. A contract counts when a listing goes from Active or Temp Off Market to Pending or UCB / CCBS. Weeks run Sunday to Saturday and are labeled by their Sunday. Three charts share one set of filters: the number of contracts accepted each week; the median agent days on market of those contracts; and the median list price per square foot of the contracts accepted in the four weeks ending each week.

It opens on January of the year two years back to the latest complete week. Drag the handles of the date slider under each chart to choose the weeks shown, as far back as January 2014. Each chart marks the week a year before its last week, so the latest figure can be read against the same week a year earlier. The dashboard is updated every week.

It opens on the Greater Phoenix area: the counties, cities, and ZIP codes that make it up are ticked to start with. Tick or untick any of them to change the area, including counties beyond Greater Phoenix. Narrow it further with the Dwelling Type and Transaction Type boxes and the list price and home size sliders.

Hover over a chart to see the figures for that week.
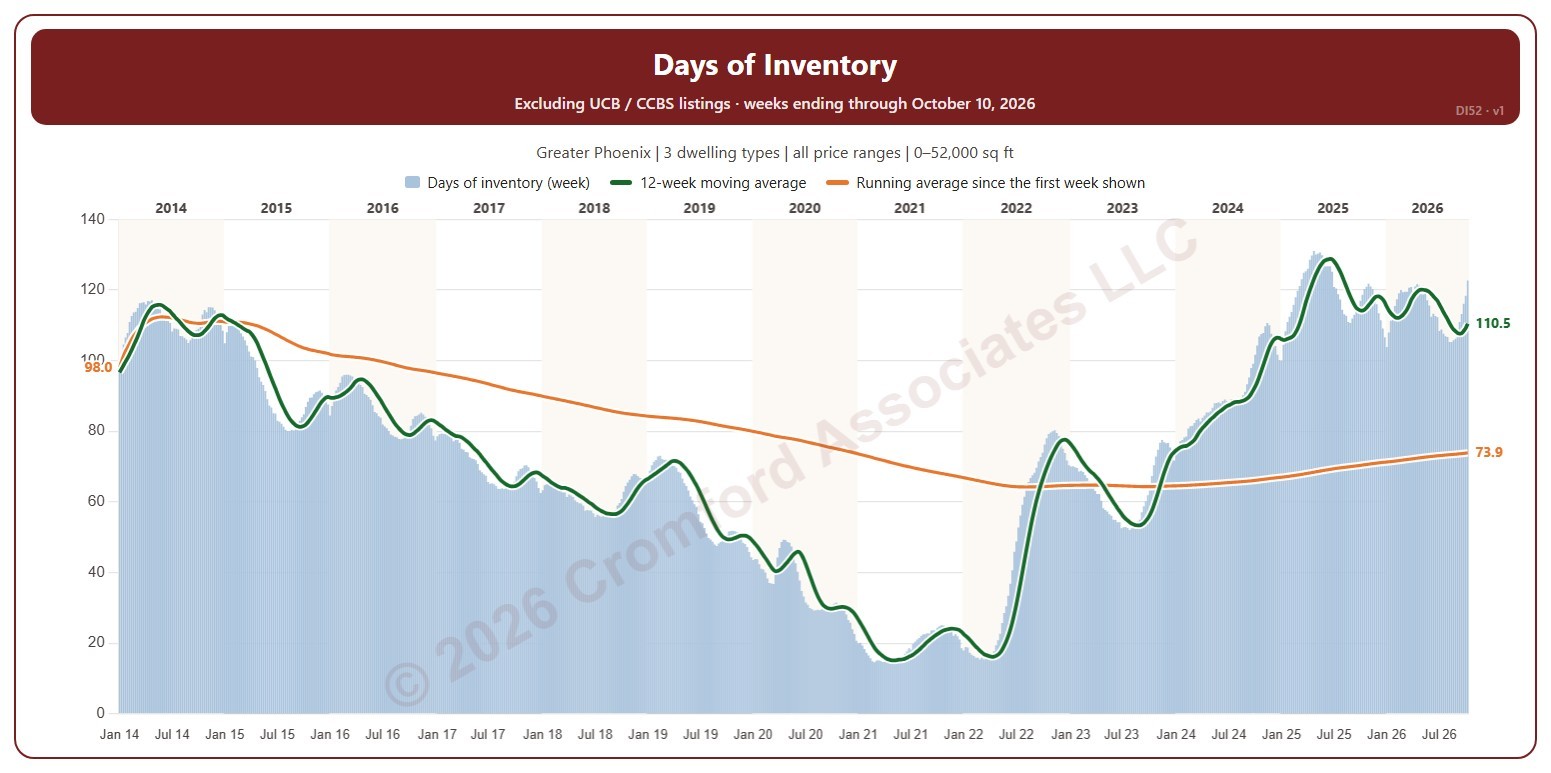
Days of Inventory

About this chart

This chart shows days of inventory each week: how many days the homes for sale would last at the pace they have been selling. Each Saturday, the number of active listings on ARMLS is multiplied by 365 and divided by the closings in the year to the day before. It leaves out UCB and CCBS listings and Coming Soon listings, counting active listings only.

The bars are each week’s figure. The green line is the average of the last 12 weeks; the orange line is the average of every week from the first one shown, so it changes with the date range. It opens on January 2014 to date; drag the handles of the date slider under the chart to choose the weeks shown, as far back as January 2011. The chart is updated every week.

It opens on the Greater Phoenix area: the counties, cities, and ZIP codes that make it up are ticked to start with. Tick or untick any of them to change the area, including counties beyond Greater Phoenix. Narrow it further with the Price Range boxes, the Dwelling Type, Transaction Type, and New / Resale boxes, and the home size and year built sliders; both the listings and the closings are narrowed the same way.

Hover over the chart to see the week’s figure, both averages, the active listings, and the closings in the year.

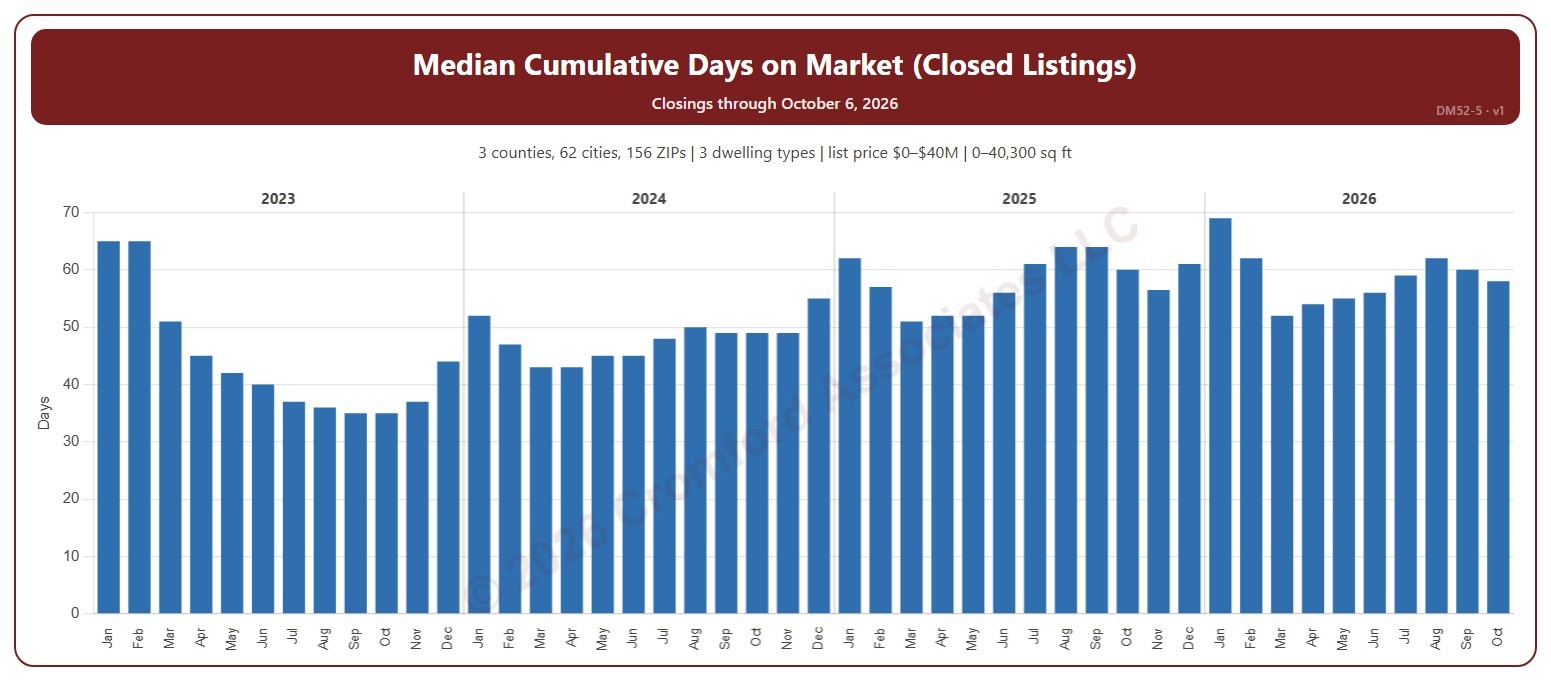
Median Cumulative Days on Market for Closed Listings

About this chart

This chart shows the median cumulative days on market of the homes that closed through ARMLS, one bar per calendar month of closing: half took longer to sell and half less. Cumulative days on market is ARMLS’s own count of the days a home was on the market. The median is less affected than the average by a few homes that sat on the market for a very long time.

It opens on the last four years; tick any year back to 2000 in the Year panel. The newest month is the month so far.

It opens on the Greater Phoenix area: the counties, cities, and ZIP codes that make it up are ticked to start with. Tick or untick any of them to change the area, including counties beyond Greater Phoenix. Narrow it further with the Dwelling Type (condo, mobile, single family), Transaction Type, and New / Resale boxes and the list price, home size, and year built sliders.

Hover over the chart to see the figures for that month.

Weekly Cumulative Days on Market for Closed Listings

About this chart

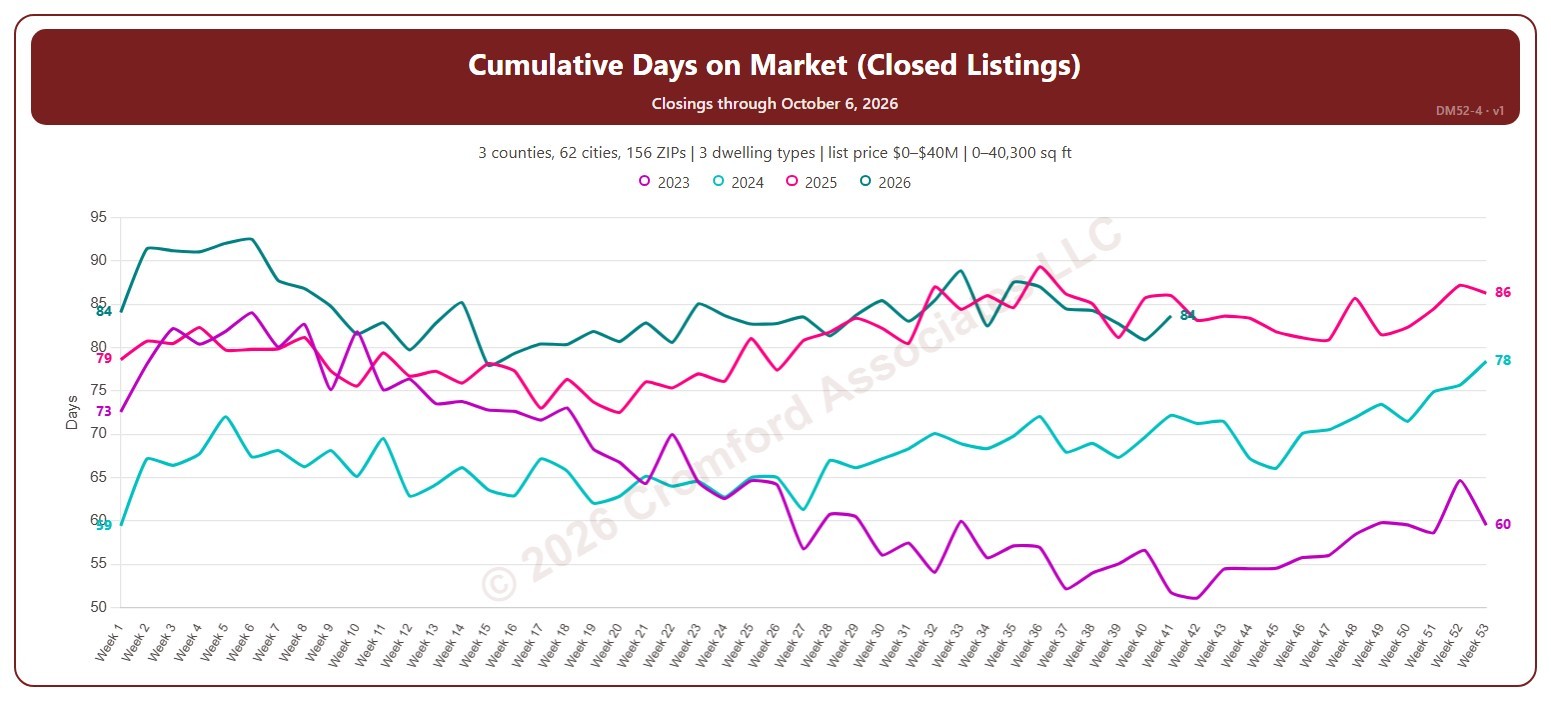
This chart shows the average cumulative days on market of the homes that closed through ARMLS, by week of closing, with one line per year so you can compare the same point in the season. Cumulative days on market is ARMLS’s own count of the days a home was on the market. Weeks start on Sunday, with week 1 being the week that includes January 1.

It opens on the last four years; tick any year back to 2000 in the Year panel. The newest week is the week so far.

It opens on the Greater Phoenix area: the counties, cities, and ZIP codes that make it up are ticked to start with. Tick or untick any of them to change the area, including counties beyond Greater Phoenix. Narrow it further with the Dwelling Type (condo, mobile, single family), Transaction Type, and New / Resale boxes and the list price, home size, and year built sliders.

Hover over the chart to see the figures for that week.
Year-over-Year Change in Average Days on Market for Closed Listings

About this chart

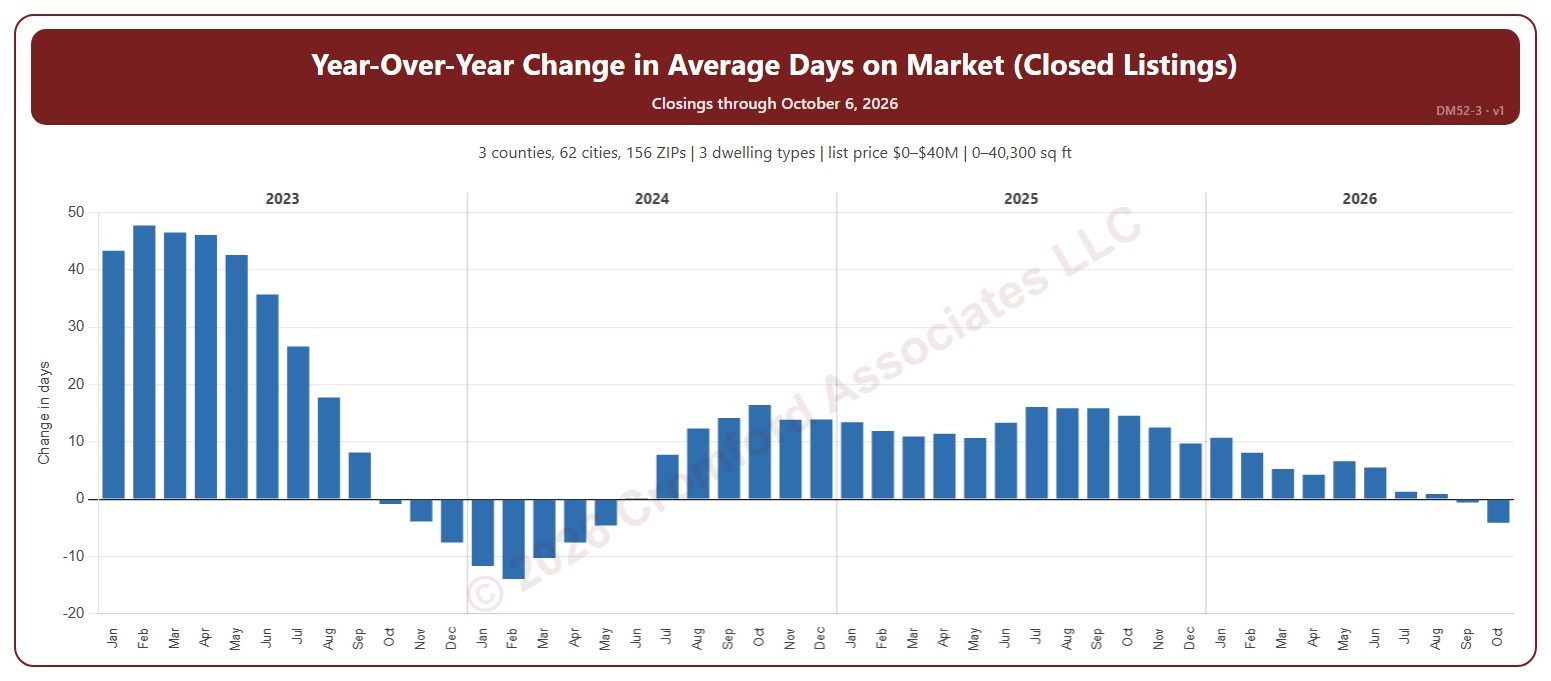
This chart shows the year-over-year change in the average cumulative days on market of the homes that closed through ARMLS: each month’s average compared with the same month a year earlier, in days. Cumulative days on market is ARMLS’s own count of the days a home was on the market. Above zero, homes are taking longer to sell than a year ago; below zero, they are selling faster.

It opens on the last four years; tick any year back to 2000 in the Year panel. The newest month is the month so far.

It opens on the Greater Phoenix area: the counties, cities, and ZIP codes that make it up are ticked to start with. Tick or untick any of them to change the area, including counties beyond Greater Phoenix. Narrow it further with the Dwelling Type (condo, mobile, single family), Transaction Type, and New / Resale boxes and the list price, home size, and year built sliders.

Hover over the chart to see the figures for that month.

Average Cumulative Days on Market for Closed Listings

About this chart

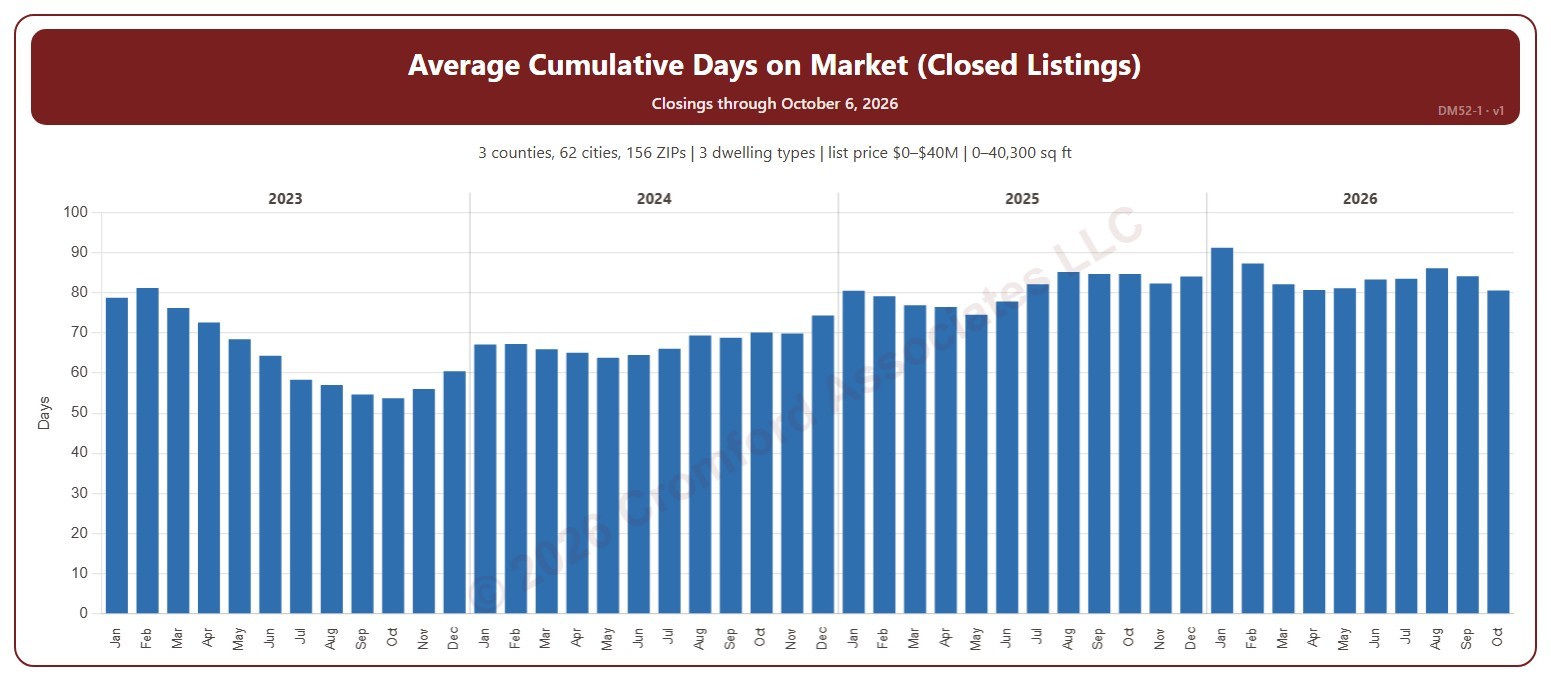
This chart shows the average cumulative days on market of the homes that closed through ARMLS, one bar per calendar month of closing. Cumulative days on market is ARMLS’s own count of the days a home was on the market. Fewer days means homes are selling faster.

It opens on the last four years; tick any year back to 2000 in the Year panel. The newest month is the month so far.

It opens on the Greater Phoenix area: the counties, cities, and ZIP codes that make it up are ticked to start with. Tick or untick any of them to change the area, including counties beyond Greater Phoenix. Narrow it further with the Dwelling Type (condo, mobile, single family), Transaction Type, and New / Resale boxes and the list price, home size, and year built sliders.

Hover over the chart to see the figures for that month.

Median Agent Days on Market at Contract Acceptance

About this chart

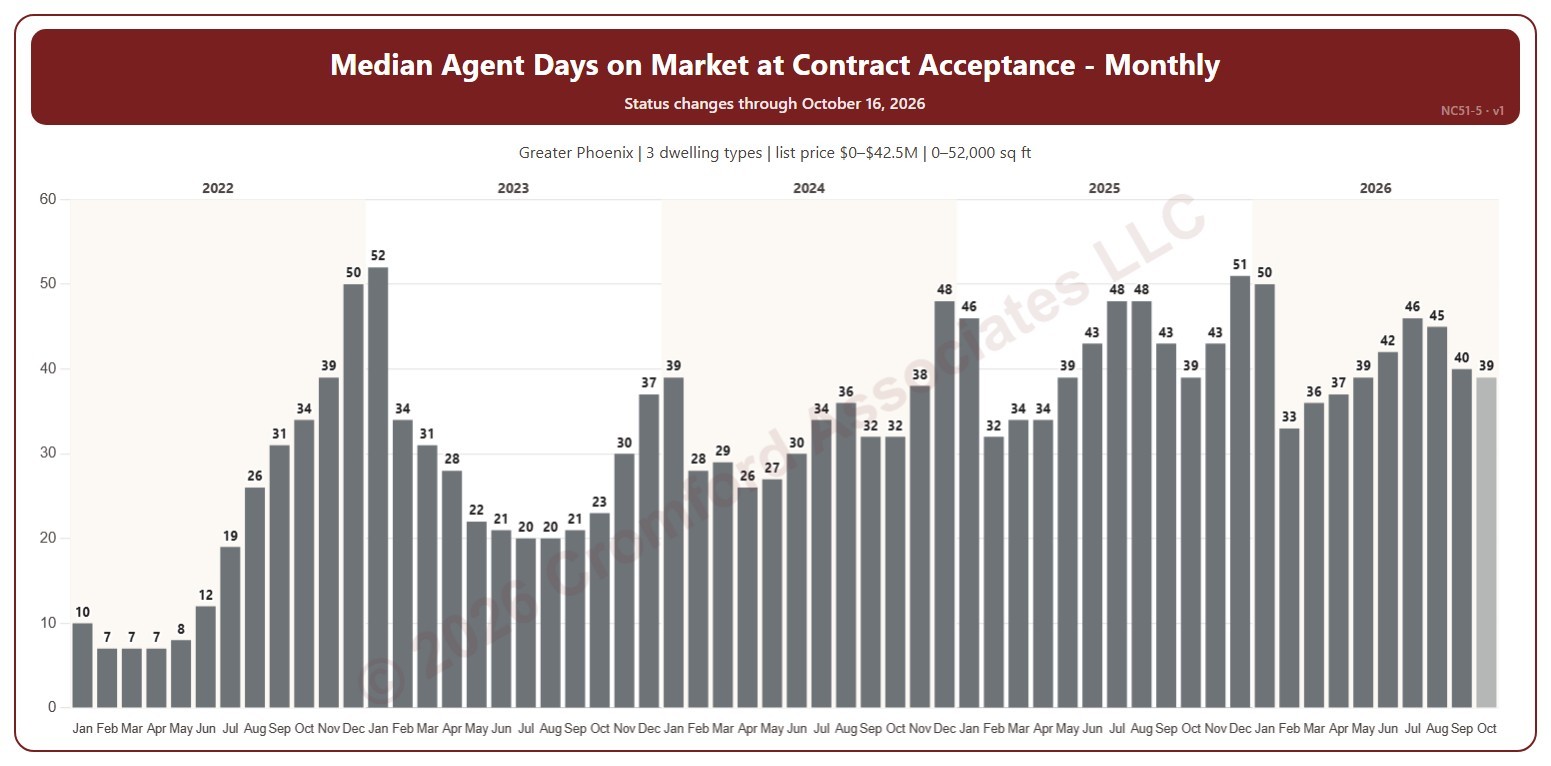
This chart shows the median agent days on market of the listings whose contracts were accepted each month, every month labeled. Agent days on market is the number of days the listing had been on the market under its current listing agreement on the day before its contract was accepted; the median is the middle figure, half longer and half shorter.

It opens on January four years back to date; drag the handles of the date slider under the chart to choose the months shown, as far back as 2014. The chart is updated every week.

It opens on the Greater Phoenix area: the counties, cities, and ZIP codes that make it up are ticked to start with. Tick or untick any of them to change the area, including counties beyond Greater Phoenix. Narrow it further with the Dwelling Type, Transaction Type, and New / Resale boxes and the list price, home size, and year built sliders.

Hover over a bar to see the median and the number of contracts accepted.

Median Agent Days on Market at Contract Acceptance

About this chart

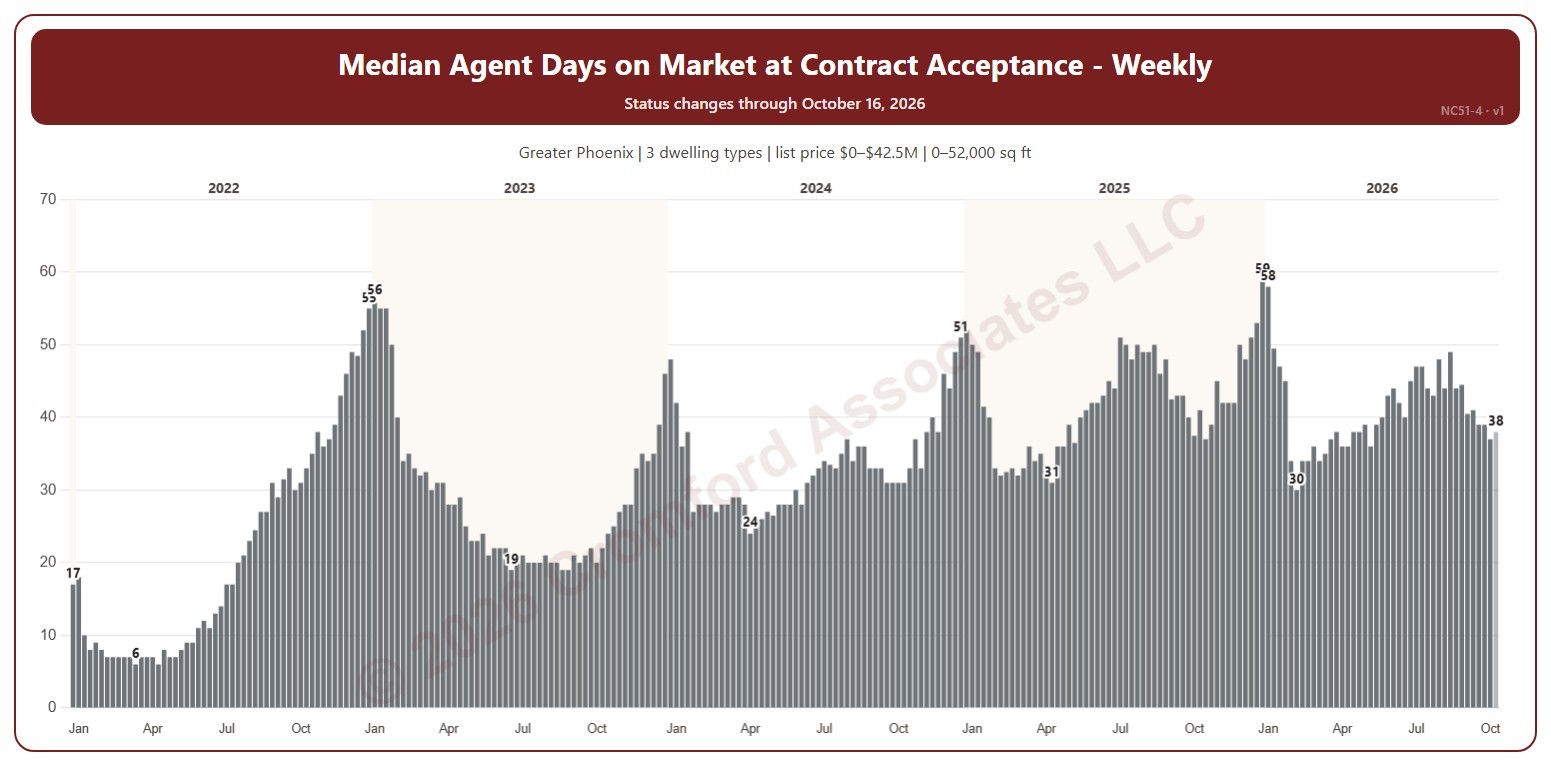
This chart shows the median agent days on market of the listings whose contracts were accepted each week, with each year’s highest and lowest weeks labeled. Agent days on market is the number of days the listing had been on the market under its current listing agreement on the day before its contract was accepted; the median is the middle figure, half longer and half shorter.

Weeks run Sunday to Saturday. It opens on January four years back to date; drag the handles of the date slider under the chart to choose the weeks shown, as far back as 2014. The chart is updated every week.

It opens on the Greater Phoenix area: the counties, cities, and ZIP codes that make it up are ticked to start with. Tick or untick any of them to change the area, including counties beyond Greater Phoenix. Narrow it further with the Dwelling Type, Transaction Type, and New / Resale boxes and the list price, home size, and year built sliders.

Hover over a bar to see the median and the number of contracts accepted.

Accepted Contracts vs. Back on Market

About this chart

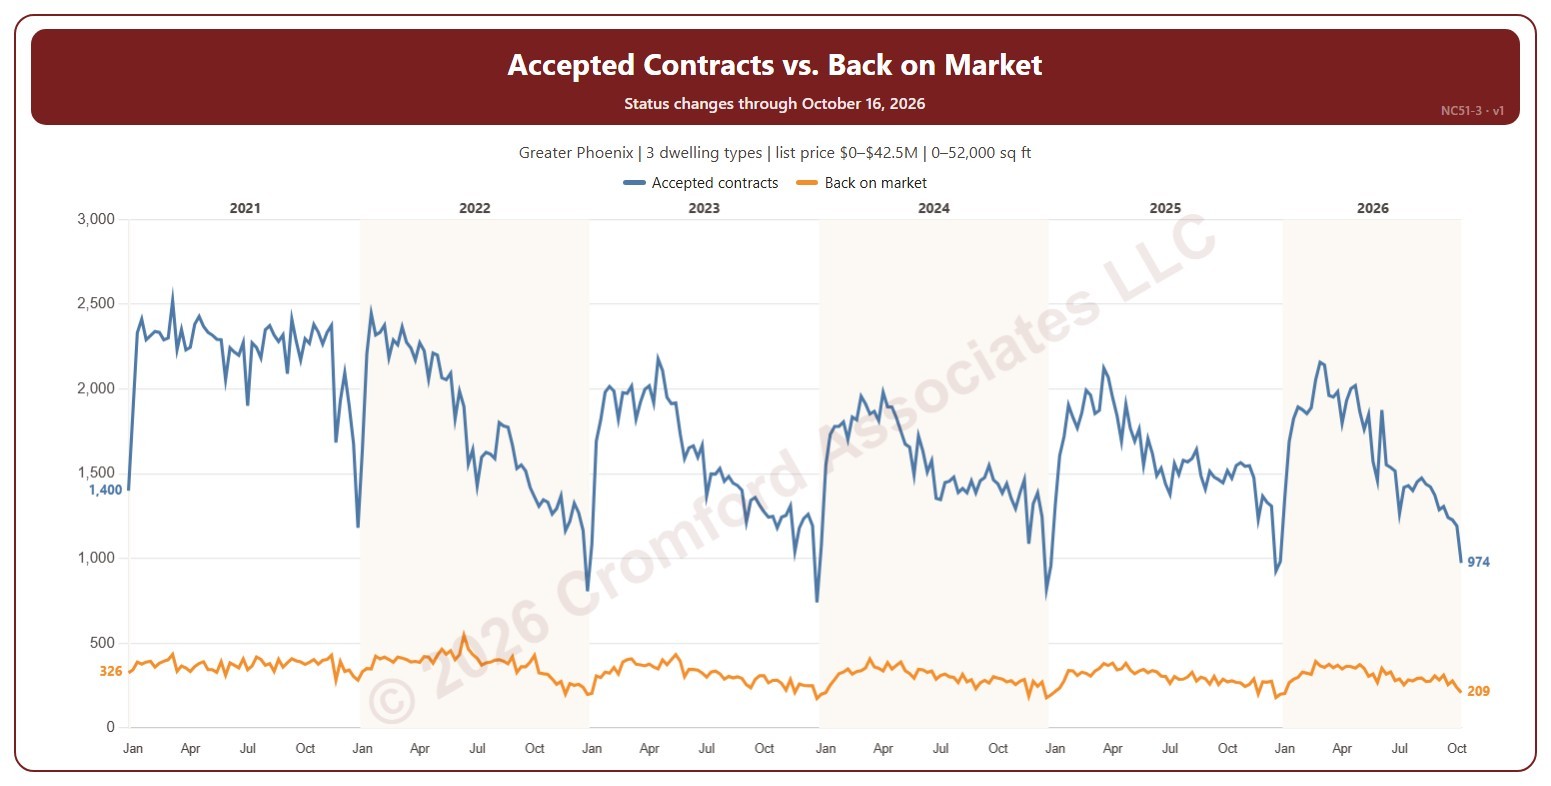
This chart compares, each week, the number of contracts accepted with the number of listings that came back on the market from pending or UCB / CCBS (contracts that fell through or were suspended). An accepted contract is a listing on ARMLS that went from active (or temporarily off the market) to pending or UCB / CCBS, counted on the day the change appeared.

Weeks run Sunday to Saturday. It opens on January five years back to date; drag the handles of the date slider under the chart to choose the weeks shown, as far back as 2014. The chart is updated every week.

It opens on the Greater Phoenix area: the counties, cities, and ZIP codes that make it up are ticked to start with. Tick or untick any of them to change the area, including counties beyond Greater Phoenix. Narrow it further with the Dwelling Type, Transaction Type, and New / Resale boxes and the list price, home size, and year built sliders.

Hover over the chart to see both counts for that week.

Accepted Contracts Weekly by Year

About this chart

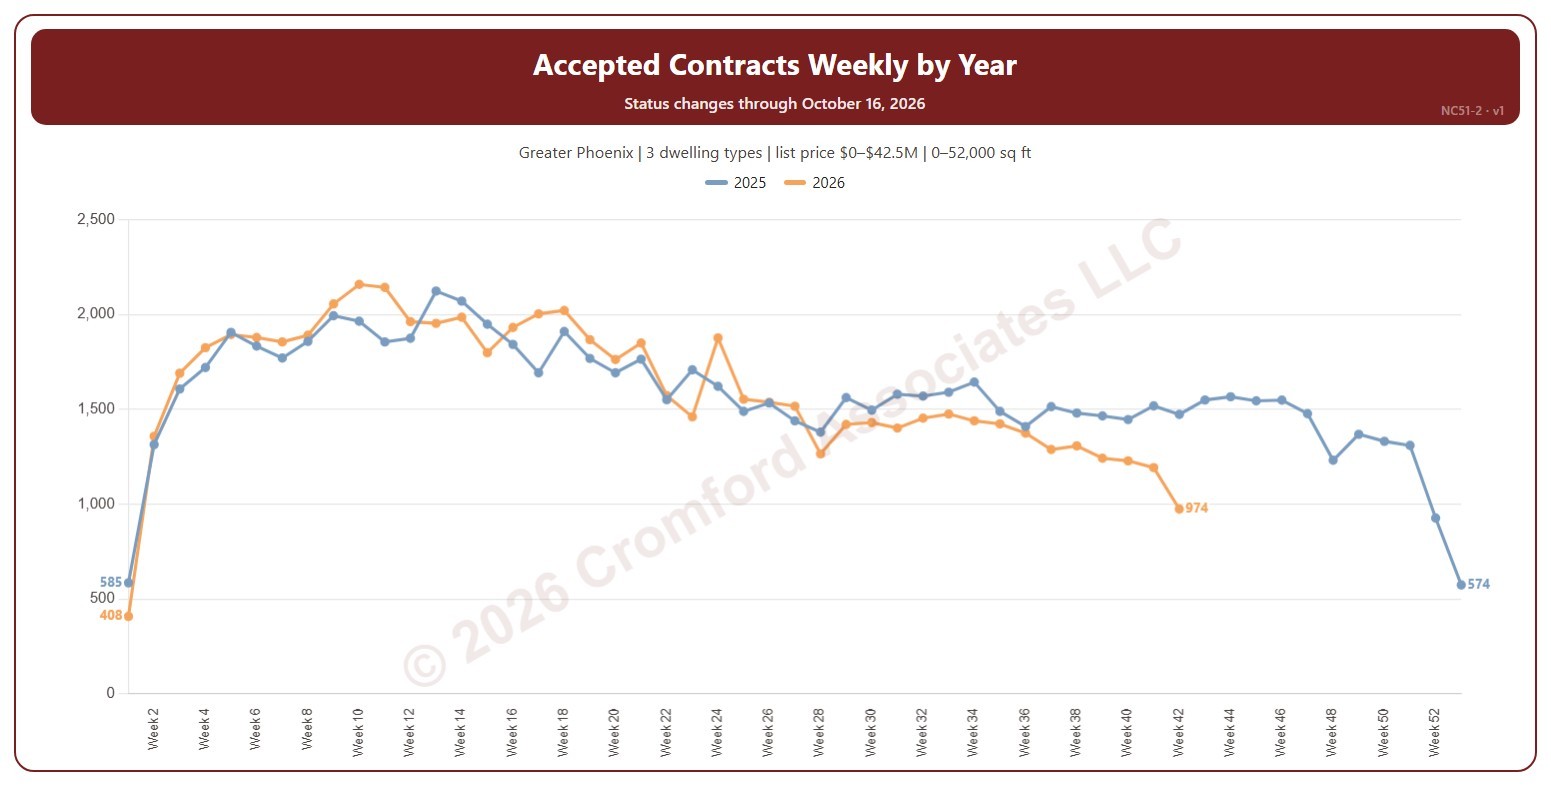
This chart shows the number of contracts accepted each week, a line per year by week number, so this year can be read against earlier years. An accepted contract is a listing on ARMLS that went from active (or temporarily off the market) to pending or UCB / CCBS, counted on the day the change appeared.

Weeks run Sunday to Saturday. Week 1 of each year starts on 1 January, so the first and last weeks of a year can be short. It opens on the latest 2 years; tick other years in the Year box to go back as far as 2014. The chart is updated every week.

It opens on the Greater Phoenix area: the counties, cities, and ZIP codes that make it up are ticked to start with. Tick or untick any of them to change the area, including counties beyond Greater Phoenix. Narrow it further with the Dwelling Type, Transaction Type, and New / Resale boxes and the list price, home size, and year built sliders.

Hover over the chart to see each year’s count for that week.