About this chart
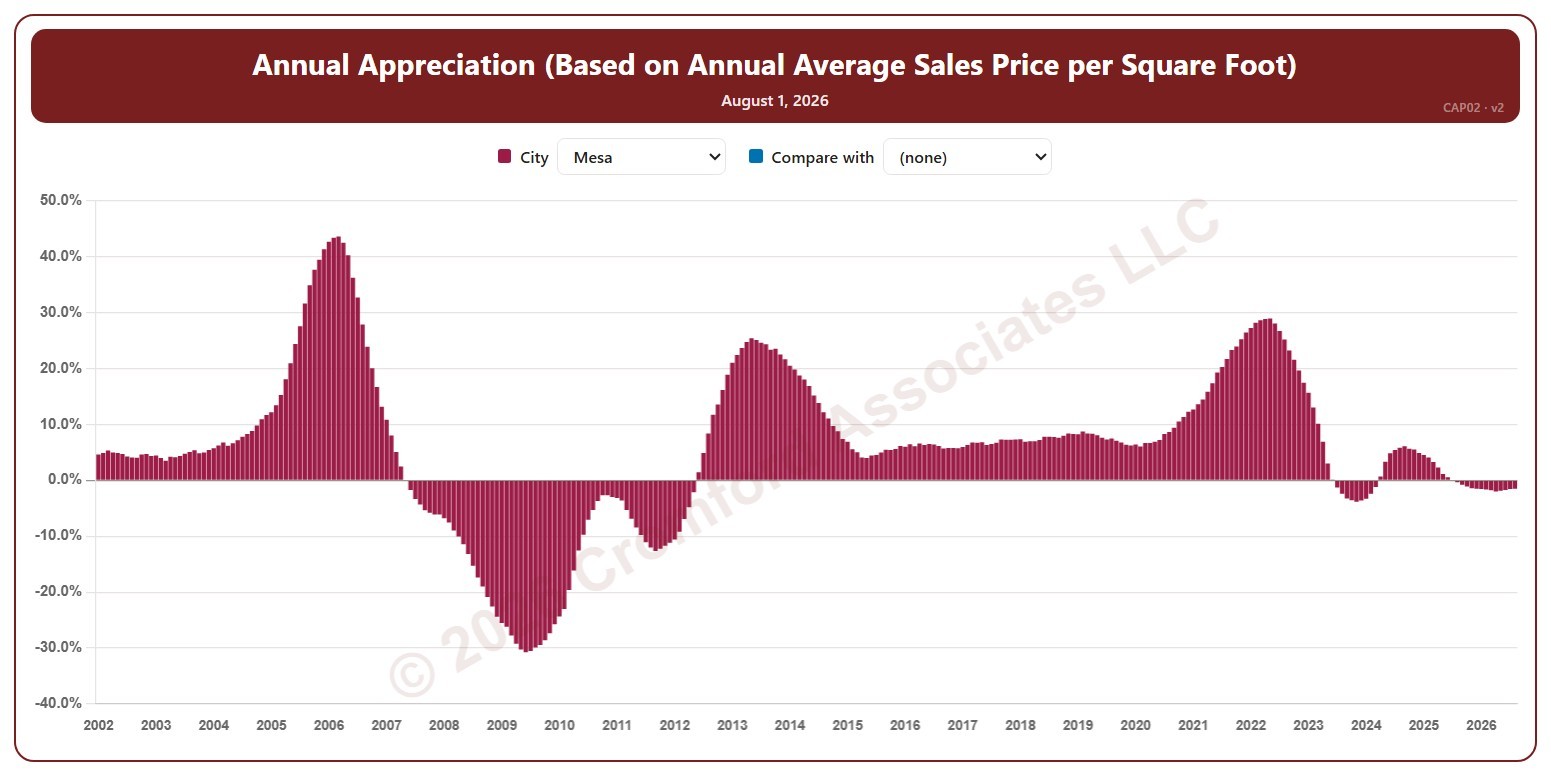
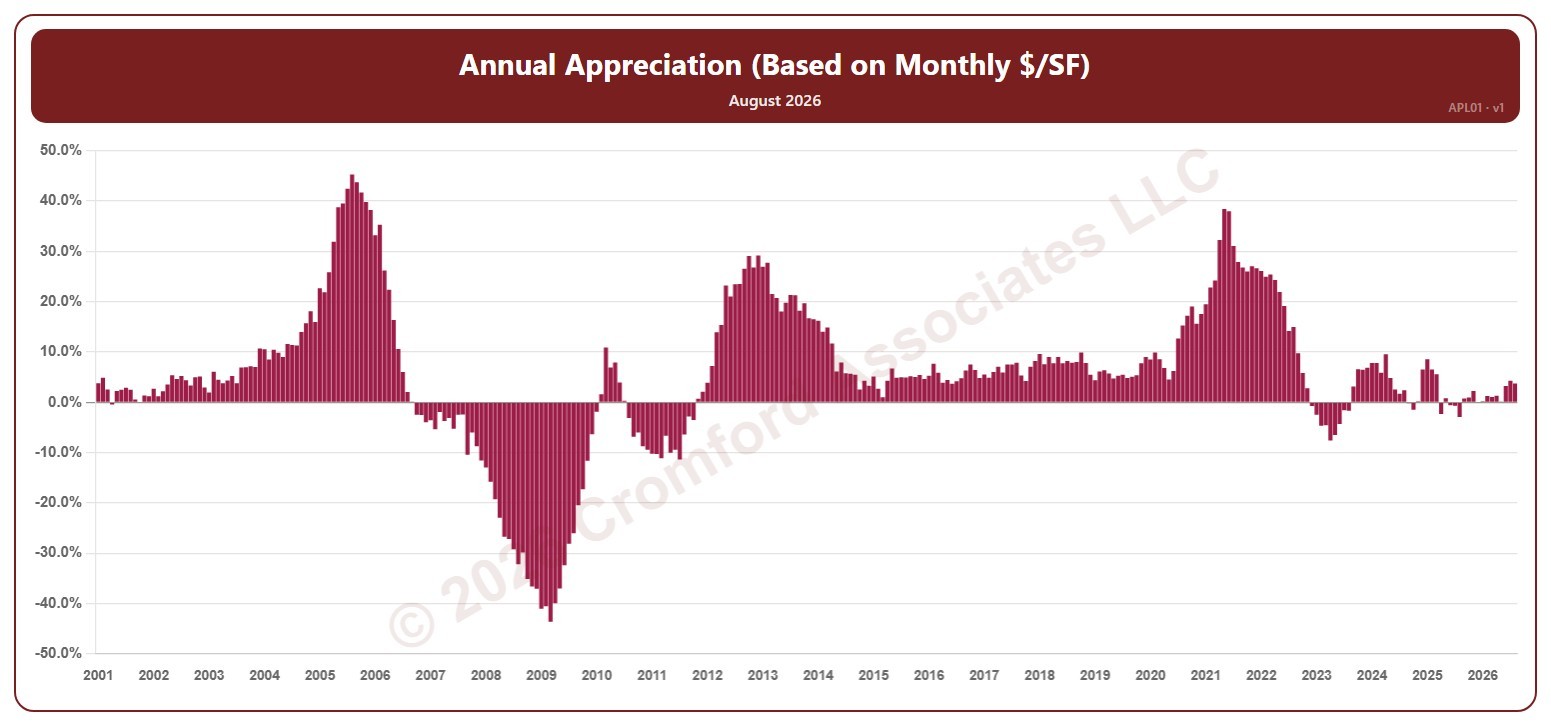
This chart shows annual appreciation, for the whole ARMLS market, all areas and all dwelling types, as one bar per month since January 2001: the change in a month’s average sales price per square foot compared with the same month a year earlier. Above zero, prices are higher than a year ago; below zero, they are lower.
Hover over a bar to see the exact figure for that month.