Monthly Median Sales Price

About this chart

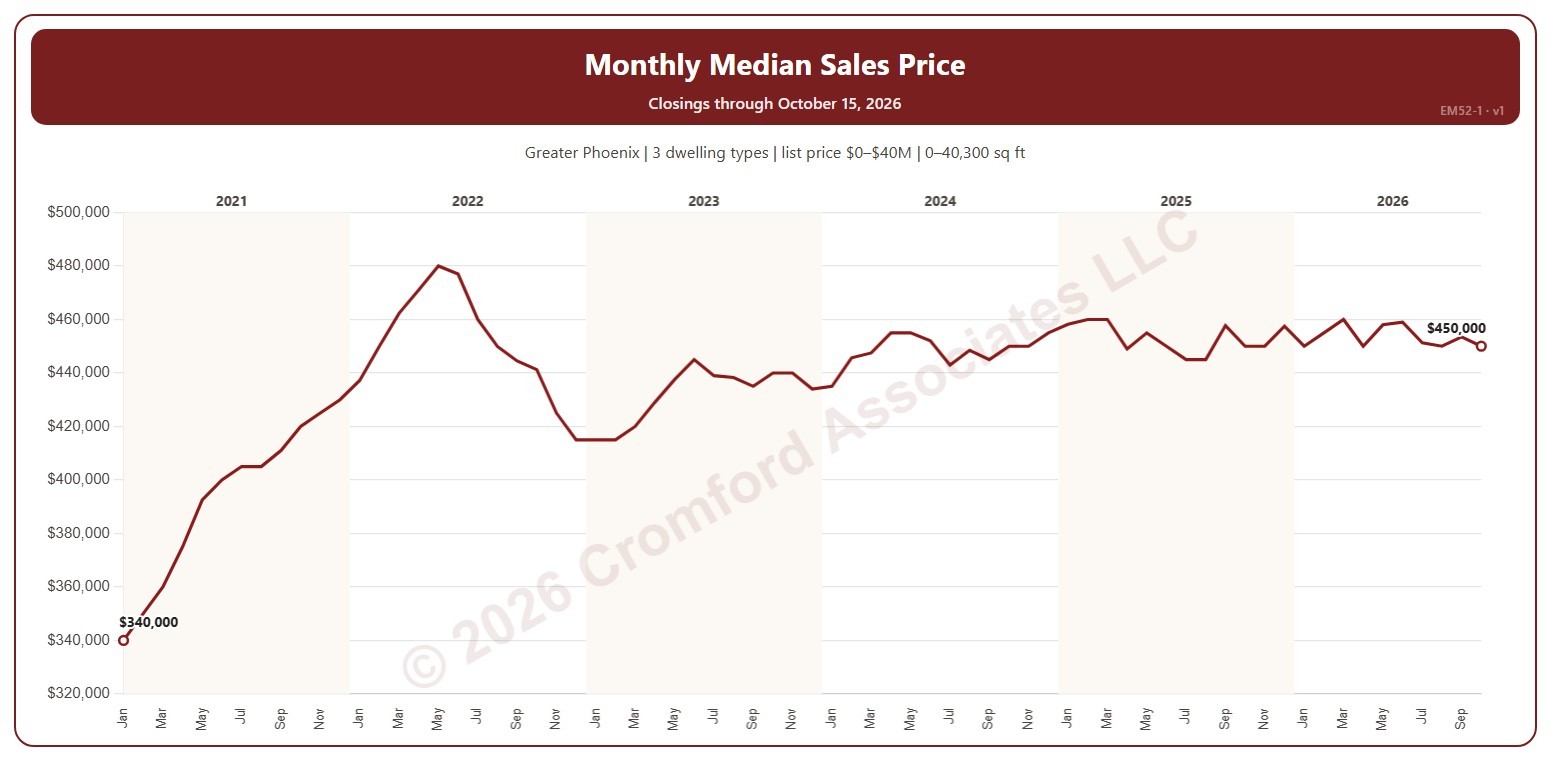
This chart shows the median sales price each month. The median sales price is the middle sale price of the homes that closed on ARMLS in the period: half sold for more and half for less. New homes are included.

It opens on January 2021 to date; drag the handles of the date slider under the chart to choose the months shown, as far back as January 2000. The newest month is the month so far. The chart is updated every day.

It opens on the Greater Phoenix area: the counties, cities, and ZIP codes that make it up are ticked to start with. Tick or untick any of them to change the area, including counties beyond Greater Phoenix. Narrow it further with the Dwelling Type, Transaction Type, and New / Resale boxes and the list price, home size, and year built sliders.

Hover over the line to see the median, the lowest and highest sale, and the number of closings that month.
Percentage Annual Change in Monthly Median Sales Price by Region

About this chart

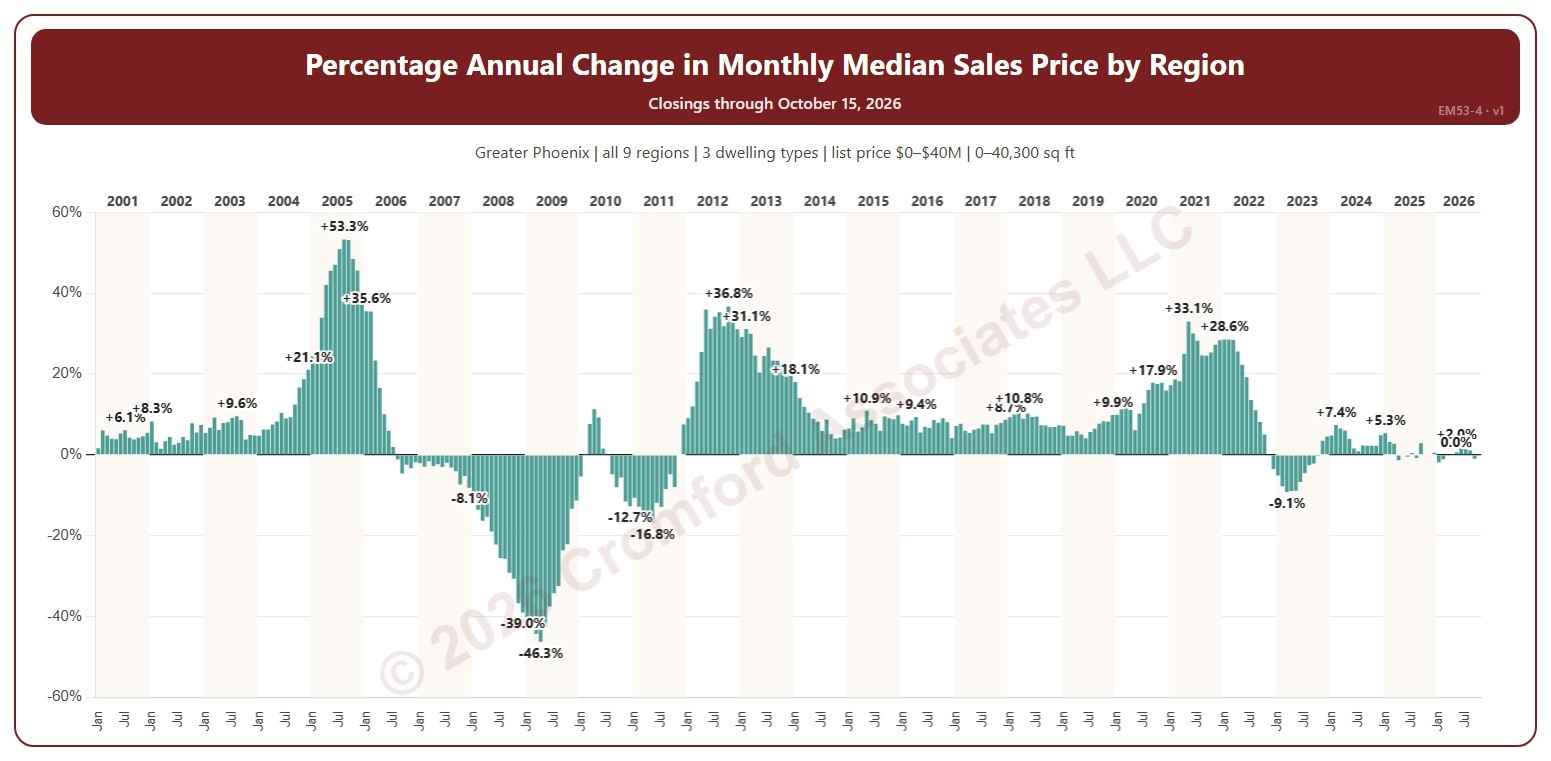
This chart shows the change in the median sales price from the same month a year earlier, as a percentage: above zero, prices were higher than a year before; below zero, lower. Each year’s largest change and the newest month are labeled. The median sales price is the middle sale price of the homes that closed on ARMLS in the period: half sold for more and half for less.

It opens on January 2001 to date; drag the handles of the date slider under the chart to choose the months shown. The newest month is the month so far. The chart is updated every day.

It opens on the Greater Phoenix area: the counties, cities, and ZIP codes that make it up are ticked to start with. Tick or untick any of them to change the area, including counties beyond Greater Phoenix. Use the Region boxes to pick any of the nine Greater Phoenix regions; Other areas (unticked to start with) adds ZIP codes outside them, needed if you widen the area beyond Greater Phoenix. Narrow it further with the Dwelling Type, Transaction Type, and New / Resale boxes and the list price, home size, and year built sliders.

Hover over a bar to see the change and both months’ medians.

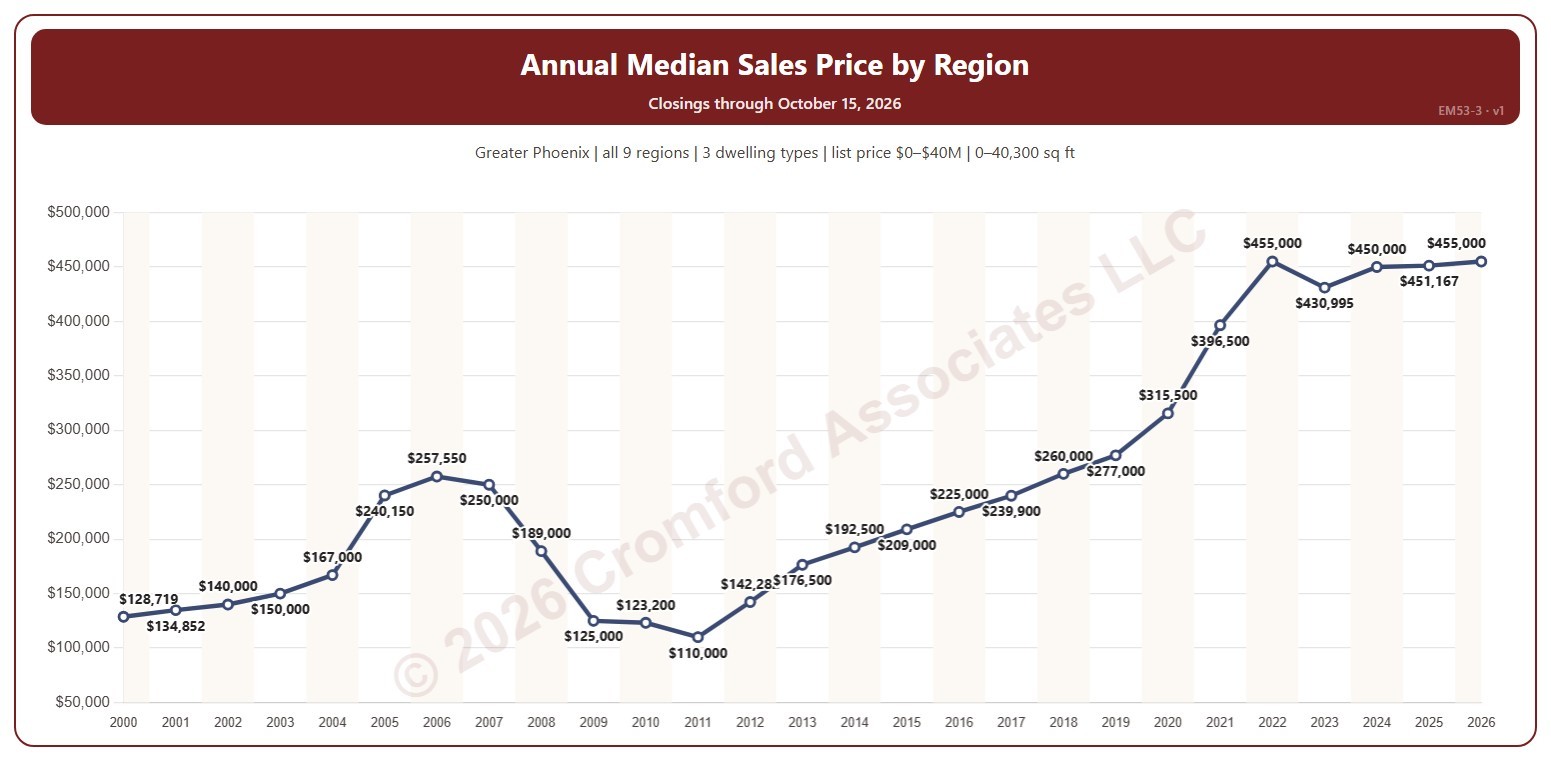
Annual Median Sales Price by Region

About this chart

This chart shows the median sales price each year, every year labeled. The median sales price is the middle sale price of the homes that closed on ARMLS in the period: half sold for more and half for less.

It opens on 2000 to date; drag the handles of the date slider under the chart to choose the years shown. The newest year is the year so far. The chart is updated every day.

It opens on the Greater Phoenix area: the counties, cities, and ZIP codes that make it up are ticked to start with. Tick or untick any of them to change the area, including counties beyond Greater Phoenix. Use the Region boxes to pick any of the nine Greater Phoenix regions; Other areas (unticked to start with) adds ZIP codes outside them, needed if you widen the area beyond Greater Phoenix. Narrow it further with the Dwelling Type, Transaction Type, and New / Resale boxes and the list price, home size, and year built sliders.

Hover over the line to see the median and the number of closings that year.

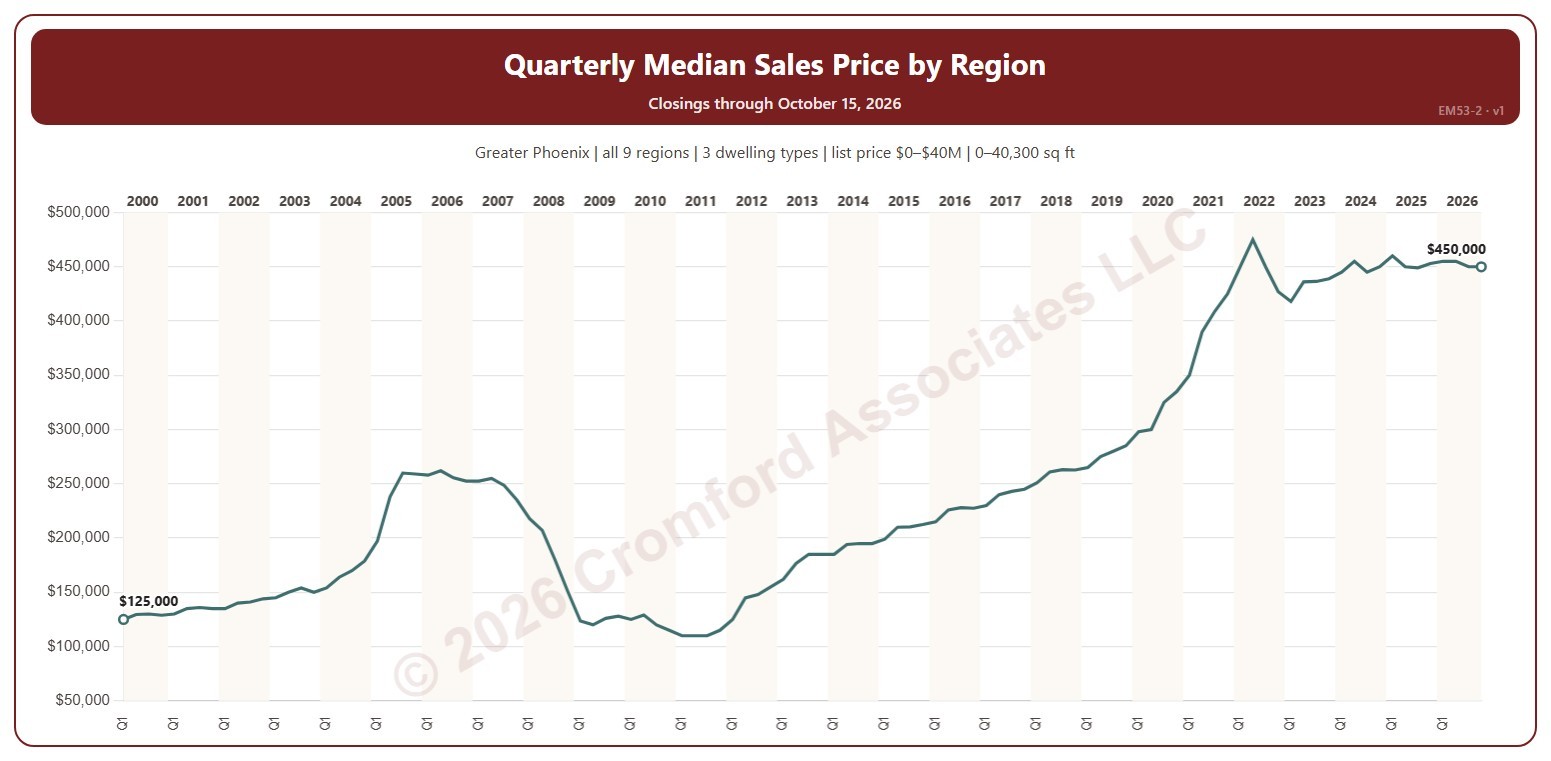
Quarterly Median Sales Price by Region

About this chart

This chart shows the median sales price each quarter. The median sales price is the middle sale price of the homes that closed on ARMLS in the period: half sold for more and half for less.

It opens on the first quarter of 2000 to date; drag the handles of the date slider under the chart to choose the quarters shown. The newest quarter is the quarter so far. The chart is updated every day.

It opens on the Greater Phoenix area: the counties, cities, and ZIP codes that make it up are ticked to start with. Tick or untick any of them to change the area, including counties beyond Greater Phoenix. Use the Region boxes to pick any of the nine Greater Phoenix regions; Other areas (unticked to start with) adds ZIP codes outside them, needed if you widen the area beyond Greater Phoenix. Narrow it further with the Dwelling Type, Transaction Type, and New / Resale boxes and the list price, home size, and year built sliders.

Hover over the line to see the median and the number of closings that quarter.

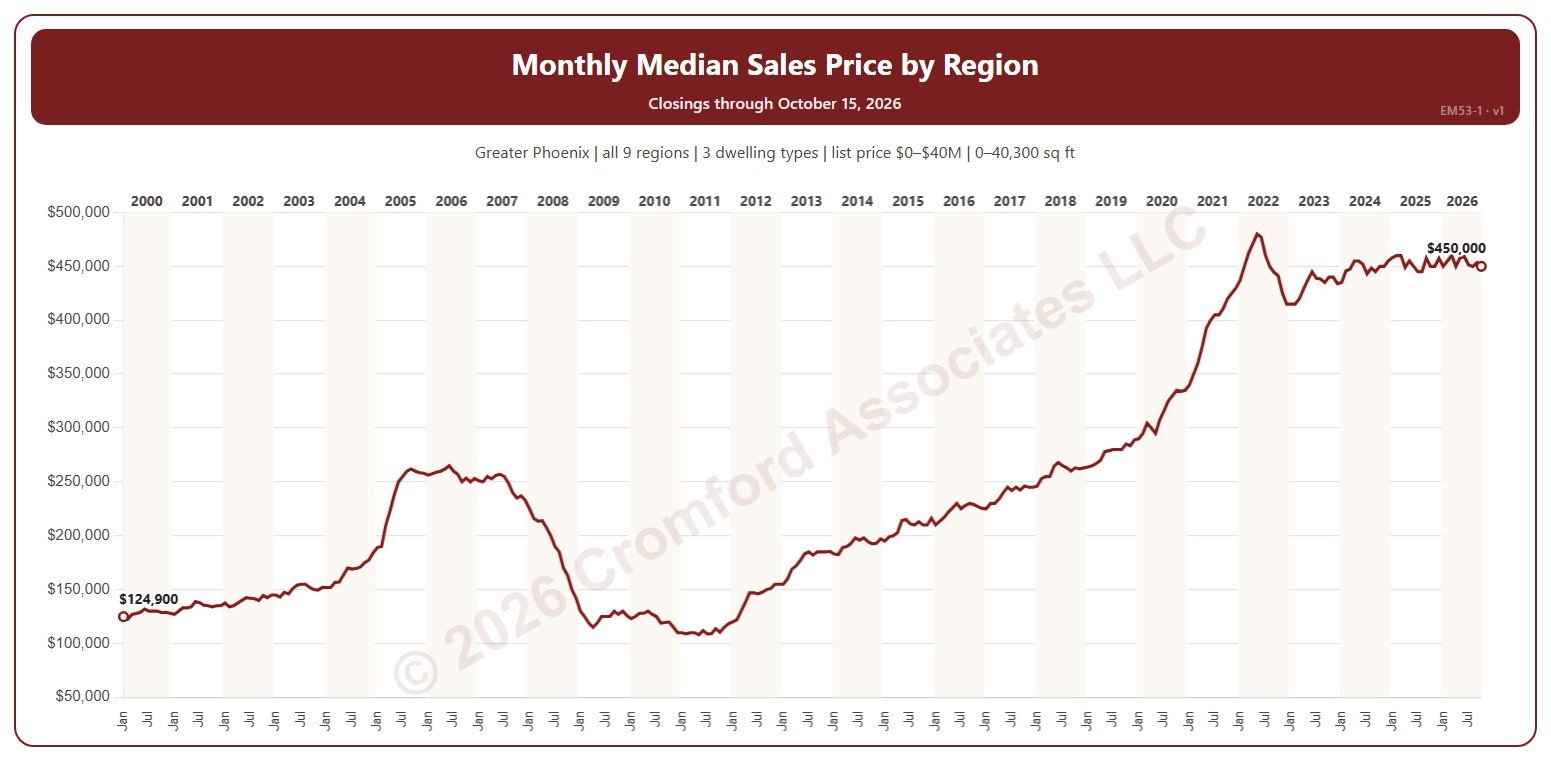
Monthly Median Sales Price by Region

About this chart

This chart shows the median sales price each month. The median sales price is the middle sale price of the homes that closed on ARMLS in the period: half sold for more and half for less.

It opens on January 2000 to date; drag the handles of the date slider under the chart to choose the months shown. The newest month is the month so far. The chart is updated every day.

It opens on the Greater Phoenix area: the counties, cities, and ZIP codes that make it up are ticked to start with. Tick or untick any of them to change the area, including counties beyond Greater Phoenix. Use the Region boxes to pick any of the nine Greater Phoenix regions; Other areas (unticked to start with) adds ZIP codes outside them, needed if you widen the area beyond Greater Phoenix. Narrow it further with the Dwelling Type, Transaction Type, and New / Resale boxes and the list price, home size, and year built sliders.

Hover over the line to see the median and the number of closings that month.
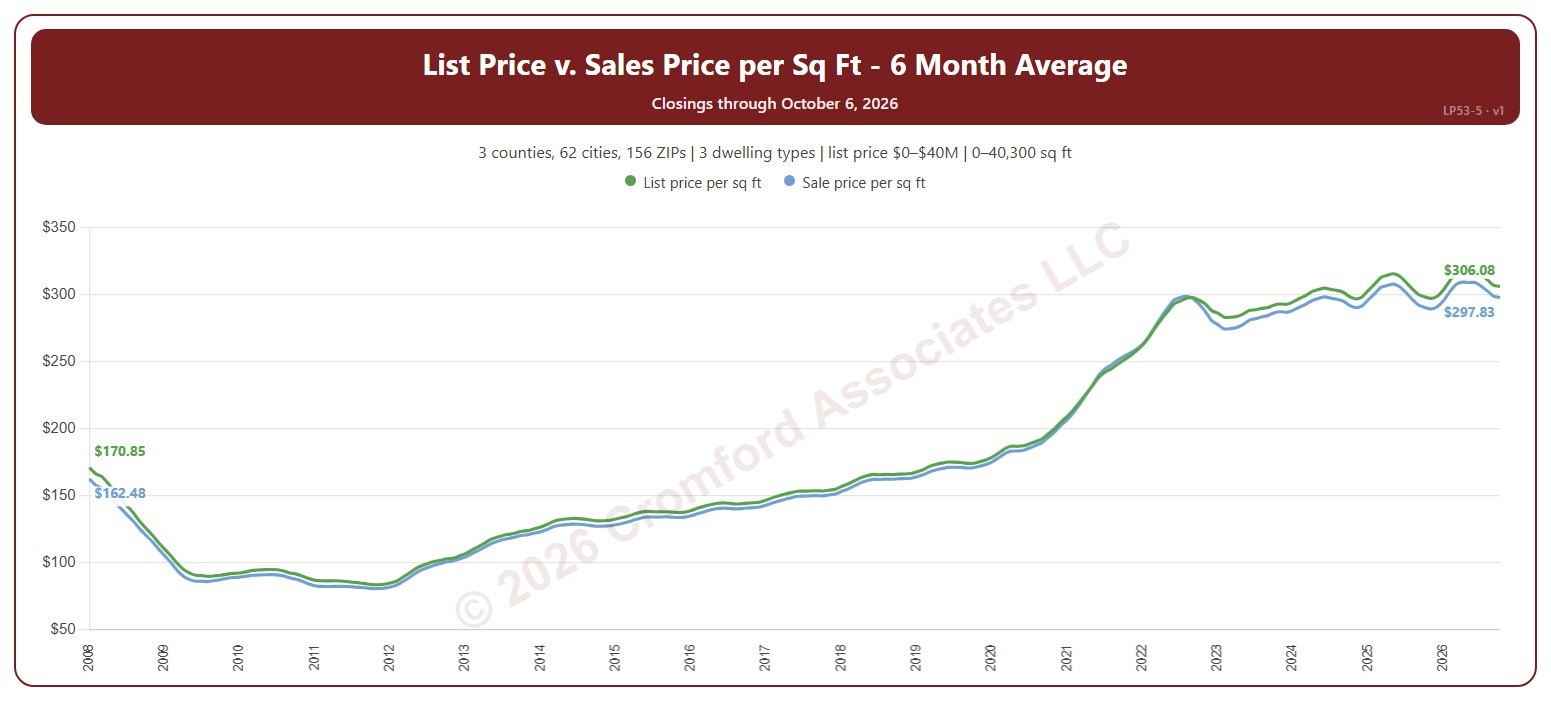
List Price and Sales Price per Square Foot – 6 Month Average

About this chart

This chart shows two lines for the homes that closed through ARMLS: the list price per square foot and the sale price per square foot, over the 6 months ending with each month. The gap between them shows how far below (or above) their asking price homes are selling. Averaging over six months smooths out the month-to-month swings while still reacting faster than a 12-month average.

It opens on the years since 2008; tick any year back to 2000 in the Year panel. The newest month is the month so far.

It opens on the Greater Phoenix area: the counties, cities, and ZIP codes that make it up are ticked to start with. Tick or untick any of them to change the area, including counties beyond Greater Phoenix. Narrow it further with the Dwelling Type (condo, mobile, single family), Transaction Type, and New / Resale boxes and the list price, home size, and year built sliders.

Hover over the chart to see the figures for that month.

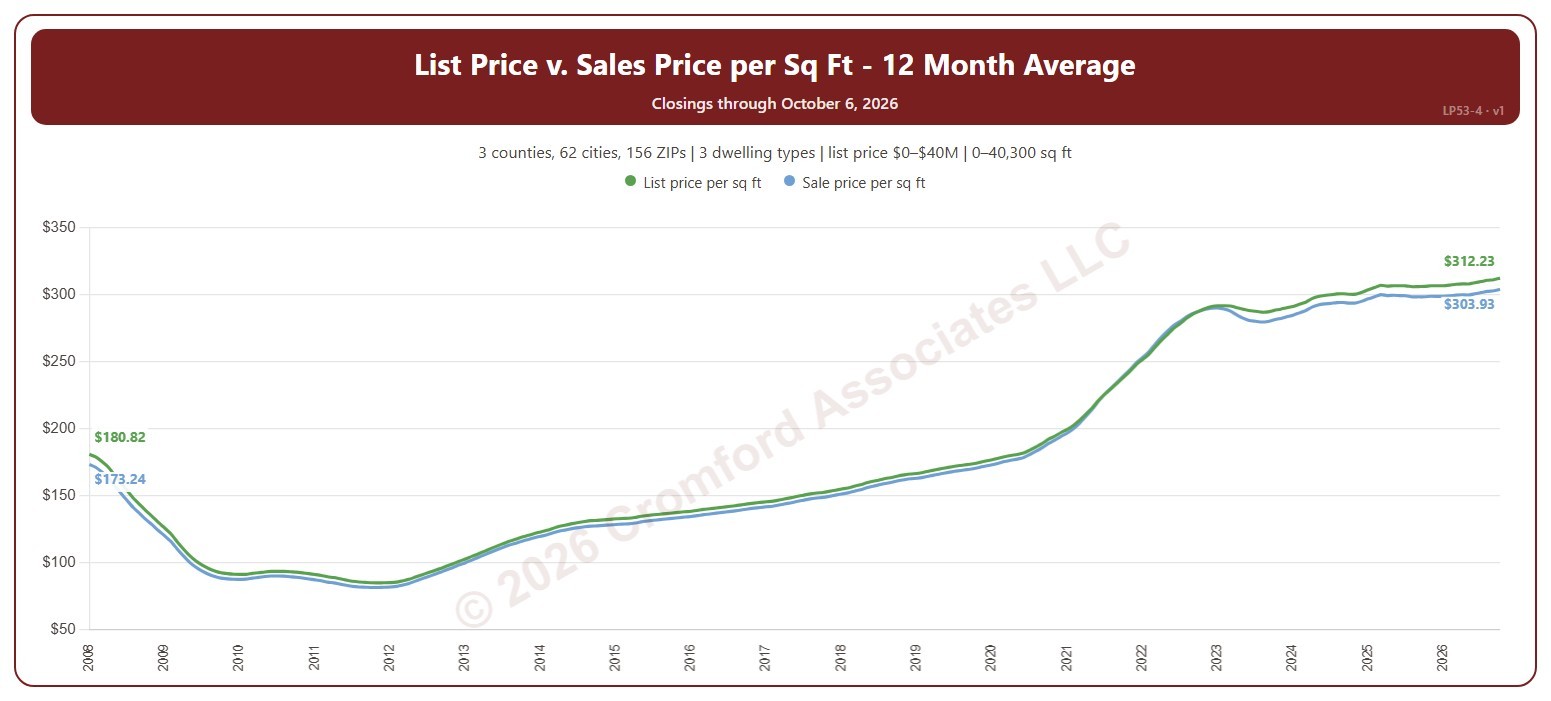
List Price vs. Sale Price per Square Foot – 12 Month Average

About this chart

This chart shows two lines for the homes that closed through ARMLS: the list price per square foot and the sale price per square foot, over the 12 months ending with each month. The gap between them shows how far below (or above) their asking price homes are selling. Averaging over a year smooths out the seasonal swings.

It opens on the years since 2008; tick any year back to 2000 in the Year panel. The newest month is the month so far.

It opens on the Greater Phoenix area: the counties, cities, and ZIP codes that make it up are ticked to start with. Tick or untick any of them to change the area, including counties beyond Greater Phoenix. Narrow it further with the Dwelling Type (condo, mobile, single family), Transaction Type, and New / Resale boxes and the list price, home size, and year built sliders.

Hover over the chart to see the figures for that month.

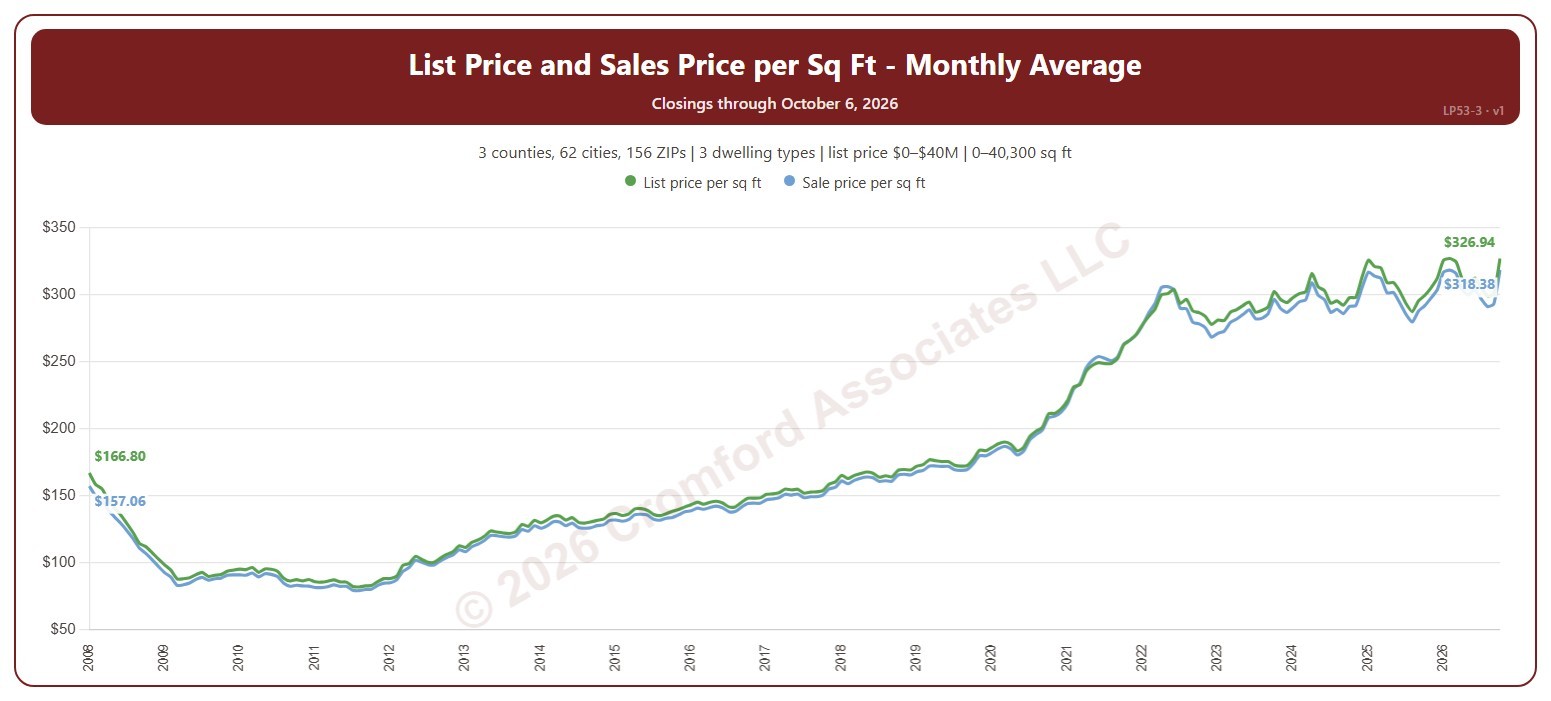
List Price and Sales Price per Square Foot

About this chart

This chart shows two lines for the homes that closed through ARMLS: the list price per square foot and the sale price per square foot, each calendar month. The gap between them shows how far below (or above) their asking price homes are selling.

It opens on the years since 2008; tick any year back to 2000 in the Year panel. The newest month is the month so far.

It opens on the Greater Phoenix area: the counties, cities, and ZIP codes that make it up are ticked to start with. Tick or untick any of them to change the area, including counties beyond Greater Phoenix. Narrow it further with the Dwelling Type (condo, mobile, single family), Transaction Type, and New / Resale boxes and the list price, home size, and year built sliders.

Hover over the chart to see the figures for that month.

Sales Price to List Price Ratio – Monthly

About this chart

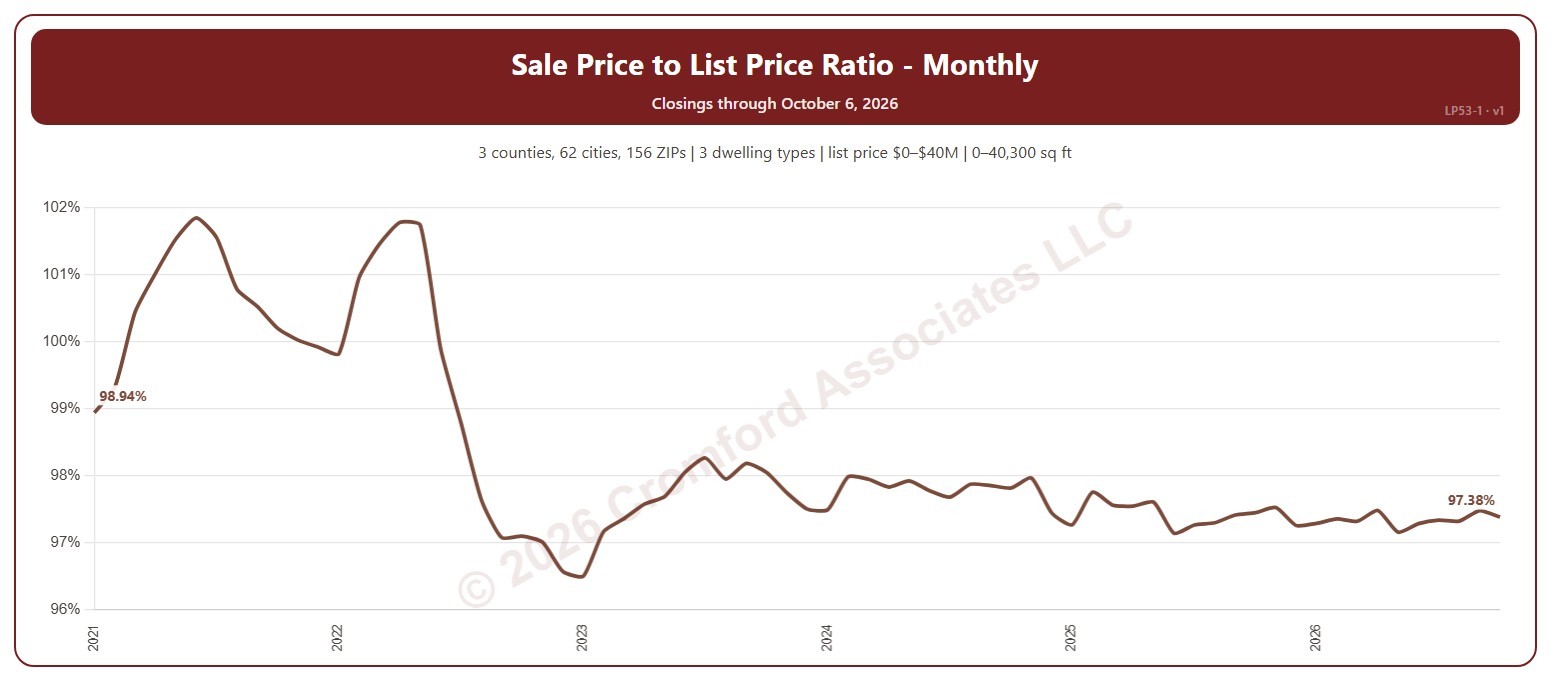
This chart shows the sale price to list price ratio of the homes that closed through ARMLS each calendar month: the total of the sale prices as a percentage of the total of the final list prices. Above 100%, homes are selling for more than their asking price on average; below 100%, buyers are negotiating prices down.

It opens on the years since 2021; tick any year back to 2000 in the Year panel. The newest month is the month so far.

It opens on the Greater Phoenix area: the counties, cities, and ZIP codes that make it up are ticked to start with. Tick or untick any of them to change the area, including counties beyond Greater Phoenix. Narrow it further with the Dwelling Type (condo, mobile, single family), Transaction Type, and New / Resale boxes and the list price, home size, and year built sliders.

Hover over the chart to see the figures for that month.

Seasonal Patterns – New Listings by Calendar Month

About this chart

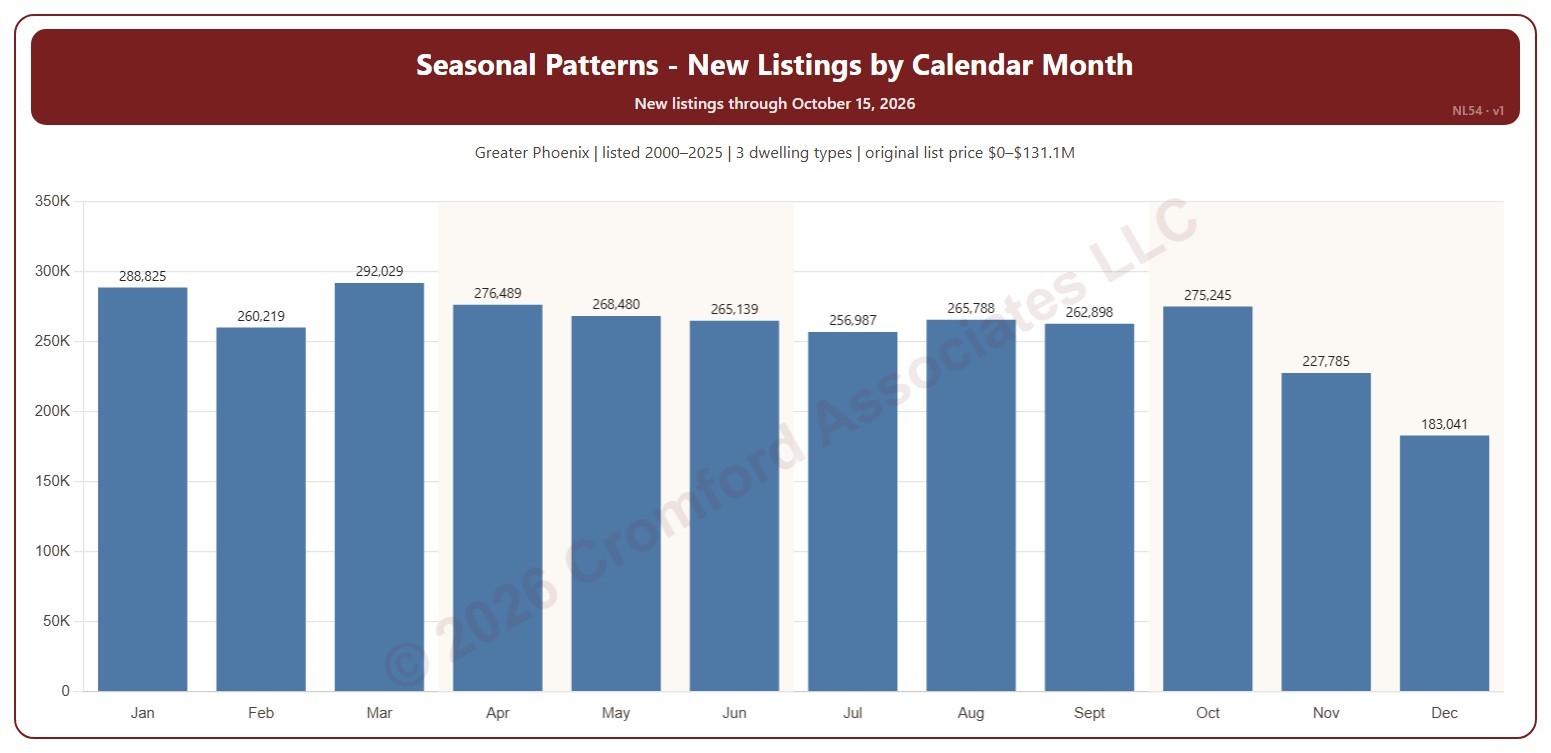
This chart shows the seasonal pattern of new listings: the number of listings on ARMLS by the calendar month they were listed, January to December, added up over the years ticked. A new listing is any listing, counted on the date it was listed, whatever happened to it afterwards.

It opens on 2000 to the last complete year; tick or untick years in the Year box to change them. The current year can be added, but its later months are not in yet, so it makes the early months look stronger. The chart is updated every week.

It opens on the Greater Phoenix area: the counties, cities, and ZIP codes that make it up are ticked to start with. Tick or untick any of them to change the area, including counties beyond Greater Phoenix. Narrow it further with the Dwelling Type, Transaction Type, and New / Resale boxes and the original list price, home size, and year built sliders.

Hover over a bar to see the month’s total and the average for one year.