Monthly Home Sales

About this chart

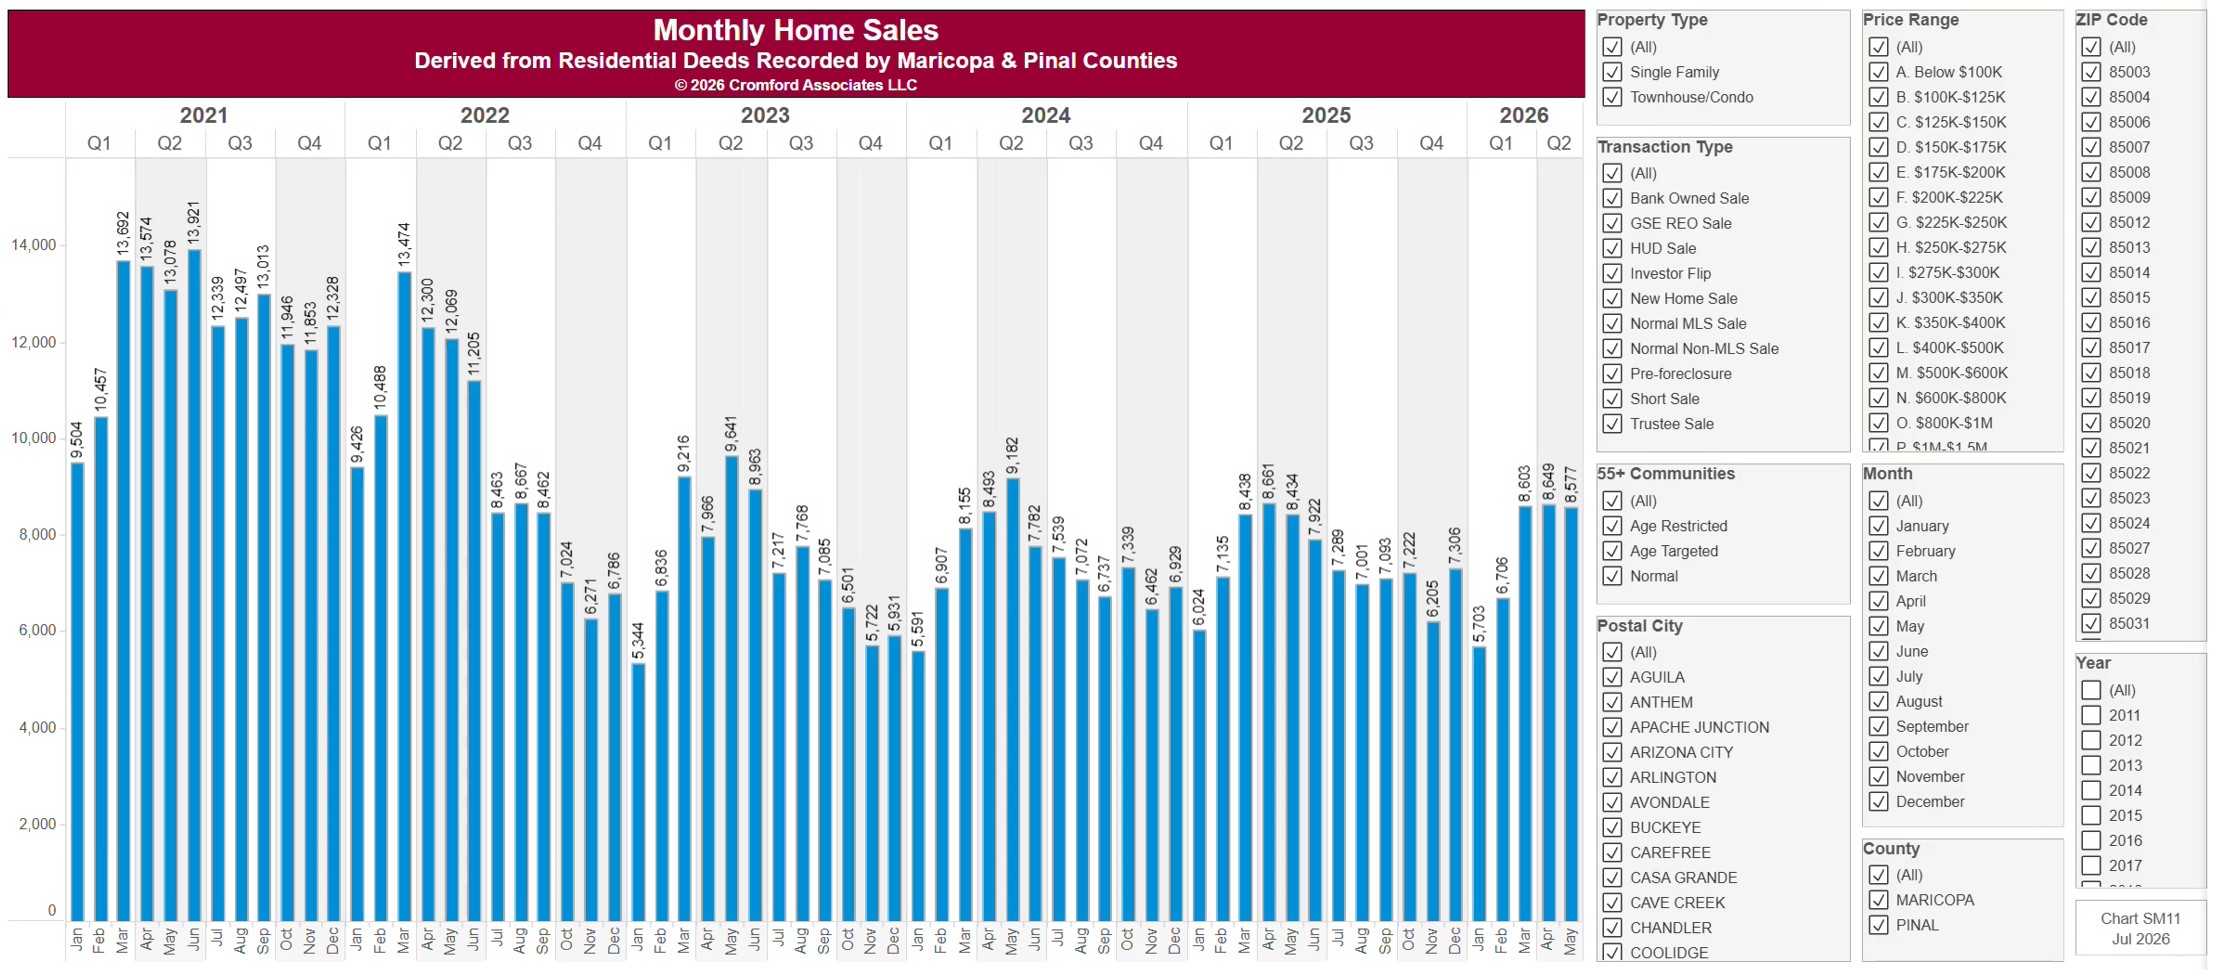
This chart counts the homes sold each calendar month since January 2011, from residential deeds recorded by Maricopa and Pinal Counties. Because it is built from recorded deeds, it covers every recorded sale, not just homes listed on ARMLS: new homes, private sales, and investor deals are all included.

It opens on Maricopa and Pinal Counties with everything included. Narrow it with the County, City, and ZIP panels, the Transaction Type, Property Type, and 55+ Communities boxes, and the sale price slider. Untick years in the Year panel to drop them from the chart.

The records run to the end of last month and are updated monthly. Hover over a bar to see the exact figure for that month.
Home Sales Year-to-Date

About this chart

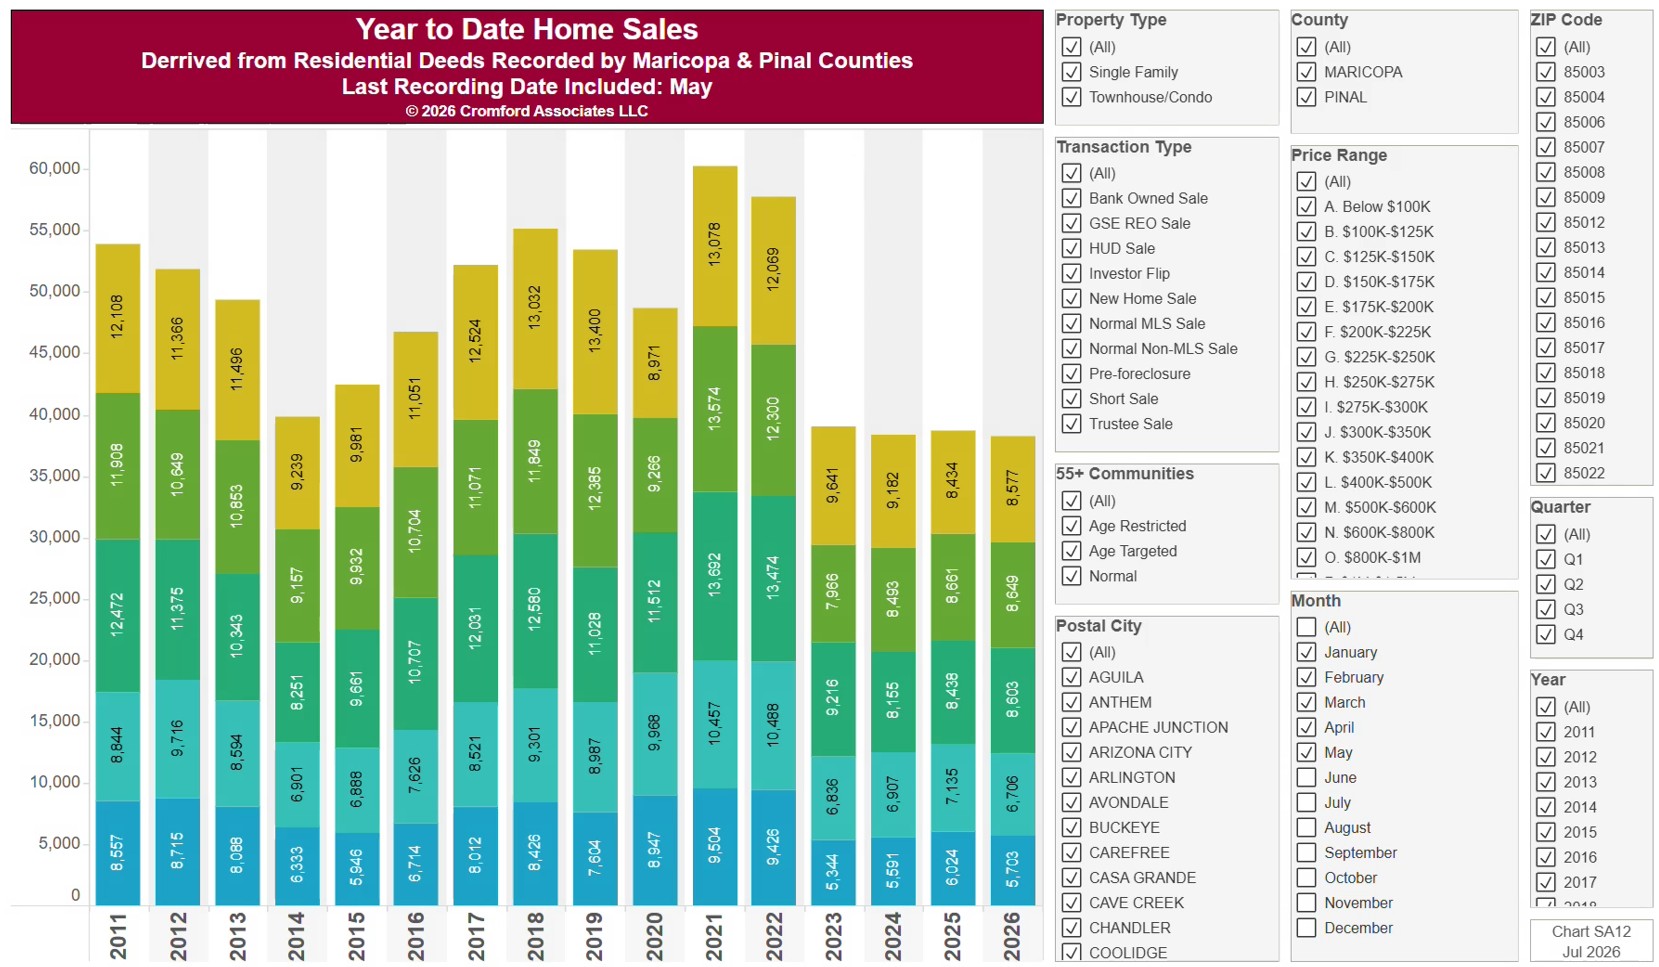
This chart counts the homes sold each year since 2011, from residential deeds recorded by Maricopa and Pinal Counties, with every year cut to the same months (January to the latest month recorded), so the current year can be compared fairly with earlier ones. Because it is built from recorded deeds, it covers every recorded sale, not just homes listed on ARMLS: new homes, private sales, and investor deals are all included.

It opens on Maricopa and Pinal Counties with everything included. Narrow it with the County, City, and ZIP panels, the Transaction Type, Property Type, and 55+ Communities boxes, and the sale price slider.

The records run to the end of last month and are updated monthly. Hover over a bar to see the exact figure for that year.

Annual Home Sales

About this chart

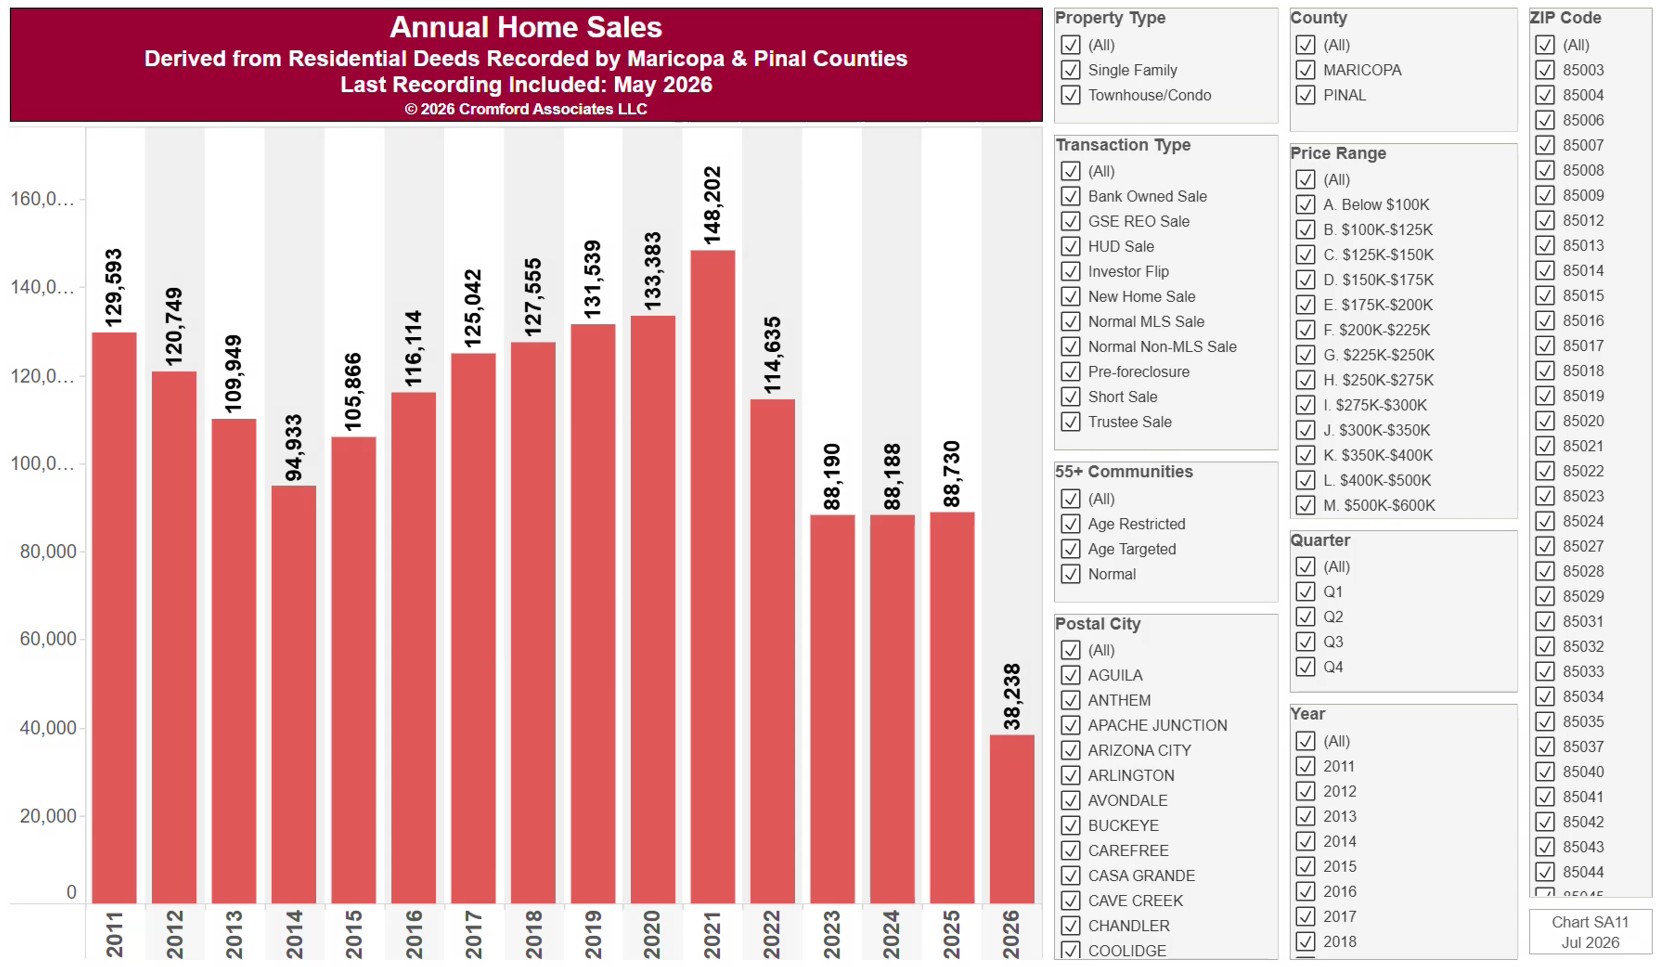
This chart counts the homes sold each calendar year since 2011, from residential deeds recorded by Maricopa and Pinal Counties. Because it is built from recorded deeds, it covers every recorded sale, not just homes listed on ARMLS: new homes, private sales, and investor deals are all included.

It opens on Maricopa and Pinal Counties with everything included. Narrow it with the County, City, and ZIP panels, the Transaction Type, Property Type, and 55+ Communities boxes, and the sale price slider.

The current year’s bar covers only the months recorded so far. SA12 compares every year over the same months. Hover over a bar to see the exact figure for that year.

Monthly Average Sale Price

About this chart

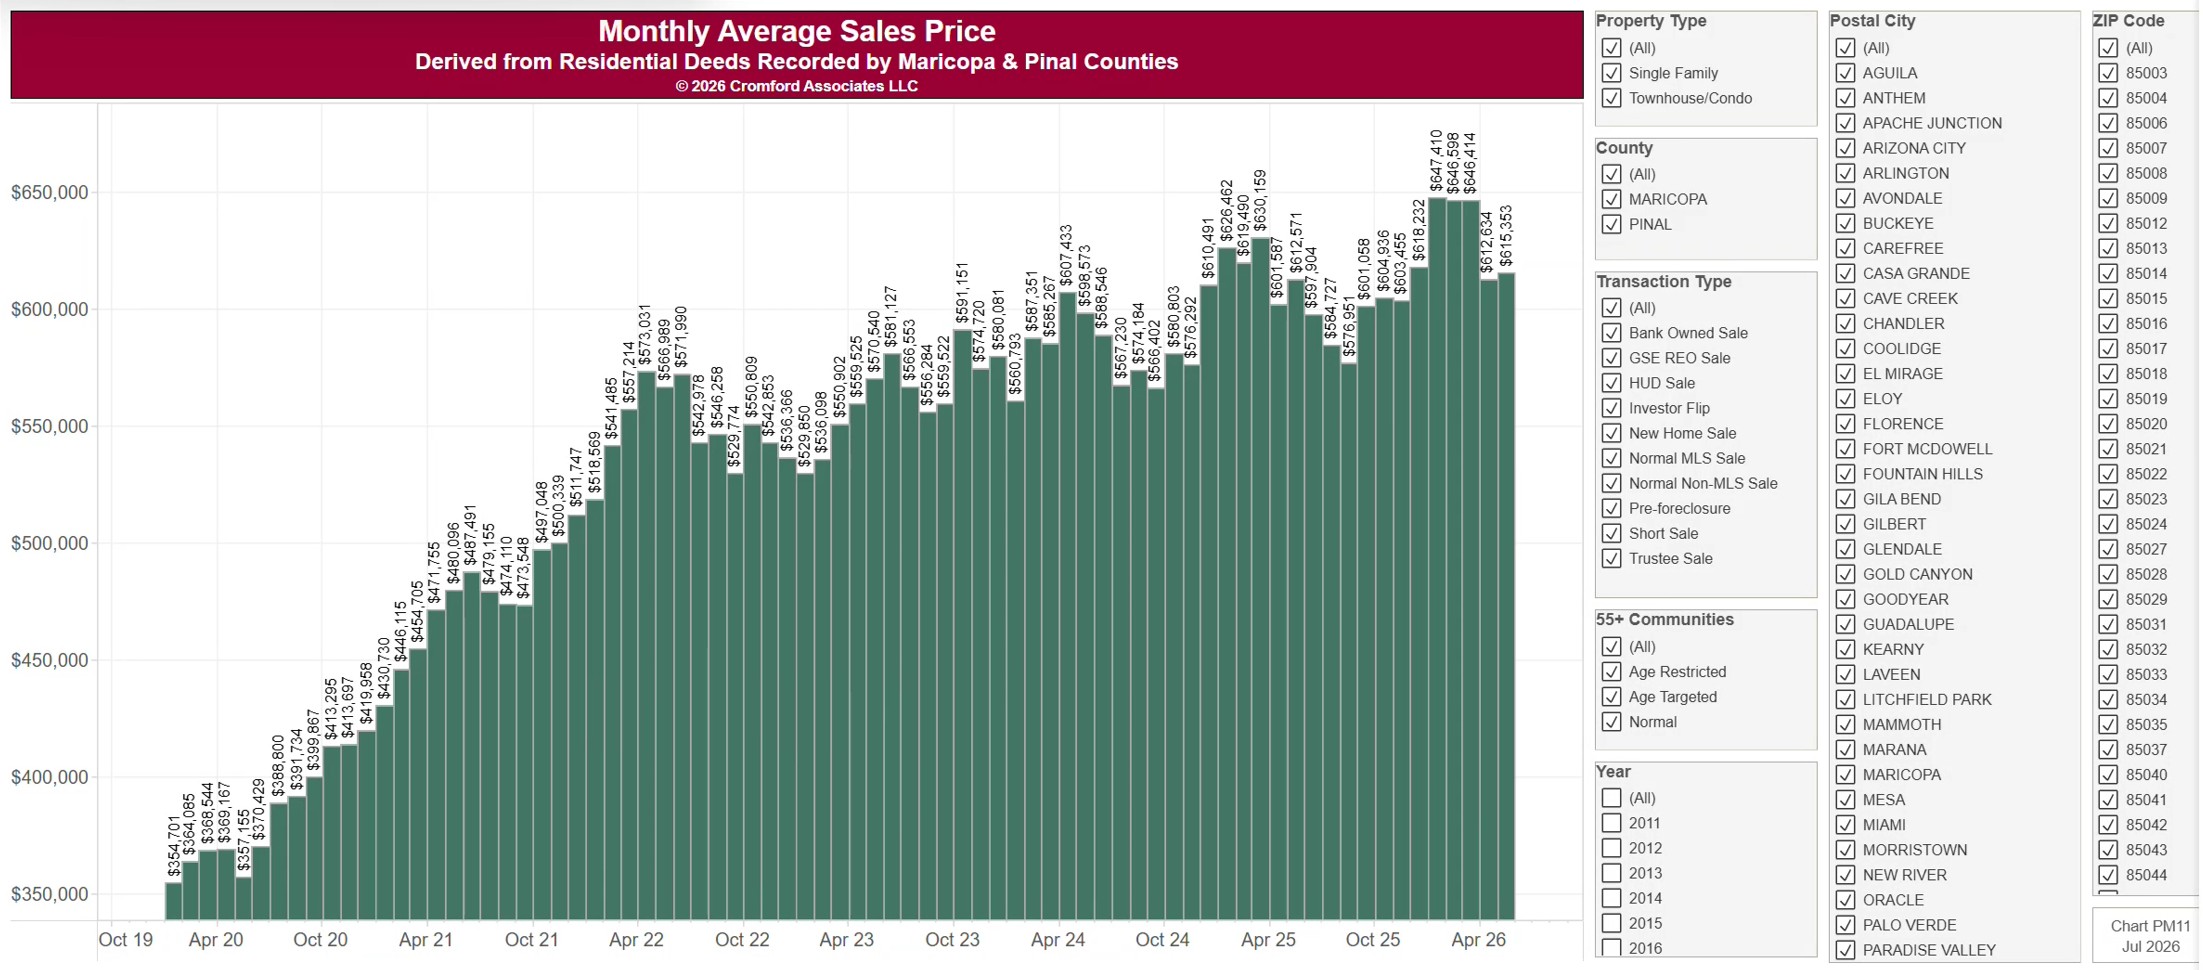
This chart shows the average sale price of homes, one bar per calendar month since January 2011, from residential deeds recorded by Maricopa and Pinal Counties. Sales of large, expensive homes pull the average up more than the median. Because it is built from recorded deeds, it covers every recorded sale, not just homes listed on ARMLS: new homes, private sales, and investor deals are all included.

It opens on Maricopa and Pinal Counties with everything included. Narrow it with the County, City, and ZIP panels, the Transaction Type, Property Type, and 55+ Communities boxes, and the sale price slider. Untick years in the Year panel to drop them from the chart.

The records run to the end of last month and are updated monthly. Hover over a bar to see the exact figure for that month.
OfferPad Sales in Greater Phoenix

About this chart

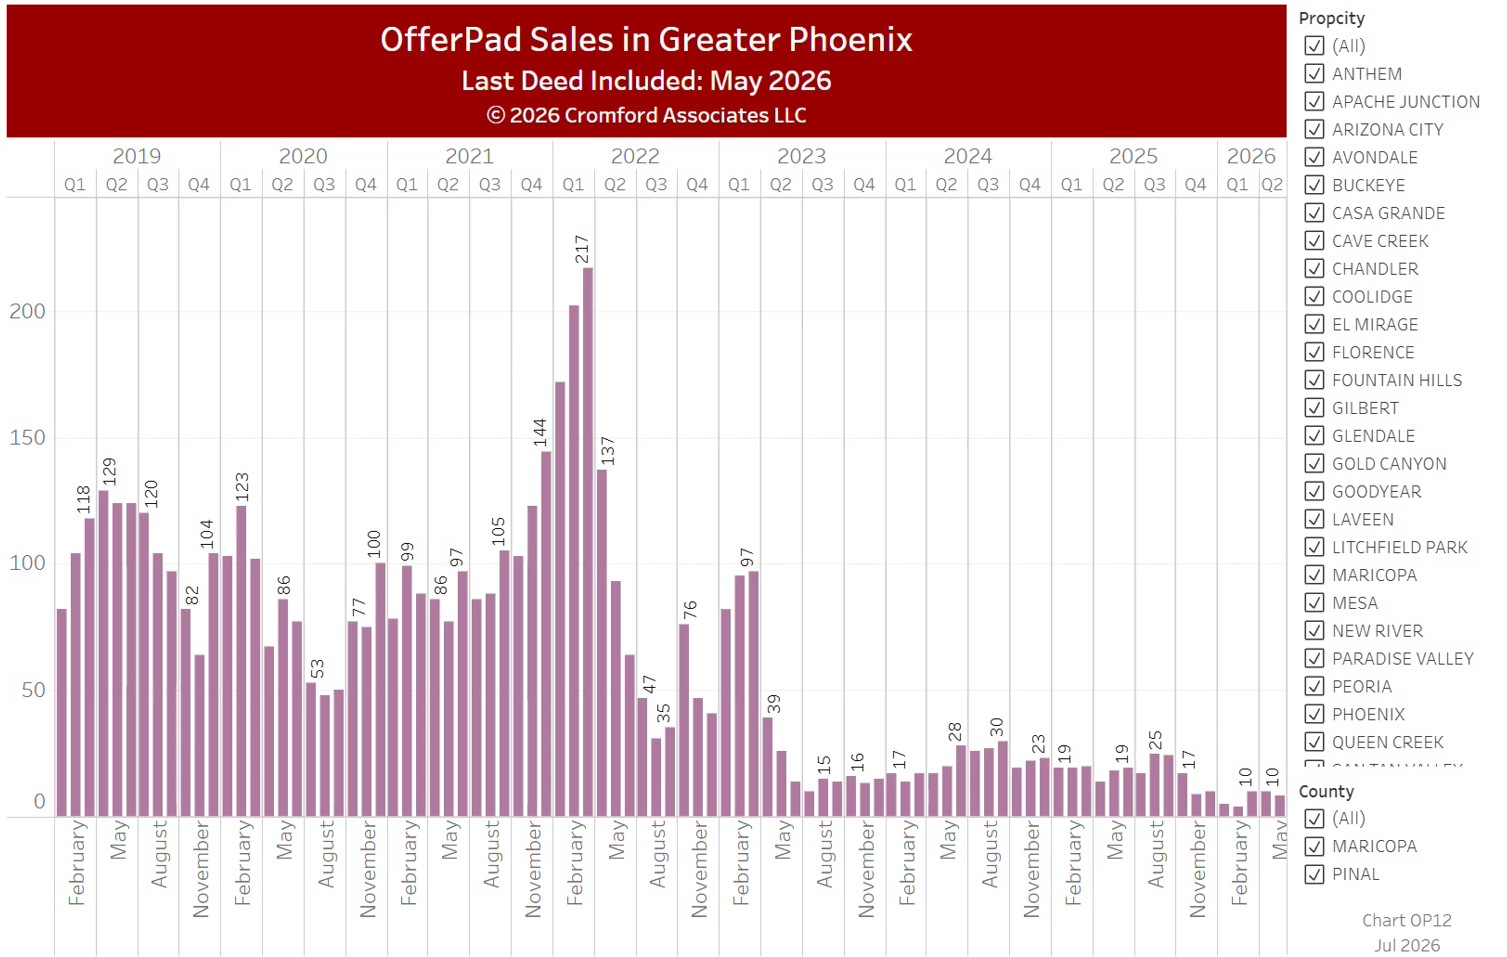
This chart counts the homes OfferPad sold each calendar month since January 2016, from residential deeds recorded by Maricopa and Pinal Counties. OfferPad is an iBuyer: it buys homes directly from owners and resells them. OP11 shows the homes it bought, so the two together show whether it is building up or running down its inventory.

It opens on Maricopa and Pinal Counties with everything included. Narrow it with the County, City, and ZIP panels, the Transaction Type, Property Type, and 55+ Communities boxes, and the sale price slider. Untick years in the Year panel to drop them from the chart.

The records run to the end of last month and are updated monthly. Hover over a bar to see the exact figure for that month.
OfferPad Purchases in Greater Phoenix

About this chart

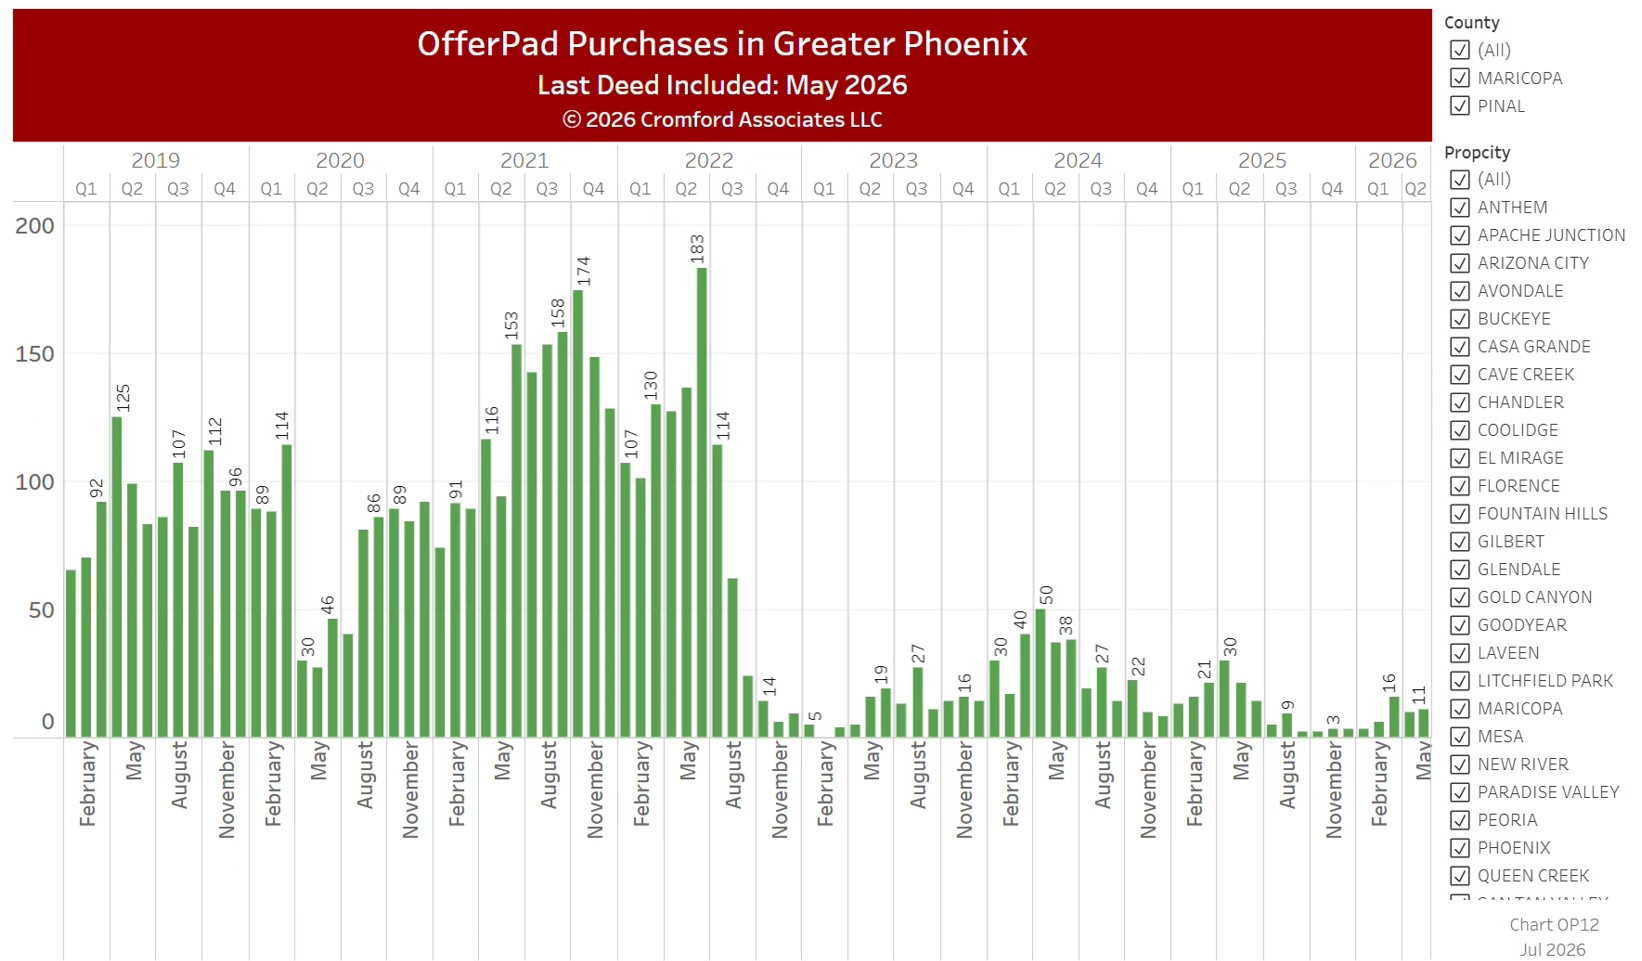
This chart counts the homes OfferPad bought each calendar month since November 2015, from residential deeds recorded by Maricopa and Pinal Counties. OfferPad is an iBuyer: it buys homes directly from owners and resells them. OP12 shows the homes it sold, so the two together show whether it is building up or running down its inventory.

It opens on Maricopa and Pinal Counties with everything included. Narrow it with the County, City, and ZIP panels, the Transaction Type, Property Type, and 55+ Communities boxes, and the sale price slider. Untick years in the Year panel to drop them from the chart.

The records run to the end of last month and are updated monthly. Hover over a bar to see the exact figure for that month.
Opendoor Sales in Greater Phoenix

About this chart

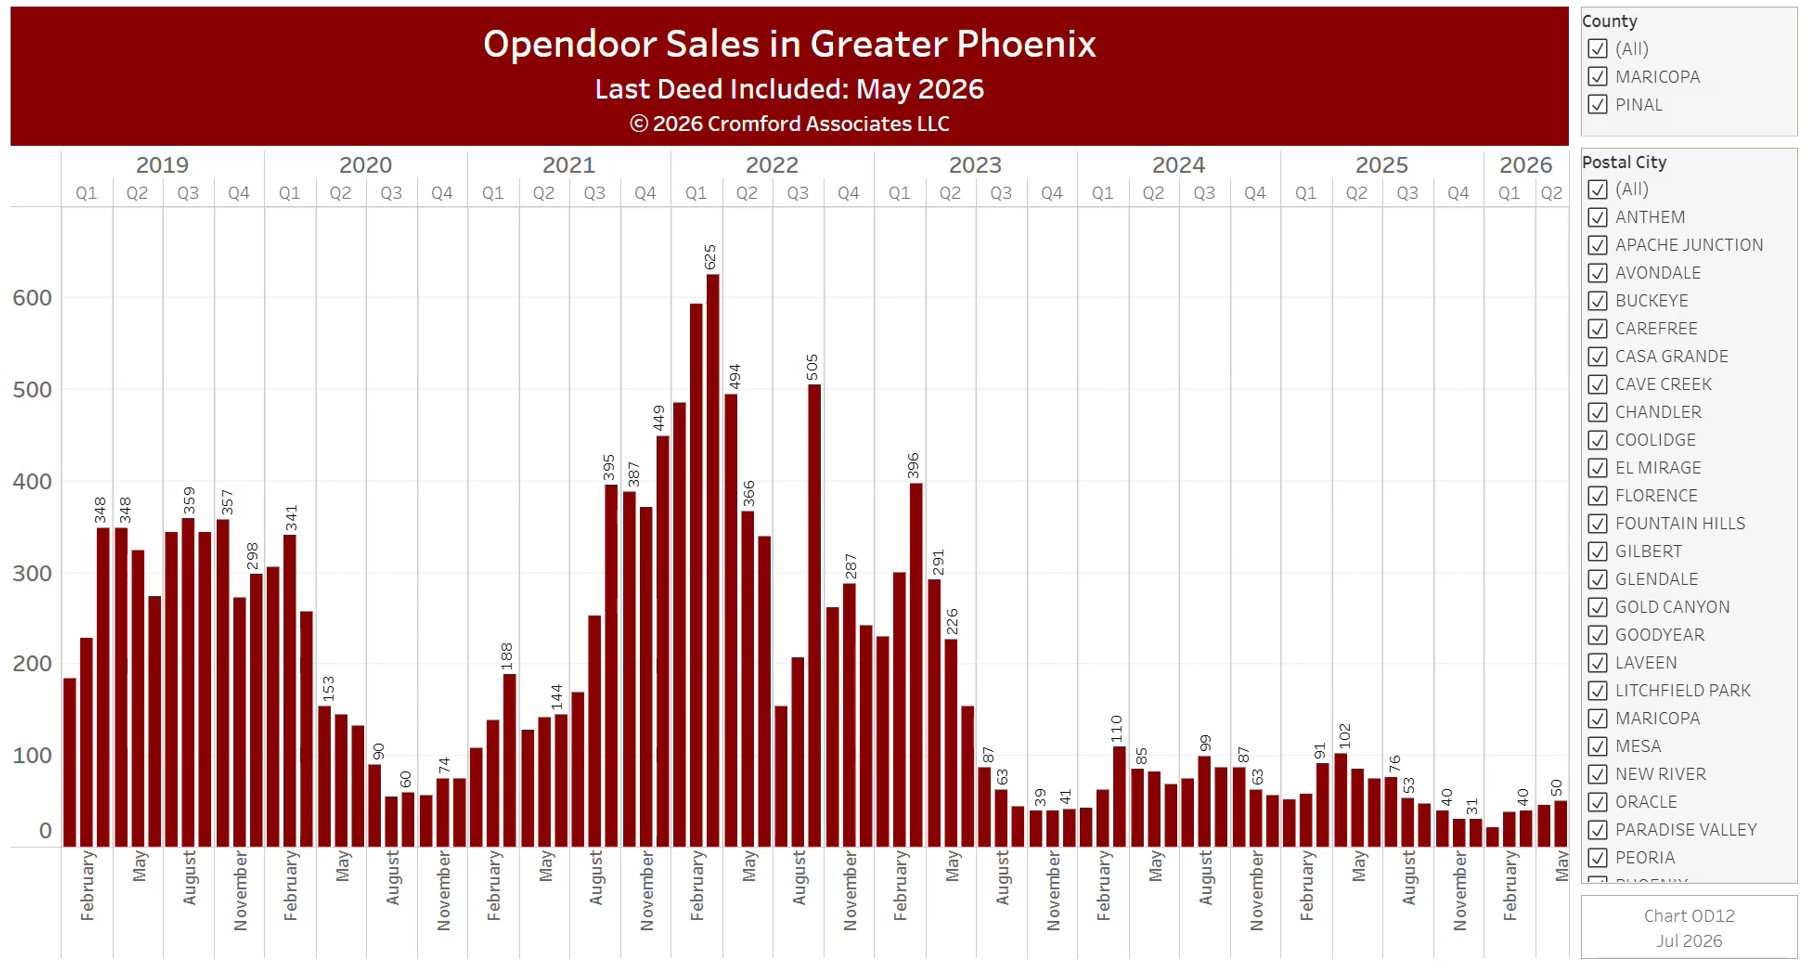
This chart counts the homes Opendoor sold each calendar month since November 2014, from residential deeds recorded by Maricopa and Pinal Counties. Opendoor is an iBuyer: it buys homes directly from owners and resells them. OD11 shows the homes it bought, so the two together show whether it is building up or running down its inventory.

It opens on Maricopa and Pinal Counties with everything included. Narrow it with the County, City, and ZIP panels, the Transaction Type, Property Type, and 55+ Communities boxes, and the sale price slider. Untick years in the Year panel to drop them from the chart.

The records run to the end of last month and are updated monthly. Hover over a bar to see the exact figure for that month.
Opendoor Purchases in Greater Phoenix

About this chart

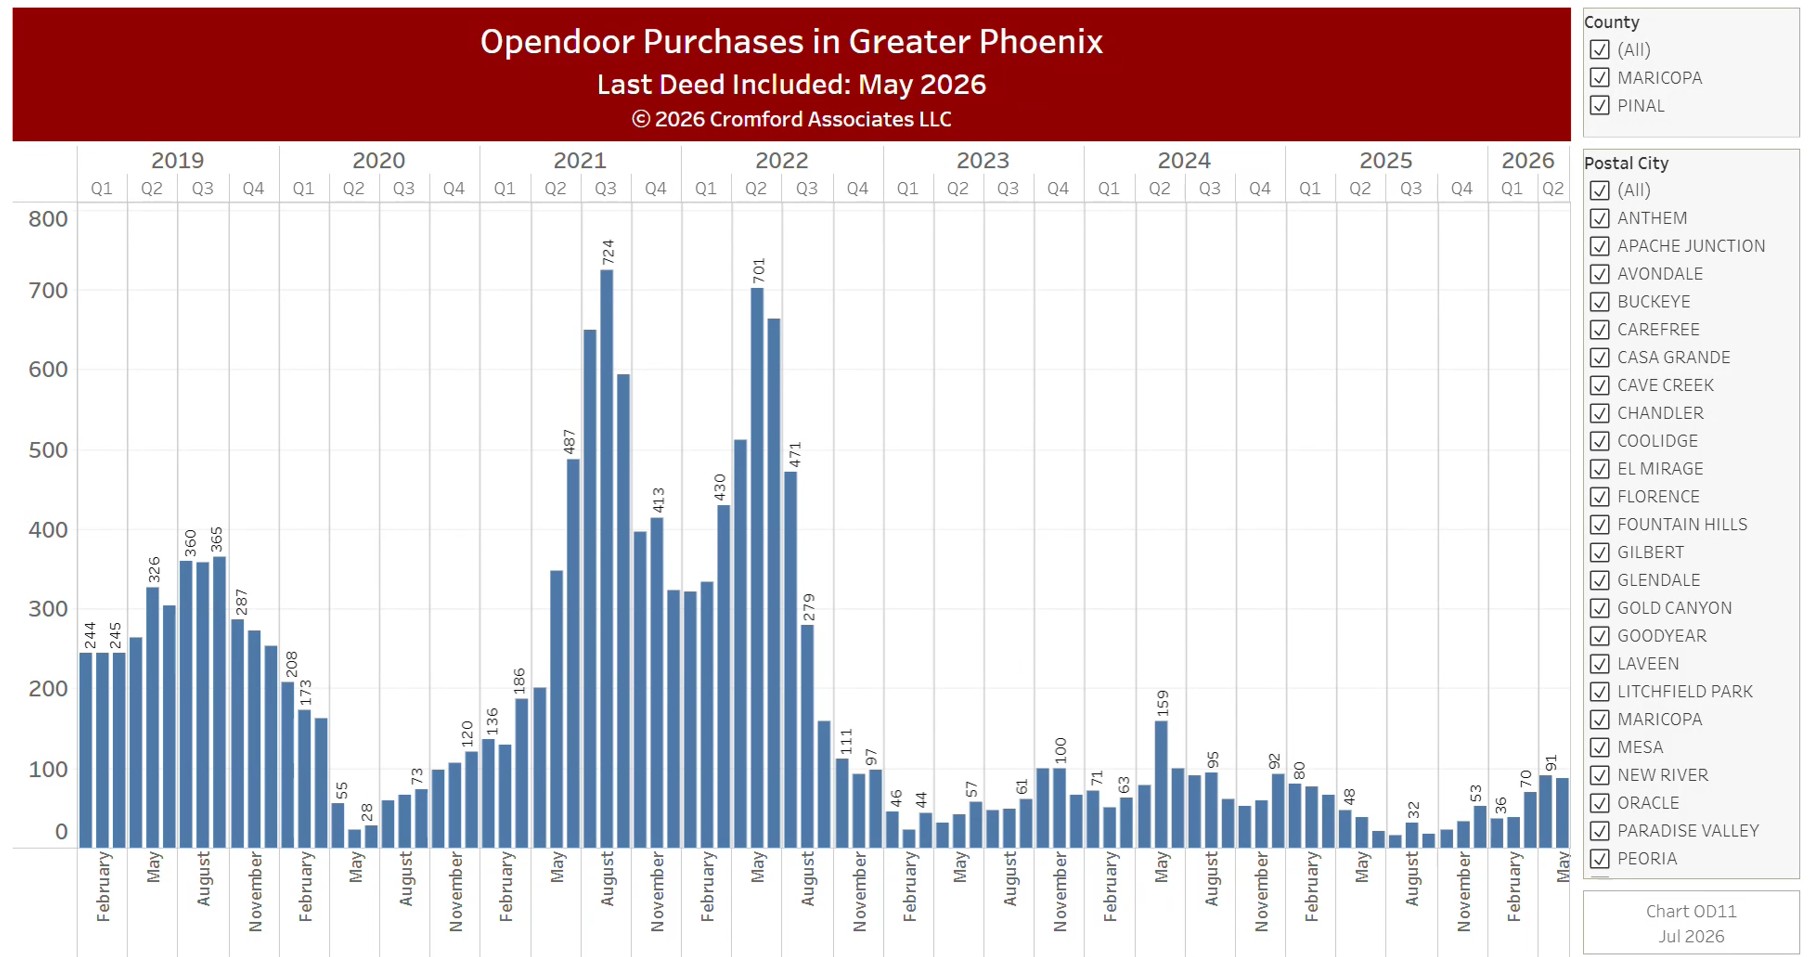
This chart counts the homes Opendoor bought each calendar month since August 2014, from residential deeds recorded by Maricopa and Pinal Counties. Opendoor is an iBuyer: it buys homes directly from owners and resells them. OD12 shows the homes it sold, so the two together show whether it is building up or running down its inventory.

It opens on Maricopa and Pinal Counties with everything included. Narrow it with the County, City, and ZIP panels, the Transaction Type, Property Type, and 55+ Communities boxes, and the sale price slider. Untick years in the Year panel to drop them from the chart.

The records run to the end of last month and are updated monthly. Hover over a bar to see the exact figure for that month.
New Home Closings by Price Range

About this chart

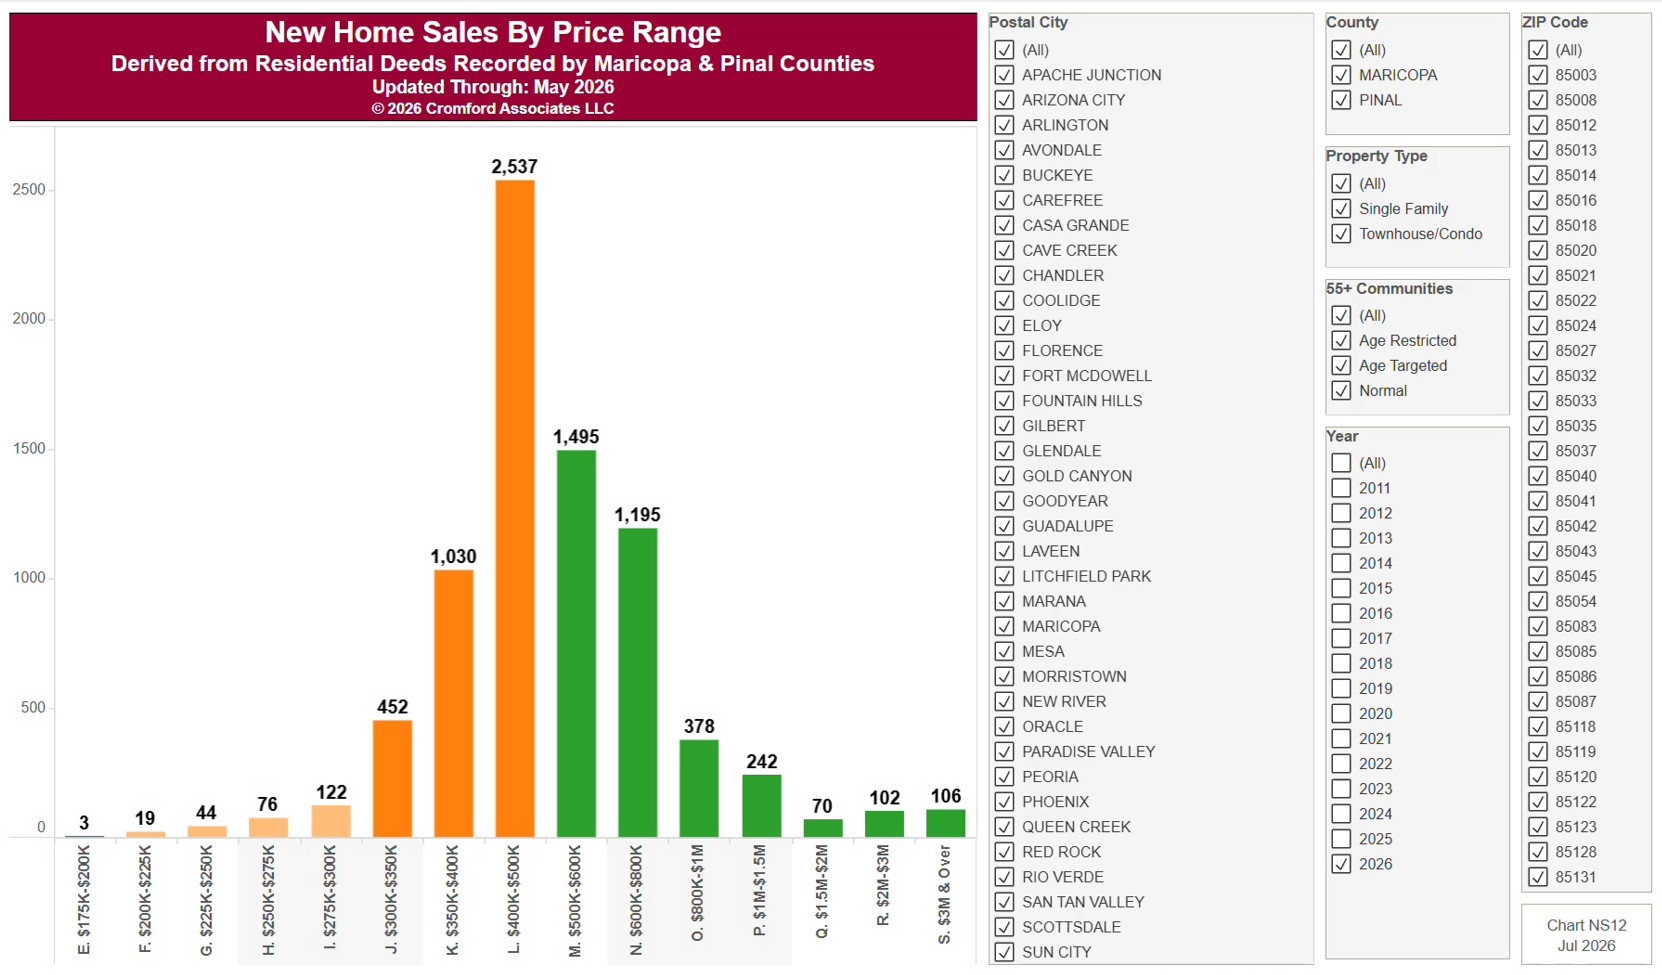
This chart counts new home closings in each price band, from below $100K up to $3M and over, from residential deeds recorded by Maricopa and Pinal Counties. It opens on the current year (January to the latest month recorded); tick more years in the Year panel to include them. To a builder a sale is the contract signature, months before the deed records, so we count closings.

It opens on Maricopa and Pinal Counties with everything included. Narrow it with the County, City, and ZIP panels and the Property Type and 55+ Communities boxes.

Hover over a bar to see the count for that price band.

New Home Closings Year-to-Date

About this chart

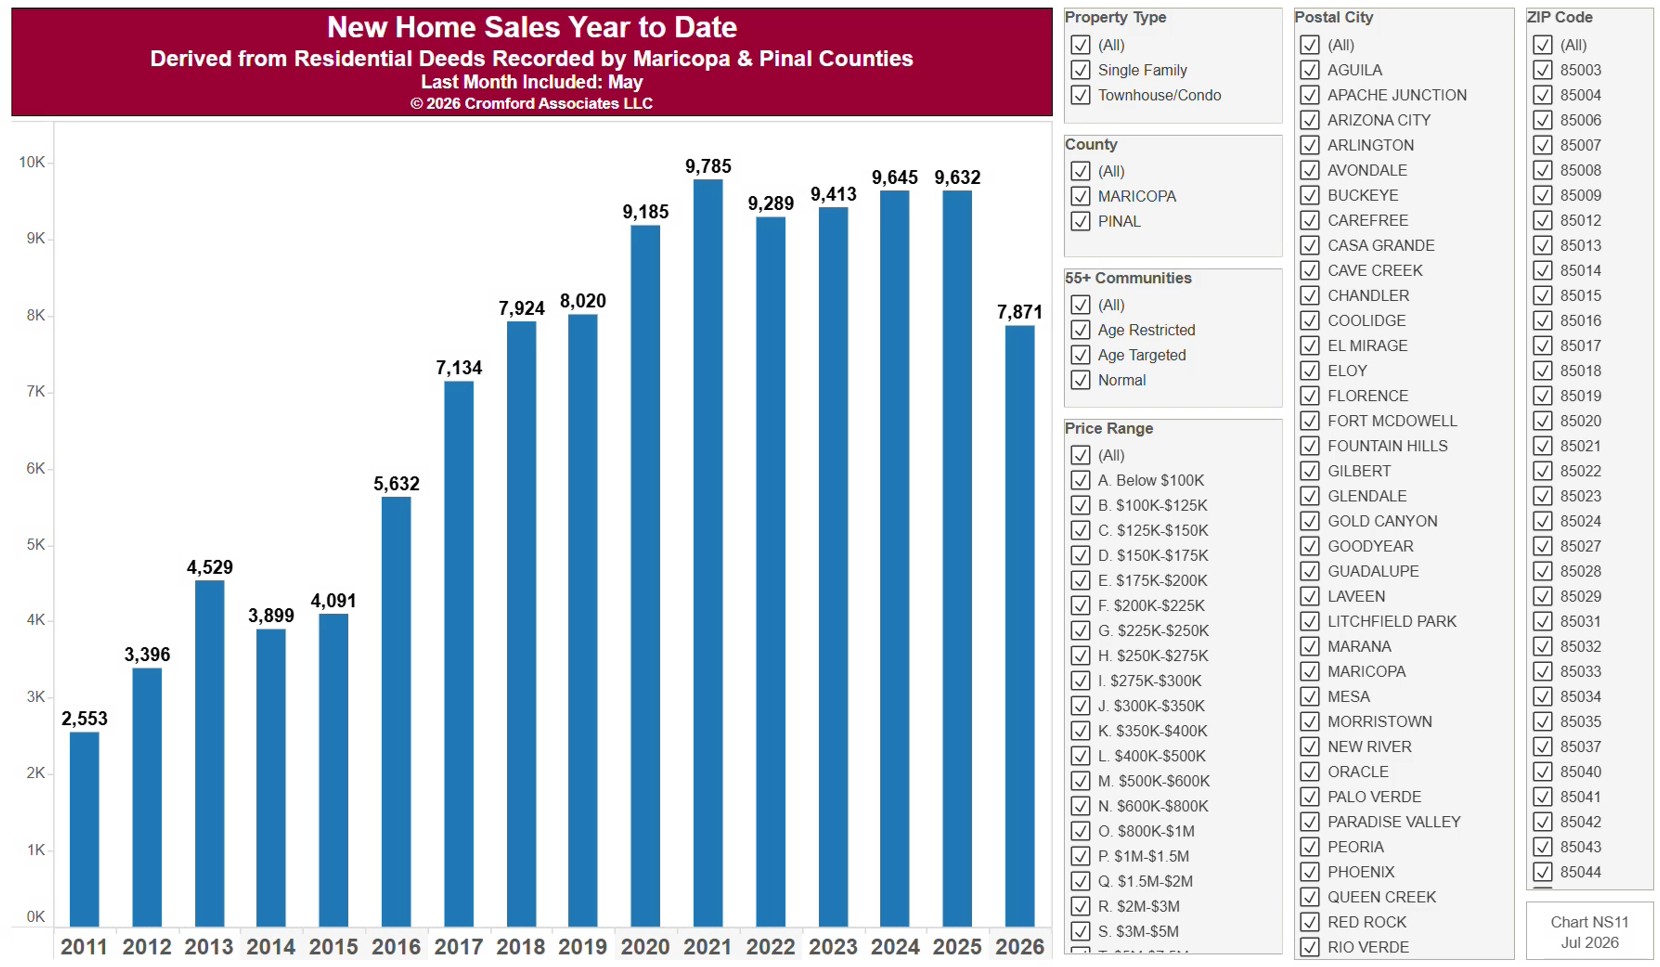
This chart counts new home closings each year since 2011, from residential deeds recorded by Maricopa and Pinal Counties, with every year cut to the same months (January to the latest month recorded) so the current year can be compared fairly with earlier ones. To a builder a sale is the contract signature, months before the deed records, so we count closings.

It opens on Maricopa and Pinal Counties with everything included. Narrow it with the County, City, and ZIP panels, the Property Type and 55+ Communities boxes, and the sale price slider.

The records run to the end of last month and are updated monthly. Hover over a bar to see the exact figure for that year.